Abstract
Objective
To evaluate whether a quantitative speech measure is effective in identifying and monitoring motor speech impairment (MSI) in patients with primary progressive aphasia (PPA) and to investigate the neuroanatomical basis of MSI in PPA.
Methods
Sixty-four patients with PPA were evaluated at baseline, with a subset (n = 39) evaluated longitudinally. Articulation rate (AR), a quantitative measure derived from spontaneous speech, was measured at each time point. MRI was collected at baseline. Differences in baseline AR were assessed across PPA subtypes, separated by severity level. Linear mixed-effects models were conducted to assess groups differences across PPA subtypes in rate of decline in AR over a 1-year period. Cortical thickness measured from baseline MRIs was used to test hypotheses about the relationship between cortical atrophy and MSI.
Results
Baseline AR was reduced for patients with nonfluent variant PPA (nfvPPA) compared to other PPA subtypes and controls, even in mild stages of disease. Longitudinal results showed a greater rate of decline in AR for the nfvPPA group over 1 year compared to the logopenic and semantic variant subgroups. Reduced baseline AR was associated with cortical atrophy in left-hemisphere premotor and supplementary motor cortices.
Conclusions
The AR measure is an effective quantitative index of MSI that detects MSI in mild disease stages and tracks decline in MSI longitudinally. The AR measure also demonstrates anatomic localization to motor speech–specific cortical regions. Our findings suggest that this quantitative measure of MSI might have utility in diagnostic evaluation and monitoring of MSI in PPA.
Motor speech impairment (MSI) is a key feature used to classify clinical variants of primary progressive aphasia (PPA), with apraxia of speech (AOS) as a diagnostic feature of nonfluent variant PPA (nfvPPA)1 and primary progressive AOS (PPAOS).2 Beyond syndromic classification, MSI also suggests an underlying taupoathy.3–7 Thus, measurement of MSI in PPA is important for both assessment of clinical syndrome and prediction of likely neuropathology.
Despite its importance, assessment of MSI is challenging even for experienced clinicians, who rely largely on subjective ratings of speech features.8 The critical need for improved diagnostic and longitudinal speech markers has motivated research into quantitative measures of MSI. Much of the research aiming to develop quantitative measures of MSI in PPA has focused on reduced speech rate,9–13 a core diagnostic feature of AOS and dysarthria.8,14 However, speech rate is influenced by both motor (i.e., speed of articulator movement) and language (i.e., word-finding pauses) factors,15 introducing a potential confound in a population with comorbid motor speech and aphasic deficits. In contrast, articulation rate, a measure of speaking rate exclusive of pauses, primarily captures motor-dependent factors and may thus be a better indicator of MSI but has received little study in PPA.10,16
In this study, we investigated whether articulation rate sensitively detects MSI in mild PPA, captures changes in MSI over time, and correlates with cortical thickness in regions of interest (ROIs) predicted to subserve motor speech function based on the Directions Into Velocities of Articulators (DIVA) model17 of speech motor control.
Methods
Patients
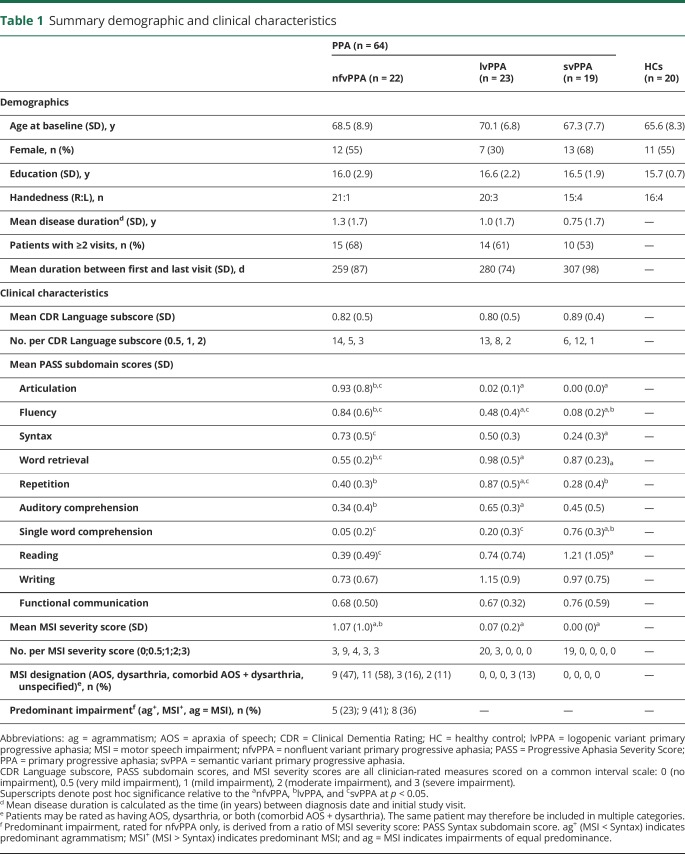
Sixty-four patients meeting the criteria for PPA were recruited from the PPA Longitudinal Cohort of the Massachusetts General Hospital (MGH) Frontotemporal Disorders Unit. Baseline clinical speech and language assessments were used to characterize patients and to subgroup them into nonfluent (nfvPPA; n = 22), logopenic (lvPPA; n = 23), and semantic (svPPA; n = 19) variants. Subtype diagnoses were determined by a neurologist in consultation with a speech-language pathologist, according to current consensus criteria.1 The Progressive Aphasia Severity Scale,18 an instrument used by clinicians to rate degree of impairment (0–3 interval scale) across 10 primary speech and language domains, was used to index severity of impairment in specific speech/language domains (e.g., fluency, lexical retrieval; table 1 and table e-1 available from Dryad, doi.org/10.5061/dryad.2jh157f). Overall severity of speech/language impairment was indexed with the Clinical Dementia Rating (CDR) supplemental Language box score (table e-2 available from Dryad).19 An individual's CDR Language score was then used to group patients into very mild (CDR Language score 0.5) and mild/moderate (CDR Language score 1,2) severity subgroups for cross-sectional analyses. Baseline speech/language characteristics per participant with PPA are reported in table e-1 available from Dryad (doi.org/10.5061/dryad.2jh157f). For longitudinal analyses, a subset (n = 39: 15 nfvPPA, 14 lvPPA, 10 svPPA) of the 64 patients with PPA were followed from initial visit to a reassessment ≈1 year after the initial visit.
Table 1.
Summary demographic and clinical characteristics
MSI was rated independently by a speech-language pathologist (M.Q.) and speech-language pathology clinical fellow (C.C.), with consensus ratings to resolve any discrepancies in individual ratings. For all patients, MSI ratings were done following diagnostic subtyping (i.e., MSI ratings were not used to inform or revise subtype diagnoses). The purpose of post hoc ratings of MSI was instead to provide a more detailed characterization of motor speech features than is typically assessed in a clinical speech/language evaluation.
To perform MSI ratings, each rater listened to a blinded spontaneous speech sample as well as recorded diadochokinetic tasks (e.g., /puhpuhpuh/, /puhtuhkuh/) when available. Overall severity of clinical MSI was rated on a scale from 0 to 3 (0 = no impairment, 3 = severe impairment). Operational definitions of clinical MSI at each severity interval are given in table e-3 available from Dryad (doi.org/10.5061/dryad.2jh157f). Percentage agreement between the 2 raters was 91% (κ = 0.91). For patients rated by consensus as having any degree of MSI, a follow-up rating was done to characterize the type of MSI (e.g., AOS, dysarthria, unspecified) according to specified speech characteristics8 (table e-4 available from Dryad, doi.org/10.5061/dryad.2jh157f).
Healthy controls
Two independent groups of age-matched healthy control (HC) participants were used for comparison to behavioral speech outcomes (i.e., articulation rate) and neuroimaging results. For the speech analyses, 20 age-matched healthy older controls were enrolled through the Speech and Feeding Disorders Laboratory at the MGH Institute of Health Professions (mean age 65.6 years, SD 8.3 years). HCs passed a hearing and cognitive screen, were native English speakers, and had no history of neurologic injury or developmental speech/language disorder. For neuroimaging analyses, the HC sample included scans from 115 older adults who were native English speakers with no history of neurologic or psychiatric disorder who were recruited at MGH (mean age 69.4 years, SD 7.4 years).
Standard protocol approvals, registrations, and patient consents
The study was approved by the Partners Human Research Committee, the Institutional Review Board of Partners HealthCare. All participants provided written informed consent before being enrolled in the study.
Speech data
Responses to the picnic scene picture description task of the Western Aphasia Battery–Revised20 were collected at baseline from all 64 patients with PPA and from 20 healthy age-matched controls. Responses to the same task were also collected at each follow-up visit for the subset (n = 39) of patients with PPA followed longitudinally. Audio was recorded with a digital recorder (Olympus [Center Valley, PA] VN-702PC for participants with PPA; Countryman [Menlo Park, CA] B3P4FF05B for control participants). Audio recordings were processed using a MATLAB-based program, Speech Pause Analysis, which algorithmically estimates speech and pause segments in continuous speech.21 Thresholds for the minimum duration of speech and pause events were set at 25 and 100 milliseconds, respectively. The program user must also identify a representative pause interval, which the program uses to calculate an amplitude threshold, defined as 3 SDs above the amplitude values obtained from the representative pause section. Segments of the waveform below the amplitude threshold are marked as pause intervals; those above the amplitude threshold are marked as speech intervals. A manual syllable count was calculated for each spontaneous speech sample using orthographic transcription, as described previously.22 Syllable counts and automatic Speech Pause Analysis output regarding the frequency and duration of speech events were combined to derive articulation rate (number of syllables divided by total speech duration).
Ten of the 84 audio samples (12%) were independently analyzed by a second researcher, who reran audio samples using the Speech Pause Analysis program, generated an independent orthographic transcription, and calculated articulation rate. Interrater agreement for the articulation rate measure in this subsample of participants was excellent (intraclass correlation coefficient 0.98, 95% confidence interval [CI] 0.91–0.99).
Behavioral analysis
Cross-sectional speech data were analyzed with analysis of variance (ANOVA) tests to determine significant between-group differences (nfvPPA, lvPPA, svPPA, HC) in baseline articulation rate, with post hoc tests (Tukey honestly significant difference) conducted as appropriate. Separate analyses were conducted for severity collapsed across all CDR Language subscores and within-group analysis for very mild (CDR Language subscore 0.5) and mild/moderate (CDR Language subscore 1,2) severity subgroups. Sensitivity and specificity were also calculated as measures of diagnostic accuracy of the articulation rate measure to detect motor speech-impaired nfvPPA patients compared to lvPPA, svPPA, and HCs. The pROC package23 was used for sensitivity/specificity analyses, with the optimal threshold determined by the Youden statistic.24 Sensitivity/specificity analyses used 2-way subgroup comparisons anchored on the nfvPPA group (e.g., nfvPPA vs lvPPA, nfvPPA vs svPPA) to reflect the sensitivity/specificity of articulation rate to identify MSI, with the assumption that nfvPPA is a motor speech-impaired subgroup whereas lvPPA and svPPA are non-motor speech-impaired subgroups. For this reason, 3 patients with nfvPPA who were judged by clinicians to have no MSI were excluded from the analysis. Similarly, the lvPPA group was restricted to those patients with no MSI; 3 patients with lvPPA were excluded on the basis of this criterion. No individuals were excluded from the svPPA or HC groups.
To examine between-group differences (PPA groups only) in longitudinal rates of change in articulation rate, linear mixed-effects models were conducted in R using the lme4 package.25 Articulation rate (syllables per second) served as the dependent variable, with fixed effects of time, subgroup, and their interaction (i.e., time × subgroup). The nfvPPA group was mapped to the intercept to maximize interpretability of model results. Participants were modeled as a random effect to account for individual variability in the intercept and slope of each participant's performance. This model was chosen as the most parsimonious on the basis of statistical comparisons of successively more complex models. An alternative model was run that included baseline severity, and although severity was a significant predictor in the model overall, it did not alter significance for the primary interaction term of interest (time × subgroup); thus, the more parsimonious model was selected.
Structural MRI data analysis
For both patient and HC samples, MRI scans were collected on a 3T Magnetome Tim Trio system (Siemens Medical Systems, Erlangen, Germany) with a 20-channel phased-array head coil. Three-dimensional T1-weighted magnetization-prepared rapid acquisition with gradient echo sequences (repetition time/echo time/flip angle 2.5 milliseconds/3.5 milliseconds/7°, resolution 1 mm3) were acquired for all participants. All left-handed participants with PPA were excluded from imaging analyses. Quantitative morphometric analysis of MRI data was performed with FreeSurfer analysis software, version 6.0.26 Each structural volume underwent spatial and intensity normalization, skull stripping, and an automated segmentation of cerebral white matter27 to locate the gray-white boundary. Defects in the surface topology were corrected,28 and the gray-white boundary was deformed outward using an algorithm designed to obtain an explicit representation of the pial surface. Cortical thickness was then derived from the distance between the gray-white boundary and the pial surface across the entire cortical mantle.29
Based on study hypotheses, we obtained cortical thickness for motor speech-related ROIs. ROIs were selected from simulated predictions of the Directions Into Velocities of Articulators (DIVA) model,17 a well-established model of speech motor control that localizes speech motor processes to stereotactic regions of the brain. The DIVA model identifies 2 complementary control subsystems underlying speech motor control, including feedforward (i.e., generation of predictive motor commands) and feedback (i.e., comparison of actual vs expected speech output) control. Feedforward control encompasses the 2 main aspects of motor speech function: motor planning/programming and motor execution of speech. In the current study, we use the DIVA model to make predictions about which brain regions are likely to be affected in the case of clinical MSI. These regions included the left-hemisphere inferior frontal gyrus, premotor cortex, supplementary motor area (SMA), and ventral motor cortex (vMC),17,30,31 areas shown to be associated with motor speech deficits, particularly AOS, in the broader motor speech disorders literature.32–36 ROIs were derived using the SpeechLabel cortical labeling system,37 which allows for the parcellation of each cortical hemisphere into 63 ROIs, including fine-grained subdivision of motor speech-relevant regions. Twelve SpeechLabel ROIs were selected for analysis (figure e-1 available from Dryad, doi.org/10.5061/dryad.2jh157f): dorsal pars opercularis (dIFo), ventral pars opercularis (vIFo), posterior inferior frontal sulcus (pIFs), ventral premotor cortex (vPMC), middle premotor cortex (midPMC), middle dorsal premotor cortex (mdPMC), posterior dorsal premotor cortex (pdPMC), vMC, middle motor cortex (midMC), dorsal motor cortex (dMC), SMA, and presupplementary motor area (preSMA). As a control region for nonspecific effects, we selected the SpeechLabel occipital cortex and anterior supramarginal gyrus (aSMG) regions, which are not hypothesized to underlie MSI.
To identify overall between-group differences in cortical thickness in ROIs, we conducted a multivariate ANOVA, with univariate ANOVAs conducted as follow-up tests to determine between-group differences per individual motor speech ROI.
Brain-behavior analyses
To test whether atrophy in our hypothesized ROIs correlates with reduced articulation rate (syllables per second), we used Pearson correlation coefficients. For the ROIs showing overall correlational significance across all PPA subtypes, post hoc correlations were conducted within subgroups to identify differential trends across subgroups. For all participants with PPA, scan dates were matched to behavioral time points (mean time difference 46 days, SD 67 days).
To test the specificity of the relationship between atrophy and reduced articulation rate, post hoc whole cortical analyses were performed. We used a generalized linear model (GLM) implemented in FreeSurfer to model the relationship between articulation rate and cortical thickness at each vertex point of the cortical surface. Articulation rate was modeled as the independent variable of variable of interest, with cortical thickness as the dependent variable across the whole PPA cohort. Because our primary hypothesis was unidirectional (i.e., reduced articulation rate is associated with cortical thinning in motor speech ROIs), a 1-tailed GLM was performed. Given the small sample size and specific a priori hypotheses, a 1-tailed statistical threshold of p < 0.01, uncorrected, was used for this analysis. We used this relatively liberal threshold with the consideration that if effects were found in speech motor control regions consistent with our ROI analysis but not in other cortical areas, this would provide strong support for the specificity of the effects. Results were visualized on an independent, template brain surface smoothed at a full-width/half-maximum value of 15.
Data availability
Anonymized data will be shared by request from any qualified investigator.
Results
Clinical results
Nineteen of 22 patients with nfvPPA (86%) were rated by consensus as having some degree of MSI (mean severity 1.07, SD 1.0; table 1). For 17 of 19 of these patients, MSI was judged to be of equal or greater predominance relative to a syntactic impairment. Of the 19 nfvPPA patients with MSI, 8 were designated as having primary dysarthria, 6 as having primary AOS, and 3 as having both dysarthria and AOS; 2 nfvPPA patients were rated as having MSI of unspecified type, which in both cases included a mildly reduced rate and occasional sound distortions not uniquely attributable to either dysarthria or AOS. Three of 23 patients with lvPPA were also rated as having mild MSI of unspecified type, characterized in all 3 cases by false starts and mild articulatory groping. No patients with svPPA were rated as having MSI. Detailed motor speech characteristics of the entire patient sample are summarized in table e-5 available from Dryad (doi.org/10.5061/dryad.2jh157f).
Group-level demographics and clinical characteristics are summarized in table 1. No significant between-group differences (nfvPPA, lvPPA, svPPA, HC) were observed in age, CDR Language severity, sex, level of education, or mean intervisit duration.
Cross-sectional behavioral results
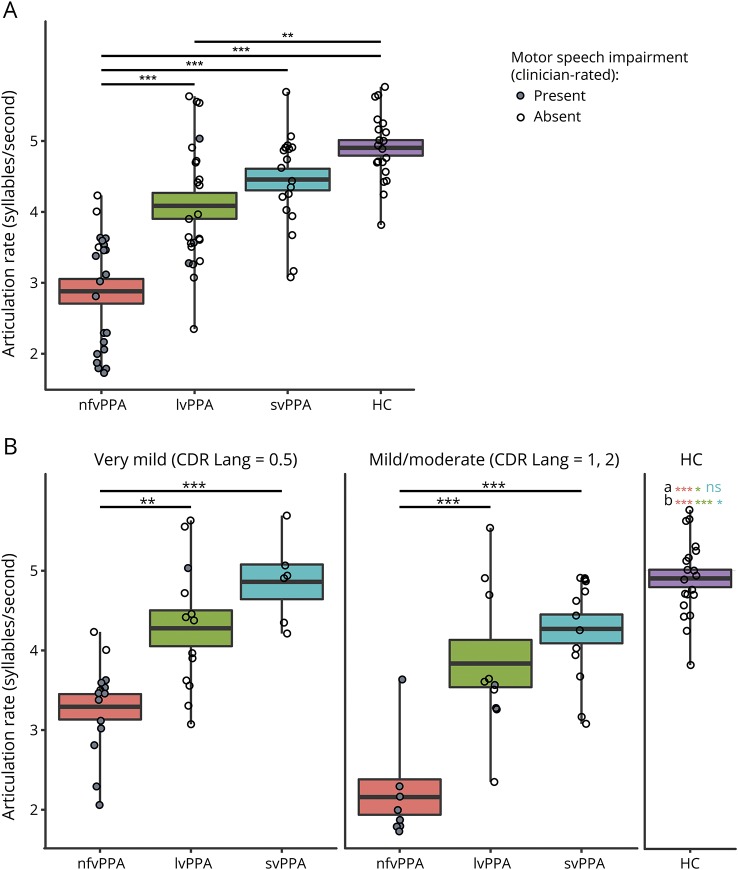
A 4-way ANOVA (nfvPPA, lvPPA, svPPA, HC) revealed between-group differences (F3,80 = 29.46, p < 0.001) in baseline articulation rate (syllables per second), taking into account patients of all severity levels as part of a single, group-level analysis (figure 1A). Specifically, articulation rate was reduced at the initial visit for the nfvPPA subgroup (mean articulation rate 2.88 syllables per second, SD 0.81) compared to the lvPPA subgroup (mean articulation rate 4.09, SD 0.88, p < 0.001), svPPA subgroup (mean articulation rate 4.46, SD 0.66, p < 0.001), and HCs (mean articulation rate 4.9, SD 0.49, p < 0.001). Baseline articulation rate also differentiated the lvPPA group from HCs (p < 0.01).
Figure 1. Baseline AR is reduced for patients with nfvPPA.
(A) Articulation rate (AR) at baseline is significantly lower for patients with nonfluent variant primary progressive aphasia (nfvPPA) compared to healthy controls (HCs) and patients with all other primary progressive aphasia (PPA) subtypes. AR is also reduced for patients with logopenic variant PPA (lvPPA) compared to HCs. Patients of all severity levels are included in this analysis. (B) Among patients of very mild disease severity, AR at baseline is significantly lower for the nfvPPA group compared with other PPA subtypes. AR is even more significantly reduced for patients of mild/moderate severity. aSignificant between-group difference between HCs and PPA subgroups in very mild severity subgroup. Color coding denotes significance for specific between-group comparisons (pink shows HC vs nfvPPA, green shows HC vs lvPPA, teal shows HC vs semantic variant PPA [svPPA]). bSignificant between-group difference between HCs and PPA subgroups in mild/moderate severity subgroup. Color coding denotes significance for specific between-group comparisons. Thick line shows mean; boxes show SEM. CDR = Clinical Dementia Rating; ns = nonsignificant. **p < 0.01, ***p < 0.001.
In a second-level analysis in which patients were subgrouped by severity level, ANOVA results revealed between-group differences in baseline articulation rate within both very mild (CDR Language subscore 0.5; F3,49 = 20.68, p < 0.001) and mild/moderate (CDR Language subscore 1, 2; F3,47 = 34.04, p < 0.001) severity subgroups (figure 1B). Within the very mild severity subgroup, patients with nfvPPA had lower baseline articulation rate (mean 3.29, SD 0.61) compared to patients with lvPPA (mean articulation rate 4.28, SD 0.81, p = 0.001) and those with svPPA (mean articulation rate 4.86, SD 0.53, p < 0.001). Within the mild/moderate severity subgroup, the baseline articulation rate for patients with nfvPPA (mean 2.16, SD 0.63) was likewise reduced relative to patients with lvPPA (mean articulation rate 3.84, SD 0.94, p < 0.001) and svPPA (mean articulation rate 4.27, SD 0.65, p < 0.001). There were no significant differences between lvPPA and svPPA groups within either the very mild or mild/moderate severity subgroup. Both nfvPPA and lvPPA groups were significantly differentiable from HCs in very mild (HC vs nfvPPA group p < 0.001, HC vs lvPPA p = 0.03) and mild/moderate (HC vs nfvPPA p < 0.001, HC vs lvPPA p < 0.001) severity subgroups. The svPPA group was marginally differentiable from HCs in the mild/moderate severity subgroup (p = 0.05) but not in the very mild subgroup.
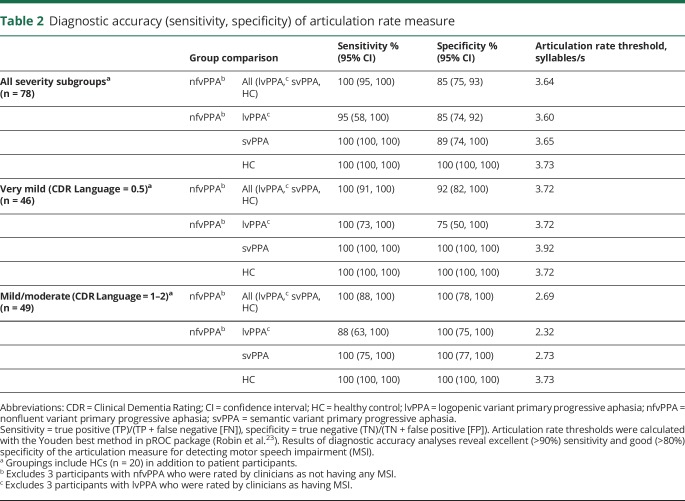
The sensitivity of the articulation rate measure for identifying nfvPPA relative to the pooled lvPPA, svPPA, and HC samples was 100% (95% CI 95–100). The specificity of the articulation rate measure for that same comparison was 85% (95% CI 75–93). The sensitivity and specificity of the articulation rate measure for identifying nfvPPA within the very mild severity subgroup (plus HCs) were 100% (95% CI 91–100) and 92% (95% CI 82–100), respectively, indicating excellent overall diagnostic accuracy even in early stages of disease progression. Diagnostic accuracy measures, including binary subgroups comparisons (i.e., nfvPPA vs lvPPA, nfvPPA vs svPPA, nfvPPA vs HC) per severity subgroup, are reported in table 2.
Table 2.
Diagnostic accuracy (sensitivity, specificity) of articulation rate measure
Longitudinal behavioral results
Linear mixed-effects results revealed a significant overall linear trend in articulation rate (syllables per second) over time (p < 0.001) within the pooled PPA sample; fixed-effect estimates for the time × subgroup interaction revealed differential rates of change in articulation rate within each of the PPA subgroups. Specifically, the linear decline in articulation rate over time was greater for the nfvPPA group compared to both the lvPPA (p = 0.004) and svPPA (p = 0.015) groups. The average annual rate of change in articulation rate was −0.69 (95% CI −1.03 to −0.38) among patients with nfvPPA, −0.04 (95% CI −0.80 to 0.72) for patients with lvPPA, and −0.14 (95% CI −0.92 to 0.63) for patients with svPPA. Figure 2 shows individual linear trends in articulation rate grouped by diagnostic subgroup (figure 2A), averaged linear trends in articulation rate per subgroup (figure 2B), and linear mixed-effects model parameter estimates (figure 2C).
Figure 2. AR declines more rapidly for patients with nfvPPA over a 1-year period.
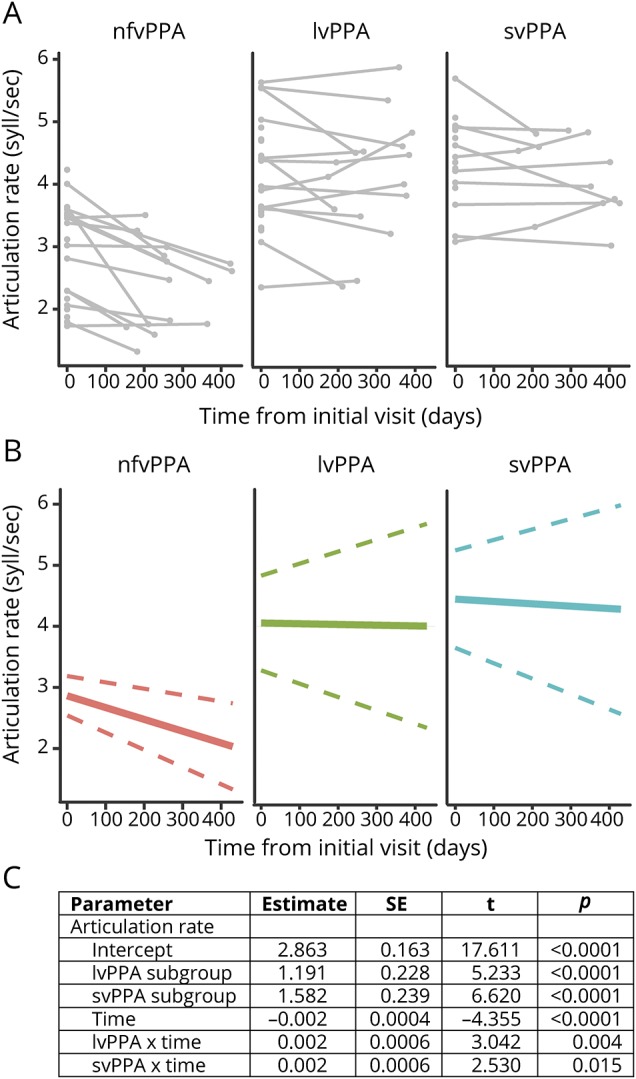
Longitudinal data collected for a subset (n = 39) of patients with primary progressive aphasia (PPA) reveal a significantly more rapid decline in articulation rate (AR) for patients with nonfluent variant PPA (nfvPPA) compared to those with logopenic variant PPA (lvPPA) and semantic variant PPA (svPPA). (A) Individual data points at baseline and (when available) the follow-up visit separated by subgroup. Connected lines show individual trends. (B) Subgroup trends in AR as a function of time based on linear mixed-effects (LME) model output. Solid line shows mean group slope; dashed line shows 95% confidence interval of mean group slope. (C) LME results demonstrate significant main effects of subgroup, time, and time × subgroup interaction. SE = standard error.
Imaging results
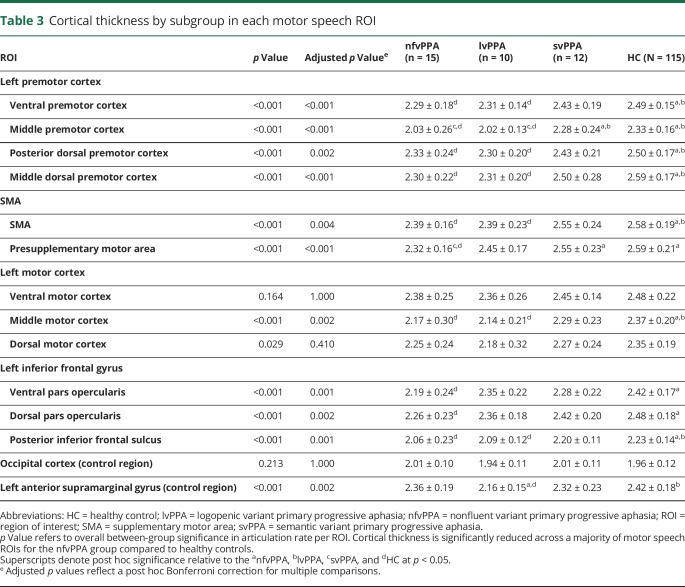
Multivariate ANOVA results revealed between-group (nfvPPA, lvPPA, svPPA, HC) differences in cortical thickness in hypothesis-driven ROIs (F3,148 = 2.35, p < 0.001). Compared to HCs, the nfvPPA group exhibited thinner cortex for a majority of motor speech ROIs, specifically regions of the premotor cortex (vPMC, midPMC, pdPMC, mdPMC), SMA (SMA, preSMA), and inferior frontal gyrus (vIFo, dIFo, pIFs) and a single subregion of the motor cortex (midMC). There were no significant group differences in cortical thicknesses of vMC and dMC ROIs or in the control region selected from the occipital cortex. For the left aSMG control region, there was a significant overall group difference in cortical thickness; however, there was no difference in cortical thickness between the nfvPPA group and HCs specifically. Between-group comparisons across all groups are reported in table 3.
Table 3.
Cortical thickness by subgroup in each motor speech ROI
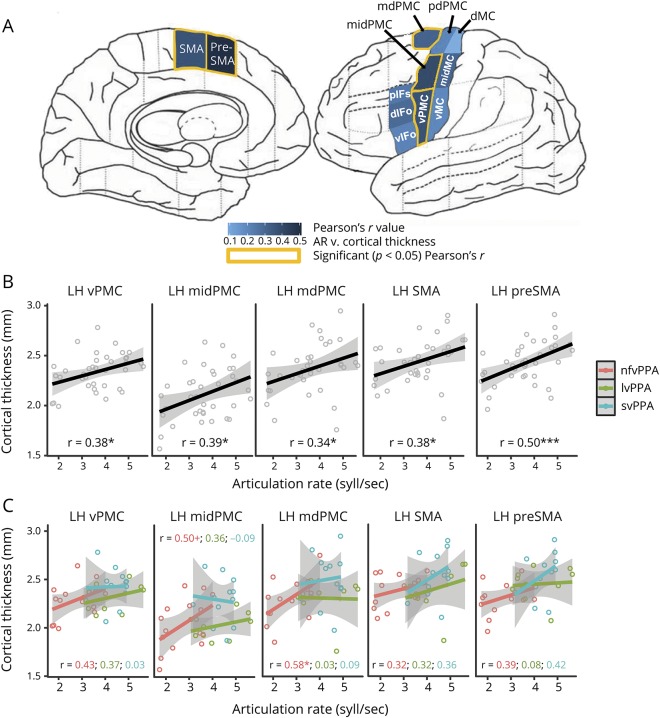
Brain-behavior analyses showed that atrophy in motor speech ROIs correlated with reduced articulation rate (syllables per second). Specifically, articulation rate correlated with cortical thickness in vPMC (r[35] = 0.384, p = 0.019), midPMC (r[35] = 0.389, p = 0.017), mdPMC (r[35] = 0.340, p = 0.039), SMA (r[35] = 0.375, p = 0.022), and preSMA (r[35] = 0.504, p = 0.001). Correlations between articulation rate and cortical thickness in the remaining hypothesized motor speech ROIs, including the pdPMC, vMC, midMC, dMC, vIFo, dIFo, and pIFs, were also positive but not statistically significant. There was no relationship between articulation rate and cortical thickness in either of the regions used as control ROIs, including the occipital cortex region (r[35] = 0.011, p = 0.950) and the left aSMG (r[35] = −0.022, p = 0.895). Figure 3 depicts the strength of correlation between articulation rate and the a priori motor speech ROIs (figure 3A). Figure 3B shows the articulation rate plotted against cortical thickness for each ROI showing overall significance, using pooled patient data (nfvPPA, lvPPA, svPPA). Additional correlation analyses (following up on overall pooled patient results) show within-group trends that mirror trends of pooled patient data (figure 3C), particularly for the nfvPPA group, although small sample sizes within each subgroup limit these analyses and the likelihood of detecting statistical significance.
Figure 3. Slower AR is correlated with thinner cortex in select motor speech ROIs.
Strength of correlations between articulation rate (AR) and supplementary motor and premotor area regions of interest (ROIs) is greater than with inferior frontal or motor cortex ROIs. (A) Pearson r values are shown per ROI, along with significant (p < 0.05) correlations. (B) Scatterplot showing relationship between AR and cortical thickness using pooled subgroup data for each ROI returning overall group significance. (C) Scatterplot showing relationship between AR and cortical thickness using separate subgroup (nonfluent variant primary progressive aphasia [nfvPPA], logopenic variant primary progressive aphasia [lvPPA], semantic variant primary progressive aphasia [svPPA]) data for each ROI returning overall group significance. For panels B and C, open dots denote individual data, solid lines show linear group/subgroup trend, and gray-shaded region show 95% confidence interval. dIFo = dorsal pars opercularis; dMC = dorsal motor cortex; LH = left hemisphere; mdPMC = middle dorsal premotor cortex; midMC = middle motor cortex; midPMC = middle premotor cortex; pdPMC = posterior dorsal premotor cortex; pIFs = posterior inferior frontal sulcus; SMA = supplementary motor area; vIFo = ventral pars opercularis; vMC = ventral motor cortex; vPMC = ventral premotor cortex. *p < 0.05, **p < 0.01. +p < 0.1.
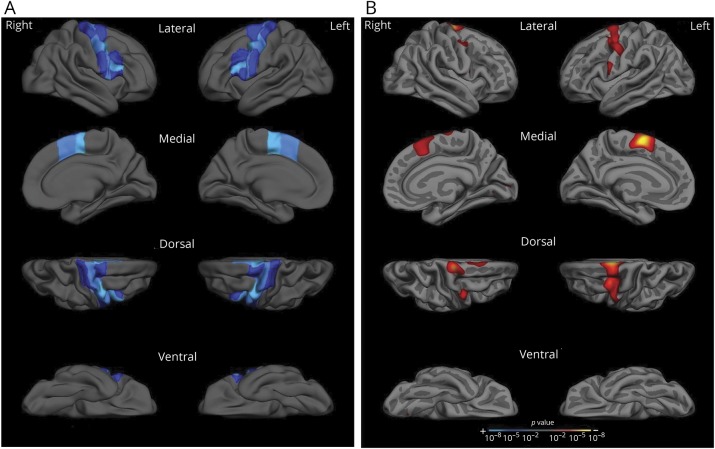
A final set of analyses characterized the anatomic and behavioral specificity of these findings. Results of the whole-cortex GLM analysis revealed an association (p < 0.01) between reduced articulation rate at baseline and cortical atrophy with a left-lateralized, regionally specific localization that included the premotor and middle motor cortex and medially in the SMA. A similar, weaker association was observed in corresponding right-hemisphere regions. Crucially, the whole-cortex GLM revealed no significant association between reduced articulation rate and cortical thinning in any regions outside premotor area and SMAs and an isolated portion of the motor cortex, suggesting a high degree of regional specificity for the articulation rate measure (figure 4).
Figure 4. Reduced articulation rate is associated with premotor and supplementary motor cortical atrophy.
(A) Reference figure. To assist with visual interpretation of whole cortical surface results in panel B, motor speech regions of interest are projected onto a template brain surface. (B) Whole cortical surface results. Whole cortical surface generalized linear model analysis demonstrates an association with cortical thinning in premotor and supplementary motor areas and reduced articulation rate at baseline within the pooled group of patients with primary progressive aphasia. This association was stronger in left-hemisphere regions compared to corresponding right-hemisphere regions. A p < 0.01, 1-tailed significance threshold was used for this analysis. Results are visualized on an independent template brain surface smoothed at a full-width/half-maximum value of 15.
Discussion
We found that articulation rate is an effective quantitative behavioral marker of MSI in PPA, both for detecting mild MSI and measuring MSI decline over time. Reduced articulation rate is associated with cortical atrophy in specific hypothesized motor speech regions, reinforcing the biological validity of this quantitative behavioral speech measure.
Although MSI is widely discussed in the PPA literature in terms of its importance in determining diagnostic subgroups,1,2,38 there remains little guidance on how to effectively assess MSI. Several recent studies focused on the predictive value of motor speech characteristics have acknowledged the need for objective, quantifiable measures of MSI.5 Results from the current study suggest that articulation rate could be one such proxy for MSI in a PPA population. Specifically, the articulation rate measure differentiated a motor speech-impaired nfvPPA group from non-motor speech-impaired subgroups in even the mildest stages of disease. Reduced speaking rate is a core diagnostic feature for both AOS and dysarthria and is a core feature of the newly defined prosodic subtype of PPAOS.39 Thus, the reliable quantification of reduced speech rate, along with its ability to sensitively detect even very mild MSI, holds promise for improved diagnosis of motor speech subtypes in PPA. On a cautionary note, however, it is important to acknowledge that although reduced rate of speech has been reliably linked to MSI in the literature,10,16 other potential factors can also reduce speech rate, including lexical retrieval difficulties, slowed processing speed, and executive dysfunction. Articulation rate was selected as the primary speech measure because it is unaffected by pausing behavior,15,40 which is known to be responsive to cognitive and linguistic (i.e., nonmotor) deficits.41,42 In addition, prior findings have demonstrated the superiority of articulation rate over more global measures of speaking rate for differentiating nfvPPA from other PPA subtypes.10,22
Besides diagnostic utility, results of the current study suggest that articulation rate may be responsive to change and thus useful for clinical monitoring. In a group of patients with nfvPPA whose motor speech function is known clinically to decline over time,43 the articulation rate measure provided quantitative substantiation of motor speech decline within a relatively short period of 1 year. This result adds to the emerging body of literature that has used baseline motor speech characteristics to track and predict the rate of decline in a PPA population.43 Reliable monitoring of subtle declines in motor speech function holds great clinical value for providers seeking to advise their patients on topics such as advance planning for augmentative and alternative communication. The ability to detect subtle changes in motor speech function is also likely to become increasingly important as more tauopathy-focused clinical trials emerge that require reliable behavioral endpoints to measure clinically meaningful effects of therapeutic agents on motor speech function.
Imaging results from the current study support the regional specificity of the articulation measure: reduced articulation rate was associated with cortical thinning in regions important for speech motor planning and programming, including the premotor cortex (PMC) and SMA. The associations we found between MSI and the anatomic integrity of the PMC and SMA are highly consistent with previously published results.32,44,45 However, additional regions found to be anatomic correlates of MSI in several of these prior studies, for instance, the posterior inferior frontal lobe,46 supramarginal gyrus,10 and anterior insula,47 were not found to be significantly correlated with reduced articulation rate in the current study. We hypothesize that this result of regional specificity for the articulation rate measure reflects the fact that it is a more direct proxy of MSI (cf. generalized speech rate measures). This finding is in line with results from a prior study in the poststroke literature showing a dissociation between motor speech-specific, compared to language-specific, lesion patterns.44 In the progressive aphasia literature, a similar dissociation in atrophy patterns has also been demonstrated, primarily with regard to PPAOS.3,32,48
In this study, application of a theoretically grounded model of speech motor control, the DIVA model, allowed for a selection of ROIs that the model predicts to be associated with specific subprocesses of speech motor control. In the DIVA model, early planning/programming of syllables is localized to left premotor cortex, with later-stage execution of the motor plan localized to the ventral motor cortex; the left SMA is involved with speech initiation and is therefore also crucial for speech motor control. Other leading theories of speech motor control, including the hierarchical state feedback control49 model, also ascribe importance to the left ventral premotor and motor cortices for speech production. In addition, a recent review of the speech motor literature includes the ventral premotor and primary motor cortices, posterior inferior frontal gyrus, and SMA among the most commonly implicated regions for speech production in the speech neuroimaging literature.50
The DIVA model offers a framework in which to interpret results of the current study. Specifically, we conclude that because reduced articulation rate correlates with thinning in the premotor and supplementary motor cortices, more so than the primary motor cortex, a reduced rate in nfvPPA likely reflects a predominant motor planning/programming disorder. This interpretation is consistent with recent meta-analyses that have reported a higher incidence of AOS (a motor planning/programming disorder) compared to dysarthria (a motor execution disorder) in nfvPPA and PPAOS.16
An important limitation of the current study centers on the grouping of participants with nfvPPA. In line with current consensus criteria, we opted for a maximally inclusive nfvPPA group that includes individuals with either syntactic deficits or MSI. It is possible that separating the group on the basis of predominant impairment (motor speech vs syntactic) may reveal differential subgroup patterns for the articulation rate measure; this type of follow-up analysis should be considered for future studies with larger sample sizes. A second limitation of the current study is that our brain-behavior analyses were focused only on cortical thickness as a preliminary test of select DIVA model predictions. We did not investigate either subcortical structures or white matter degeneration, both of which have been shown in prior work to be affected in motor speech impaired populations.6,35 The limiting of imaging analyses to cortical gray matter may be one reason we found imaging evidence for a primary planning/programming disorder despite clinical characterizations of several patients with nfvPPA as primarily dysarthric. It is possible that more detailed investigation of subcortical structures and white matter tracts would reveal a more widespread atrophy pattern that would better account for the motor execution, in addition to planning/programming, deficits.
In addition to the above limitations, future work is needed to extend the findings of the current study and to use objective measures to characterize MSI in patients with supportive biomarkers of tau pathology or in patients with autopsy-confirmed tau pathology. Inclusion of biomarkers or pathology-confirmed cases will serve to establish a more definitive link between MSI, as measured objectively, and underlying tau pathology.
Acknowledgment
The authors thank Jason Tourville, PhD (Boston University) for sharing the SpeechLabel parcellation scheme (R01 DC002852, R01 DC007683; F. Guenther, PI). The authors thank Annie Fox-Galalis, PhD (MGH Institute of Health Professions) for consulting on statistical analyses, as well as Lee Richardson, MS, CCC-SLP (Massachusetts General Hospital), for help with acquisition of data. They also thank Rajeshwari Jakkam for assistance with the analysis of data.
Glossary
- ANOVA
analysis of variance
- AOS
apraxia of speech
- aSMG
anterior supramarginal gyrus
- CDR
Clinical Dementia Rating
- CI
confidence interval
- dIFo
dorsal pars opercularis
- DIVA
Directions Into Velocities of Articulators
- dMC
dorsal motor cortex
- GLM
generalized linear model
- lvPPA
logopenic variant primary progressive aphasia
- mdPMC
middle dorsal premotor cortex
- MGH
Massachusetts General Hospital
- midMC
middle motor cortex
- midPMC
middle premotor cortex
- MSI
motor speech impairment
- nfvPPA
nonfluent variant primary progressive aphasia
- pdPMC
posterior dorsal premotor cortex
- pIFs
posterior inferior frontal sulcus
- PPA
primary progressive aphasia
- PPAOS
primary progressive apraxia of speech
- preSMA
presupplementary motor area
- ROI
region of interest
- SMA
supplementary motor area
- svPPA
semantic variant primary progressive aphasia
- vIFo
ventral pars opercularis
- vMC
ventral motor cortex
- vPMC
ventral premotor cortex
Appendix. Authors
Study funding
This work was funded by the NIH (R01DC014296 to B.C.D.; R01DC013547 and K24DC016312 to J.R.G.; F31DC015703 to C.C.).
Disclosure
C. Cordella, M. Quimby, A. Touroutoglou, and M. Brickhouse report no disclosures relevant to the manuscript. J. Green receives grant support from the NIH. B. Dickerson receives grant support from the NIH. Dr. Dickerson serves on scientific advisory boards for Merck, Lilly, Biogen, and Wave LifeSciences. Go to Neurology.org/N for full disclosures.
References
- 1.Gorno-Tempini ML, Hillis AE, Weintraub S, et al. Classification of primary progressive aphasia and its variants. Neurology 2011;76:1006–1014. [DOI] [PMC free article] [PubMed] [Google Scholar]
- 2.Josephs KA, Duffy JR, Strand EA, et al. Characterizing a neurodegenerative syndrome: primary progressive apraxia of speech. Brain 2012;135:1522–1536. [DOI] [PMC free article] [PubMed] [Google Scholar]
- 3.Josephs KA, Duffy JR, Strand EA, et al. Clinicopathologic and imaging correlates of progressive aphasia and apraxia of speech. Brain J Neurol 2006;129:1385–1398. [DOI] [PMC free article] [PubMed] [Google Scholar]
- 4.Josephs KA, Petersen RC, Knopman DS, et al. Clinicopathologic analysis of frontotemporal and corticobasal degenerations and PSP. Neurology 2006;66:41–48. [DOI] [PubMed] [Google Scholar]
- 5.Santos-Santos MA, Mandelli ML, Binney RJ, et al. Features of patients with nonfluent/agrammatic primary progressive aphasia with underlying progressive supranuclear palsy pathology or corticobasal degeneration. JAMA Neurol 2016;73:733–742. [DOI] [PMC free article] [PubMed] [Google Scholar]
- 6.Grossman M. Primary progressive aphasia: clinicopathological correlations. Nat Rev Neurol 2010;6:88–97. [DOI] [PMC free article] [PubMed] [Google Scholar]
- 7.Grossman M. The non-fluent/agrammatic variant of primary progressive aphasia. Lancet Neurol 2012;11:545–555. [DOI] [PMC free article] [PubMed] [Google Scholar]
- 8.Strand EA, Duffy JR, Clark HM, Josephs KA. The apraxia of speech rating scale: a tool for diagnosis and description of apraxia of speech. J Commun Disord 2014;51:43–50. [DOI] [PMC free article] [PubMed] [Google Scholar]
- 9.Ash S, Moore P, Vesely L, et al. Non-fluent speech in frontotemporal lobar degeneration. J Neurolinguist 2009;22:370–383. [DOI] [PMC free article] [PubMed] [Google Scholar]
- 10.Wilson SM, Henry ML, Besbris M, et al. Connected speech production in three variants of primary progressive aphasia. Brain 2010;133:2069–2088. [DOI] [PMC free article] [PubMed] [Google Scholar]
- 11.Ash S, Evans E, O'shea J, et al. Differentiating primary progressive aphasias in a brief sample of connected speech. Neurology 2013;81:329–336. [DOI] [PMC free article] [PubMed] [Google Scholar]
- 12.Fraser KC, Meltzer JA, Graham NL, Leonard G, Black SE, Rochon E. Automated classification of primary progressive aphasia subtypes from narrative speech transcripts. Cortex 2014;55:43–60. [DOI] [PubMed] [Google Scholar]
- 13.Sajjadi SA, Patterson K, Tomek M, Nestor PJ. Abnormalities of connected speech in the non-semantic variants of primary progressive aphasia. Aphasiology 2012;26:1219–1237. [Google Scholar]
- 14.Duffy JR. Motor Speech Disorders—E-Book: Substrates, Differential Diagnosis, and Management. Philadelphia: Elsevier Health Sciences; 2013. [Google Scholar]
- 15.Nip ISB, Green JR. Increases in cognitive and linguistic processing primarily account for increases in speaking rate with age. Child Dev 2013;84:1324–1337. [DOI] [PMC free article] [PubMed] [Google Scholar]
- 16.Poole ML, Brodtmann A, Darby D, Vogel AP. Motor speech phenotypes of frontotemporal dementia, primary progressive aphasia, and progressive apraxia of speech. J Speech Lang Hear Res 2017;60:897–911. [DOI] [PubMed] [Google Scholar]
- 17.Tourville JA, Guenther FH. The DIVA model: a neural theory of speech acquisition and production. Lang Cogn Process 2011;26:952–981. [DOI] [PMC free article] [PubMed] [Google Scholar]
- 18.Sapolsky D, Bakkour A, Negreira A, et al. Cortical neuroanatomic correlates of symptom severity in primary progressive aphasia. Neurology 2010;75:358–366. [DOI] [PMC free article] [PubMed] [Google Scholar]
- 19.Morris JC. Clinical Dementia Rating: a reliable and valid diagnostic and staging measure for dementia of the Alzheimer type. Int Psychogeriatr 1997;9(suppl 1):173–178. [DOI] [PubMed] [Google Scholar]
- 20.Kertesz A. Western Aphasia Battery (Revised). San Antonio: PsychCorp; 2007. [Google Scholar]
- 21.Green JR, Beukelman DR, Ball LJ. Algorithmic estimation of pauses in extended speech samples of dysarthric and typical speech. J Med Speech Lang Pathol 2004;12:149–154. [PMC free article] [PubMed] [Google Scholar]
- 22.Cordella C, Dickerson BC, Quimby M, Yunusova Y, Green JR. Slowed articulation rate is a sensitive diagnostic marker for identifying non-fluent primary progressive aphasia. Aphasiology 2017;31:241–260. [DOI] [PMC free article] [PubMed] [Google Scholar]
- 23.Robin X, Turck N, Hainard A, et al. pROC: an open-source package for R and S+ to analyze and compare ROC curves. BMC Bioinformatics 2011;12:77. [DOI] [PMC free article] [PubMed] [Google Scholar]
- 24.Youden WJ. Index for rating diagnostic tests. Cancer 1950;3:32–35. [DOI] [PubMed] [Google Scholar]
- 25.Bates D, Mächler M, Bolker B, Walker S. Fitting linear mixed-effects models using lme4. J Stat Software 2015;67:1–48. [Google Scholar]
- 26.Fischl B, Destrieux C, Halgren E, et al. Parcellating the human cerebral cortex. Cereb Cortex 2004;14:11–22. [DOI] [PubMed] [Google Scholar]
- 27.Dale AM, Fischl B, Sereno MI. Cortical surface-based analysis, I: segmentation and surface reconstruction. Neuroimage 1999;9:179–194. [DOI] [PubMed] [Google Scholar]
- 28.Fischl B, Liu A, Dale AM. Automated manifold surgery: constructing geometrically accurate and topologically correct models of the human cerebral cortex. IEEE Trans Med Imaging 2001;20:70–80. [DOI] [PubMed] [Google Scholar]
- 29.Fischl B, Dale AM. Measuring the thickness of the human cerebral cortex from magnetic resonance images. Proc Natl Acad Sci USA 2000;97:11050–11055. [DOI] [PMC free article] [PubMed] [Google Scholar]
- 30.Bohland JW, Guenther FH. An fMRI investigation of syllable sequence production. Neuroimage 2006;32:821–841. [DOI] [PubMed] [Google Scholar]
- 31.Peeva MG, Guenther FH, Tourville JA, Nieto-Castanon JL, Nazarian B, Alario FX. Distinct representations of phonemes, syllables, and supra-syllabic sequences in the speech production network. Neuroimage 2010;50:626–638. [DOI] [PMC free article] [PubMed] [Google Scholar]
- 32.Utianski RL, Whitwell JL, Schwarz CG, et al. Tau-PET imaging with [18F]AV-1451 in primary progressive apraxia of speech. Cortex 2018;99:358–374. [DOI] [PMC free article] [PubMed] [Google Scholar]
- 33.Botha H, Utianski RL, Whitwell JL, et al. Disrupted functional connectivity in primary progressive apraxia of speech. Neuroimage Clin 2018;18:617–629. [DOI] [PMC free article] [PubMed] [Google Scholar]
- 34.Josephs KA, Duffy JR, Strand EA, et al. The evolution of primary progressive apraxia of speech. Brain 2014;137:2783–2795. [DOI] [PMC free article] [PubMed] [Google Scholar]
- 35.Graff-Radford J, Jones DT, Strand EA, Rabinstein AA, Duffy JR, Josephs KA. The neuroanatomy of pure apraxia of speech in stroke. Brain Lang 2014;129:43–46. [DOI] [PMC free article] [PubMed] [Google Scholar]
- 36.Josephs KA, Duffy JR, Strand EA, et al. Syndromes dominated by apraxia of speech show distinct characteristics from agrammatic PPA. Neurology 2013;81:337–345. [DOI] [PMC free article] [PubMed] [Google Scholar]
- 37.Cai S, Tourville JA, Beal DS, Perkell JS, Guenther FH, Ghosh SS. Diffusion imaging of cerebral white matter in persons who stutter: evidence for network-level anomalies. Front Hum Neurosci 2014;8:54. [DOI] [PMC free article] [PubMed] [Google Scholar]
- 38.Croot K, Ballard K, Leyton CE, Hodges JR. Apraxia of speech and phonological errors in the diagnosis of nonfluent/agrammatic and logopenic variants of primary progressive aphasia. J Speech Lang Hear Res 2012;55:S1562–S1572. [DOI] [PubMed] [Google Scholar]
- 39.Utianski RL, Duffy JR, Clark HM, et al. Prosodic and phonetic subtypes of primary progressive apraxia of speech. Brain Lang 2018;184:54–65. [DOI] [PMC free article] [PubMed] [Google Scholar]
- 40.Yunusova Y, Graham NL, Shellikeri S, et al. Profiling speech and pausing in amyotrophic lateral sclerosis (ALS) and frontotemporal dementia (FTD). PLoS One 2016;11:e0147573. [DOI] [PMC free article] [PubMed] [Google Scholar]
- 41.Smith KM, Caplan DN. Communication impairment in Parkinson's disease: impact of motor and cognitive symptoms on speech and language. Brain Lang 2018;185:38–46. [DOI] [PubMed] [Google Scholar]
- 42.Fraser KC, Meltzer JA, Rudzicz F. Linguistic features identify Alzheimer's disease in narrative speech. J Alzheimers Dis 2016;49:407–422. [DOI] [PubMed] [Google Scholar]
- 43.Whitwell JL, Weigand D, Duffy R, et al. Predicting clinical decline in progressive agrammatic aphasia and apraxia of speech. Neurology 2017;89:2271–2279. [DOI] [PMC free article] [PubMed] [Google Scholar]
- 44.Basilakos A, Rorden C, Bonilha L, Moser D, Fridriksson J. Patterns of poststroke brain damage that predict speech production errors in apraxia of speech and aphasia dissociate. Stroke 2015;46:1561–1566. [DOI] [PMC free article] [PubMed] [Google Scholar]
- 45.Whitwell JL, Duffy JR, Strand EA, et al. Distinct regional anatomic and functional correlates of neurodegenerative apraxia of speech and aphasia: an MRI and FDG-PET study. Brain Lang 2013;125:245–252. [DOI] [PMC free article] [PubMed] [Google Scholar]
- 46.Rohrer JD, Rossor MN, Warren JD. Apraxia in progressive nonfluent aphasia. J Neurol 2010;257:569–574. [DOI] [PMC free article] [PubMed] [Google Scholar]
- 47.Ogar JM, Dronkers NF, Brambati SM, Miller BL, Gorno-Tempini ML. Progressive nonfluent aphasia and its characteristic motor speech deficits. Alzheimer Dis Assoc Disord 2007;21:S23. [DOI] [PubMed] [Google Scholar]
- 48.Whitwell JL, Duffy JR, Machulda MM, et al. Tracking the development of agrammatic aphasia: a tensor-based morphometry study. Cortex J Devoted Study Nerv Syst Behav 2017;90:138–148. [DOI] [PMC free article] [PubMed] [Google Scholar]
- 49.Hickok G. Computational neuroanatomy of speech production. Nat Rev Neurosci 2012;13:135–145. [DOI] [PMC free article] [PubMed] [Google Scholar]
- 50.Skipper JI, Devlin JT, Lametti DR. The hearing ear is always found close to the speaking tongue: review of the role of the motor system in speech perception. Brain Lang 2017;164:77–105. [DOI] [PubMed] [Google Scholar]
Associated Data
This section collects any data citations, data availability statements, or supplementary materials included in this article.
Data Availability Statement
Anonymized data will be shared by request from any qualified investigator.


