

Abstract
Objective
To assess brain morphometry in a sample of patients with juvenile-onset Huntington disease (JOHD) and several mouse models of Huntington disease (HD) that likely represent the human JOHD phenotype.
Methods
Despite sharing the mutation in the Huntingtin gene, adult-onset HD characteristically presents as a hyperkinetic motor disorder, while JOHD typically presents as a hypokinetic motor disease. The University of Iowa Kids-JHD program enrolls individuals 5 to 25 years of age who have already received the clinical diagnosis. A total of 19 children with juvenile HD (JHD) (mean CAG = 72) were studied. Patients with JHD were compared to healthy controls (n = 234) using a cross-sectional study design. Volumetric data from structural MRI was compared between groups. In addition, we used the same procedure to evaluate brain morphology of R6/2, zQ175, HdhQ250 HD mice models.
Results
Participants with JHD had substantially reduced intracranial volumes. After controlling for the small intracranial volume size, the volumes of subcortical regions (caudate, putamen, globus pallidus, and thalamus) and of cortical white matter were significantly decreased in patients with JHD. However, the cerebellum was proportionately enlarged in the JHD sample. The cerebral cortex was largely unaffected. Likewise, HD mice had a lower volume of striatum and a higher volume of cerebellum, mirroring the human MRI results.
Conclusions
The primary pathology of JOHD extends beyond changes in the striatal volume. Brain morphology in both mice and human patients with JHD shows proportional cerebellar enlargement. This pattern of brain changes may explain the unique picture of hypokinetic motor symptoms in JHD, which is not seen in the hyperkinetic chorea-like phenotype of adult-onset HD.
Huntington disease (HD) is caused by the cytosine-adenine-guanine (CAG) trinucleotide repeat expansion in the huntingtin gene (HTT). Most patients with HD develop symptoms during adulthood, which is thus termed adult-onset HD (AOHD).1 When the disease onset occurs before the age of 20 years, the disorder is referred to as juvenile-onset HD (JOHD).2 Clinically, a triad of psychiatric, cognitive, and motor symptoms characterizes HD. Psychiatric and cognitive symptoms do not significantly differ between JOHD and AOHD.3–5 Yet, the JOHD motor phenotype often manifests with parkinsonian features, such as bradykinesia, rigidity, and tremors.3,6,7 In stark contrast to chorea of AOHD, JOHD motor symptoms are predominantly hypokinetic. The brain changes that drive this dramatic difference of motor symptoms within the spectrum of HD are unknown.
Because patients with JOHD make up only approximately 5% of HD cases in the United States, comprehensive neuroimaging data are lacking for JOHD.8 Even though JOHD presentation is rare, we report a comprehensive assessment of brain structure in patients with JOHD. Further study is needed to establish whether more extensive striatal damage alone is responsible for the unique hypokinetic JOHD motor phenotype or whether another region beyond striatum, such as cerebellum, contributes to JOHD pathophysiology.
The primary objective was to assess brain morphometry in a sample of participants with JOHD (age range 5–25 years) compared to a large sample of typically developing healthy controls, evaluating volumes of brain regions and cortical structure. In addition, we evaluated brain morphology using MRI in several mouse models of HD, given that they likely represent the human JOHD phenotype.
Methods
Participants
The Kids-JHD study at the University of Iowa is associated with our Huntington's Disease Society of America Center of Excellence and a larger program (Kids-HD), which is a study of children at risk of HD. The current sample was composed of children with JOHD and healthy controls. Recruitment is from our Center of Excellence and in association with both local and national Huntington's Disease Society of America events. Because of the rarity of JOHD, families were recruited from all over the United States, but completed the entire study at the University of Iowa Hospitals and Clinics. Before enrolling in the study, children in our JOHD group had to receive (1) a clinical diagnosis of JOHD from their neurologist with documented motor symptoms prior to the age of 20 years and (2) a confirmatory molecular laboratory report showing an expanded HTT gene allele from the genomic DNA analysis.
We compared the JOHD cohort to a sample of children in our healthy control group, who belonged to 2 different subgroups. First, we recruited a local sample of 144 children with no family history of HD. Exclusion criteria for this subgroup was a history of major medical, neurologic, or psychiatric illness or significant head trauma. This group was enrolled in the study to represent a typical trajectory of normal, healthy brain development. The second subgroup was children from the Kids-HD study. It consists of 90 at-risk children with a family history of HD, who did not inherit the expanded HTT gene (CAG repeat range: 11–34). The genetic testing of participants at risk of HD is performed for research-only purposes and the outcome is never disclosed to the child or their family as well as the research team. There were no exclusion criteria for major medical or psychiatric disease in this subgroup. Both healthy controls from the at-risk group and the JOHD group often face a challenging home environment as they both have a parent with HD, but the second healthy control subgroup has a normal HTT gene length and was included to represent a diversity of typical brain development without JOHD. Likewise to the JOHD group, the at-risk children were recruited and arrived from various different geographic areas within the United States. Together, these 2 subgroups compose a large normative data set representing a large age range (5–25 years) with geographical diversity. Despite the geographical diversity, the racial composition of both the control sample and the JOHD sample was largely Caucasian (88% for the healthy control sample and 62% for the JOHD sample).
Standard protocol approvals, registrations, and patient consents
The University of Iowa institutional review board approved the study. For participants younger than 18 years, parents or guardians provided written consent and children provided written assent. For participants who were 18 years or older, participants provided written consent. The Diagnostic Molecular Pathology laboratory at the University of Iowa performed gene expansion testing via PCR analysis on blood or saliva samples from all non-JOHD participants.
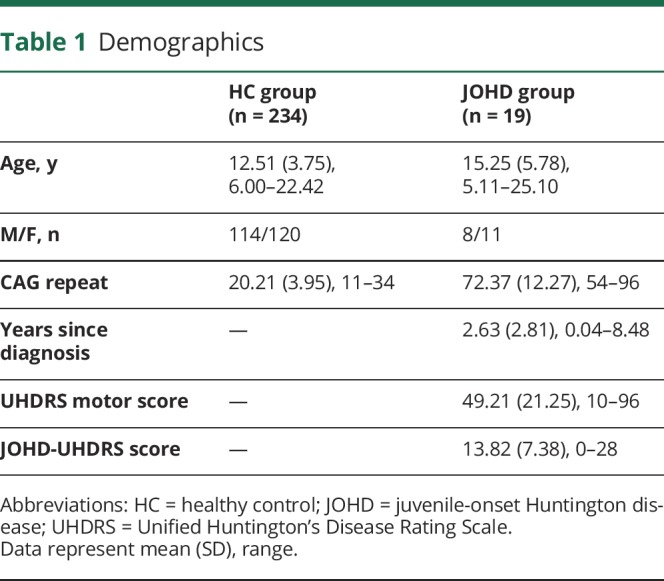
Table 1 displays a summary of basic demographic participant information and CAG data. The JOHD sample was composed of 19 patients (8 male, 11 female) ranging in age from 5.11 to 25.10 (mean age 15.25, SD 5.78). CAG repeat length ranged from 54 to 96 (mean 72.37, SD 12.27). Participants with JOHD were assessed soon after their clinical diagnosis with the range of years since diagnosis being 0.04 to 8.48 (mean = 2.63, SD 2.81). As is common with AOHD, many patients had cognitive and/or behavioral symptoms prior to the onset of motor symptoms; however, the onset of disease is defined here as presence of significant motor symptomatology.
Table 1.
Demographics
Motor assessment was obtained using the Unified Huntington's Disease Rating Scale (UHDRS), a standardized examination performed by a trained examiner.9 UHDRS is a core clinical assessment in HD. The higher scores on UHDRS-related measures indicate increasing degree of motor function impairment. Because of the difference in the presentation of motor symptoms between JOHD and AOHD, UHDRS does not explicitly assess the extent of bradykinesia. Therefore, we added additional questions that target hypokinesia in JOHD, adapted from European Huntington's Disease Network Working Group on JOHD.10 The JOHD subscale includes the following: (1) a quantification of “global chorea”; (2) 2 bradykinesia questions on timing of hand tapping and water drinking, and (3) maximal tremor levels in all extremities. To derive the JOHD bradykinesia (JOHD-UHDRS) score, we summed up the 2 bradykinesia items and the maximal tremor items from JOHD add-on questions with UHDRS questions that assess hypokinesia (question 9a and 9b [rigidity—arms] and question 10 [bradykinesia—body]). In addition, a pediatric neurologist with JOHD expertise assessed the patient to verify the presence of HD symptoms during motor examination and to address parents' concerns.
Human image acquisition and analysis
All of the scanning was performed without sedation. The majority of the MRI scans were acquired on a research-dedicated 3T Siemens TIM Trio scanner (Siemens Medical Solutions, Malvern, PA). MRI data for 6 healthy controls and 5 participants with JOHD were acquired on the newer 3T GE Discovery scanner (GE Healthcare, Waukesha, WI). An internal quality-control study was conducted by the Iowa Institute for Biomedical Imaging to ensure that the same sequences were collected on both scanners. Our post hoc analysis conducted on the healthy control group did not detect a scanner effect for any of the variables of interest from structural MRI (caudate, putamen, and cerebellum volumes). Scanner type was entered as a potential covariate in all applicable statistical analyses. To obtain the highest-quality scans with as little motion artifact as possible, a PROMO (prospective motion correction) sequence was used to prospectively correct motion artifacts.11 In addition, the scans were reviewed by a skilled MRI technician while the participant was in the scanner. If too much motion was present, the sequence was repeated. An experienced image processing assistant visually inspects all scans once they are transferred off the MRI machine, and scans are flagged and removed if there is too much artifact.
Our imaging protocol consisted of T1- and T2-weighted sequences. Anatomical images were analyzed with an automated pipeline from BRAINS2 software.12 It automatically performs anterior commissure–posterior commissure alignment, T1/T2 image coregistration, and standardization of image intensity. Finally, a neural network computation was used to classify tissue as gray matter, white matter, or CSF and to subsequently label brain structures, automatically deriving their volumes. A trained engineer checked automated results for validity. Reported brain volumes represent the sum of gray and white matter for the neural network of a region. All regional brain measures are reported as proportional volumes to the total brain volume as measured by the intracranial volume (ICV). Brain measures included ICV, cerebrum, subcortical structures, and cerebellum. Subcortical regions of interest consisted of caudate, putamen, globus pallidus and thalamus. Cerebellum was further subdivided into anterior lobe (lobules I, II, III, IV, and V), superior division of posterior lobe (lobules VI and crus I of VIIA), and inferior posterior lobe (crus II of VIIA, lobules VIIB, VIII, IX, and X).
In addition to BRAINS2 analysis that provided volumetric data, we also used FreeSurfer version 6 to perform cortical thickness analysis (available online).13 To visualize the results, we used Qdec software. The analysis included sex and age covariates. The produced color map includes all vertices with p < 0.05.
Mice image acquisition and analysis
The scans were acquired on a small-animal 9.4T Bruker BioSpin MRI scanner (Bruker, Billerica, MA) at the Johns Hopkins University. The time point for evaluation was chosen based on the first emergence of motor symptoms in mice. For the R6/2 strain, 8 transgenic HD mice and 7 healthy control mice (all male) were evaluated at postnatal day 42. CAG repeat size ranged between 103 and 112. For the zQ175 strain, 10 knock-in HD homozygous mice and 10 healthy control mice (5 males, 5 females in each group) were evaluated at 6 months of age. CAG repeat length ranged between 168 and 184. For the HdhQ250 strain, 10 knock-in HD heterozygous mice and 10 healthy control mice (5 males, 5 females in the HD group and 6 males, 4 females in the healthy control group) were evaluated at 6 months of age. CAG repeat length ranged between 243 and 257. Detailed description of image analysis can be found in previously published reports.14–16 To match standard human neuroimaging analysis of the developing patient population, all analyses reported proportional volumes of the region of interest to total brain volume.
Statistical analysis
Statistical analysis was performed with R, version 3.3.3,17 and SAS software (SAS Institute, Cary, NC). We examined 9 human brain volumes: ICV; cerebral total, white, and cortex; caudate, putamen, globus pallidus, and thalamus; and cerebellum, as well as 3 subregions of the cerebellum: anterior, inferior posterior, and superior posterior lobes. In addition, we evaluated 2 mouse brain measures: striatum and cerebellum volumes. Means, standard deviations, minima, and maxima were calculated for numerical variables. To compare the JOHD cohort and healthy controls, the Pearson 2-sample test for equality of proportions with continuity correction was used for categorical variables and the Welch 2-sample t test was used for continuous variables. For consistency, we z-scored all imaging variables, including brain volumes from structural MRI for both human and mice experiments. All brain measures were analyzed with analysis of covariance performed via a linear model, controlling for age, sex, and scanner.
Linear regression was used to evaluate the relationships between brain structure (volumes) and clinical variables (CAG repeat length, duration of disease, UHDRS score, and JOHD-UHDRS hypokinesia score). To reduce the probability of a type I error, the number of comparisons was reduced to include only the brain measures that showed significant group differences. Age, sex, and scanner were entered as covariates. An α level of 0.05 was used as a threshold for testing significance of the main effects. Given the exploratory nature of our analysis, we did not correct for multiple comparisons.
Data availability
Raw imaging files and statistical output are not included in this report because of space limitations. Deidentified data will be shared by request from any qualified investigator by the corresponding author for purposes of replicating procedures and results.
Results
Brain structure
The first primary measure of ICV was found to be substantially smaller than controls, indicating a global decrement in overall brain growth. Therefore, we analyzed both raw values as well as proportional volumes of the region of interest to ICV (table 2). Because the ICV was smaller, all regions of the brain were substantially smaller in participants with JOHD compared to controls. The exception to this was the cerebellum, which, in raw values, was not different than controls. When proportional measures were evaluated, several measures were no longer smaller than in controls and were therefore proportionately normal—this included the total cerebral volume and the cerebral cortex volume. However, for cerebral white matter and all of the subcortical structures, even the proportional measures showed smaller volumes in the JOHD group. This was especially striking in the caudate and putamen. While the cerebellum was no different than controls in raw volume, when normalized to the smaller ICV, cerebellum volume in the children with JOHD was larger than in controls, indicating a proportional enlargement.
Table 2.
Structural MRI brain measures

Next, we investigated whether cerebellar enlargement seen in patients with JOHD is global or localized to a certain cerebellar lobe (table 2). Raw values for all 3 regions were not different than controls. After normalizing for the smaller ICV, all 3 cerebellar lobes had higher mean volumes in the JOHD sample; however, the difference in total cerebellar volume was driven by the increase in anterior cerebellar volume. Both inferior division and superior division of posterior cerebellar lobe did not differ between JOHD and healthy control groups.
Finally, we wanted to examine the relationships between brain structure and clinical variables within the JOHD group using linear regression (table 3). It is of interest that CAG repeat length was predictive only of white matter volume and thalamic volume with higher repeats predicting lower volumes. Longer disease duration predicted lower volumes of all subcortical structures and cerebral white matter, but not ICV or cerebellar volume. UHDRS ratings were highly predictive of subcortical volumes with putamen and caudate having the strongest relationship. Finally, the JOHD-UHDRS bradykinesia score had similar findings with lower volumes of caudate and putamen being associated with higher scores, while the globus was also significant, but the thalamus not predictive. The volume of the cerebellum was not predictive of any clinical measure.
Table 3.
Structure-function relationships

Cortical thickness
To follow-up our volumetric examination of brain changes in JOHD, we performed a cortical thickness analysis using FreeSurfer output via Qdec visualization. Mirroring our BRAINS2 structural imaging results, no main effect of group was observed for cortical gray matter thickness, although some regional differences between groups were found. In patients with JOHD, local gray matter increases were detected in temporal and occipital thickness, while local decreases were found in frontal and parietal lobes as well as insula and cingulate cortex (figure 1).
Figure 1. Cortical thickness changes observed in the juvenile-onset Huntington disease group do not involve motor cortex.
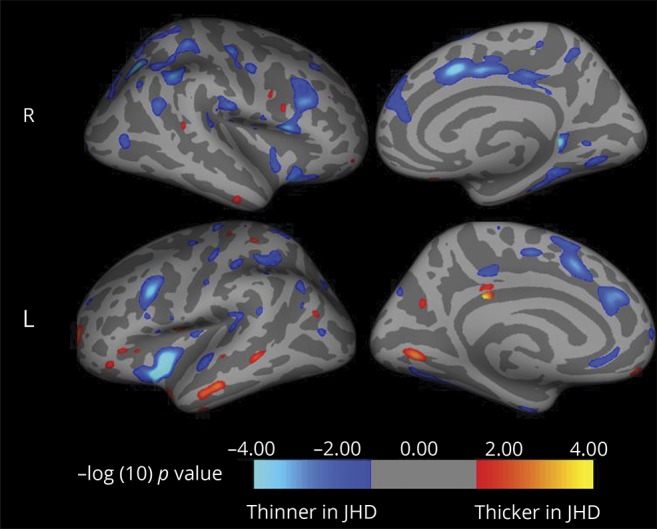
JHD = juvenile Huntington disease.
Animal models
In our final level of analysis, we wanted to replicate our human neuroimaging results in several HD mice models with highly expanded CAG repeats. Prior publications on these datasets reported raw volume without correcting for ICV or total brain volume.14–16 All present analyses are normalized for total brain volume to closely follow the steps of our human brain analysis (figure 2). In the R6/2 model, striatum had lower volume in HD mice post day 42, and cerebellum had higher volume, but that difference was not significant. In the zQ175 model, striatum was drastically smaller in HD mice, yet cerebellum was also significantly larger. Finally, for HdhQ250 mice, cerebellum was again enlarged since the age of 6 months in addition to a striatal volume decrease. Thus, we show that in several well-described mouse models of HD that besides known striatal deficits, we also observed cerebellar enlargement.
Figure 2. Cerebellar enlargement and striatal degeneration is present in (A) R6/2, (B) zQ175, and (C) HdhQ250 mouse models.

Cerebellar changes are significant in 2 of 3 models. Significance: ***<0.001, **<0.01, *<0.05.
Discussion
In this article, we identify a series of brain changes in patients with JOHD. In contrast to the subcortical structures being dramatically reduced in volume, the cerebellum is proportionately enlarged. This pattern of brain morphology in human participants with JOHD was replicated in 3 separate mouse models of HD. The majority of well-characterized HD murine models carry a large enough CAG repeat that would cause JOHD in humans. The first transgenic mouse model of HD, R6/2, was generated by introducing an expanded CAG repeat from a patient with JOHD into the mice genome.18 While some variability between the age of HD onset and CAG repeat size exists, expansions over 100 CAG repeats in the HTT gene almost invariably result in JOHD. Consequently, many mice models, such as R6/2, exhibit bradykinesia, tremors, and seizures that mirror clinical symptoms seen in human patients with JOHD.19 Given that the mouse models used in HD have high CAG repeats and some phenotypic features consistent with human JOHD, the similarity of the patterns seems appropriate.
Does a proportionally large cerebellum reflect true enlargement or simply a sparing of degeneration? In this study, the raw volumes of the cerebellum are no different than controls. However, the ICV is much smaller in JOHD, so the raw values of all brain regions are smaller in the JOHD sample. Therefore, in order to evaluate whether regional volumes are different from controls, there needs to be normalization of the regional measures. When the cerebellum volumes of the JOHD sample are normalized to ICV, they are proportionally larger compared to controls. Since ICV is a proxy of maximal brain growth (and is a measure that does not change with degeneration), normalization to ICV suggests a relationship that reflects a developmental process.
The current analysis of the mouse imaging data is a reanalysis of the previously published data using only raw volumes.14–16 As ICV was not available in the mouse imaging, the cerebellum volumes were normalized by total brain volume. When the human data were recalculated using total brain volume rather than ICV, the results remained the same as when ICV was used, and mirror the mice data with cerebellum volumes that are larger than controls after normalization (e-Table, links.lww.com/WNL/A893). To determine whether the cerebellum is truly enlarged or instead simply spared from degeneration, longitudinal analysis over disease progression in this population is needed. The patients from the current sample are mostly very early in the disease process. Future studies will need to focus on disease course in JOHD.
In the context of human AOHD studies, loss of striatal volume and deterioration of surrounding white matter are detectable by neuroimaging up to 20 years before the disease onset, while the cerebellum is unchanged and described as being spared.20 Some evidence to support the notion that the cerebellum is spared from the disease process comes from the somatic instability literature. The striatum has extraordinarily high somatic instability, which means that over time, the CAG repeat lengths within striatal neurons become longer and longer, possibly driving symptom onset and progression. However, CAG repeats within HTT are exceedingly stable in the cerebellum.21,22
What role the cerebellum has in JOHD is still unclear, however. Emerging neuroanatomical work by Bostan and Strick identified that bidirectional connections exist between basal ganglia and the cerebellum.23–26 Disynaptic projections exist between the cerebellum and striatum. The dentate nucleus of cerebellum is connected to dorsocaudal putamen via the ventrolateral thalamus. A returning projection connects the output of basal ganglia, the subthalamic nucleus, to the motor division of anterior cerebellar lobe via pontine nuclei. This circuitry with the striatum is integrated into the indirect pathway, which serves, in general, to inhibit movement. Those studies establish the existence of an integrated motor circuit between the striatum and cerebellum. In addition, our group has previously published regarding the effect of CAG repeat in HTT's effect on normal brain development.27 In children with CAG repeats below disease threshold (<35), the greater the number of CAG repeats is predictive of smaller putamen and larger cerebellum volumes (this effect was particularly strong in males). This suggests that HTT acts on brain development to sculpt an optimal striatal-cerebellar circuit. When the CAG repeat lengths become too long, this relationship may become pathologic with abnormally small volumes of the striatum being compensated for by increasingly larger cerebellum volumes. Given that an abnormal striatum in HD leads to hyperkinesis, an enlarged cerebellum could potentially compensate for this by driving the indirect pathway through its connection through the striatum, inhibiting excessive movements.
Whether an enlarged cerebellum is compensatory or pathologic in JOHD is also unclear. One possibility would be that the cerebellum in JOHD is developmentally enlarged to compensate for the abnormally small striatum and that this enlargement actually becomes pathologic, driving the indirect pathway to hypokinesis. The clinical correlation analysis from the current study does not support this, as there was no relationship found between cerebellum volume and the motor scores. Another possibility would be that the cerebellum is trying to compensate for motor dysfunction but is overwhelmed by the severity of the striatal dysfunction. Connectivity analysis looking at strengths of pathways between the cerebellum and the striatum could help to determine the role of the cerebellum. In fact, a recent study looking at PET imaging in AOHD found that the cerebellum seemed to be playing both pathologic and compensatory roles at the same time.28
In contrast to our findings, several smaller case studies of patients with JOHD reported smaller cerebellar volumes.29–31 These studies are limited by their smaller sample size and confounded by the presence of epilepsy in the majority of their patients. Only 20% of patients in our JHD cohort had a history of seizures. It is well known that the cerebellum is exquisitely sensitive to prolonged hypoxic episodes that are likely to occur during severe seizures.32,33 A wider access to antiepileptic drugs that prevent hypoxic episodes in the JOHD population may explain why we did not observe this finding. In addition, patients in our study were examined early in the disease course, before seizures could produce extensive cerebellar damage. A recent study reported cerebellar atrophy in patients with childhood-onset HD.34 It is possible that the cerebellum manifests different changes with earlier ages of disease onset. Only 2 of 19 patients with JHD in our sample were younger than 6 years, which is the range that the report used.
Although conceptualized primarily as a disease of the striatum, it is clear from both imaging and pathologic studies that, eventually, most of the brain is involved in HD.35–37 In AOHD, both cerebral white matter and cerebral cortex are found to be abnormal, even in the prodromal phase of the disease with cortical thinning proceeding from posterior to anterior nearer to disease onset and including the motor strip.38 In the current study, despite the fact that these patients were quite ill, their cerebrum, as a whole, was proportionately normal in volume. Although cerebral white matter was low, total volume of their cortex was not significantly different than controls. The cortical thickness maps showed relatively minor areas of thinning in the insula with normal morphology of the motor strip. This is in contrast to AOHD and is supportive of a recent article reporting that in both MRI and postmortem examination of 5 cases of childhood-onset HD (CAG repeats >80 and onset before age 10), there was selective and severe degeneration of the striatum with sparing of the cerebral white matter and cortex.39
In JOHD, the issue of having a degenerative brain disease in the context of brain development complicates understanding the role of both processes. Clearly, there is a global abnormality in brain growth; however, ICV was not at all predictive of the motor symptoms. Indeed, the volume of caudate and putamen were the strongest predictors of motor symptoms, and although these volumes did appear to decrease with increasing duration of disease, there is also evidence that the striatum was developmentally abnormal to begin with. In our sample of 19 patients, the range of disease duration was 0.04 to 8.47 years. In a post hoc analysis, we limited the sample to those participants whose disease duration was less than 1 year. In fact, this group of 8 had a mean disease duration of 0.45 years. In the sample of 8 participants with JOHD with a mean duration of 0.45 years, the volume of their putamen was still only 50% of that of the normal healthy controls. This is supportive of the notion that there was developmental aberration of the striatum potentially prior to the onset of their disease. The concept of aberrant brain development as a vital and primary component of HD pathology is a theory with growing support in AOHD.1 Identifying subjects prior to the onset of JOHD will be required to fully understand the role of abnormal development in JOHD.
There are several limitations to our work. First, the rarity of JOHD limited the number of participants that we were able to recruit in the study. Validation of our results in a larger, independent cohort may identify more subtle changes in JOHD neuropathology. Second, our brain structure–clinical function outcomes did not reach significance for any of the cerebellar regions of interest. Enrolling more patients in another study with the aim to increase statistical power may validate our cerebellar findings in JOHD. Third, because of the ethical concerns of studying an incurable genetic disorder in a vulnerable pediatric population, we limited our recruitment only to patients that had a JOHD diagnosis from their neurologist. Because of the challenge of assigning the JOHD diagnosis, some patients experienced a diagnostic odyssey, which resulted in inclusion of patients with JOHD who had a long duration of symptoms in our study. Characterizing any presymptomatic changes would further our understanding of JOHD and likely AOHD.
Given the provided evidence, further studies should examine the role of cerebellum across the spectrum of HD, including in AOHD. As JOHD shares many similarities with AOHD across cognitive and psychiatric symptoms, we focused our study design only on the motor symptoms of JOHD. Previous work established that cerebellum contributes to nonmotor functions of the brain and may be responsible in part for some of the cognitive and psychiatric features of HD. Many novel gene therapies for HD are currently in development. Fully understanding how cerebellum influences not only JOHD pathology, but also a larger population of patients with AOHD will ensure the long-term success of those new treatments.
Glossary
- AOHD
adult-onset Huntington disease
- HD
Huntington disease
- ICV
intracranial volume
- JHD
juvenile Huntington disease
- JOHD
juvenile-onset Huntington disease
- UHDRS
Unified Huntington's Disease Rating Scale
Appendix. Authors
Footnotes
Editorial, page 779
Study funding
Study funded by NINDS (5R01NS055903 to Peg Nopoulos).
Disclosure
The authors report no disclosures relevant to the manuscript. Go to Neurology.org/N for full disclosures.
Author contributions
All authors contributed to the interpretation of results, reviewed and critically revised the manuscript, and approved the final version for submission.
References
- 1.Nopoulos PC. Huntington disease: a single-gene degenerative disorder of the striatum. Dialogues Clin Neurosci 2016;18:91–98. [DOI] [PMC free article] [PubMed] [Google Scholar]
- 2.Nance M, Myers RH. Juvenile onset Huntington's disease: clinical and research perspectives. Ment Retard Dev Disabil Res Rev 2001;7:153–157. [DOI] [PubMed] [Google Scholar]
- 3.Siesling S, Vegter-van der Vlis M, Roos RA. Juvenile Huntington disease in the Netherlands. Pediatr Neurol 1997;17:37–43. [DOI] [PubMed] [Google Scholar]
- 4.Ribaï P, Nguyen K, Hahn-Barma V, et al. Psychiatric and cognitive difficulties as indicators of juvenile Huntington disease onset in 29 patients. Arch Neurol 2007;64:813–819. [DOI] [PubMed] [Google Scholar]
- 5.Yoon G, Kramer J, Zanko A, et al. Speech and language delay are early manifestations of juvenile-onset Huntington disease. Neurology 2006;67:1265–1267. [DOI] [PubMed] [Google Scholar]
- 6.Gonzalez-Alegre P, Afifi AK. Clinical characteristics of childhood-onset (juvenile) Huntington disease: report of 12 patients and review of the literature. J Child Neurol 2006;21:223–229. [DOI] [PubMed] [Google Scholar]
- 7.van Dijk JG, van der Velde EA, Roos RA, Bruyn GW. Juvenile Huntington disease. Hum Genet 1986;73:235–239. [DOI] [PubMed] [Google Scholar]
- 8.Quarrell O, O'Donovan KL, Bandmann O, Strong M. The prevalence of juvenile Huntington's disease: a review of the literature and meta-analysis. PLoS Curr 2012;4:e4f8606b742ef3. [DOI] [PMC free article] [PubMed] [Google Scholar]
- 9.Kieburtz K. Unified Huntington's Disease Rating Scale: reliability and consistency. Huntington Study Group. Mov Disord 1996;11:136–142. [DOI] [PubMed] [Google Scholar]
- 10.European Huntington’s Disease Network Working Group on Juvenile HD. JHD Motor Assessment. In: Quarrell O, Brewer H, Squitieri F, Baker R, Nance M, Landwehrmeyer GB, editors. Juvenile Huntington's Disease and Other Trinucleotide Repeat Disorders. New York: Oxford University Press; 2009:191–195. [Google Scholar]
- 11.White N, Roddey C, Shankaranarayanan A, et al. PROMO: real-time prospective motion correction in MRI using image-based tracking. Magn Reson Med 2010;63:91–105. [DOI] [PMC free article] [PubMed] [Google Scholar]
- 12.Pierson R, Johnson H, Harris G, et al. Fully automated analysis using BRAINS: AutoWorkup. Neuroimage 2011;54:328–336. [DOI] [PMC free article] [PubMed] [Google Scholar]
- 13.Han X, Jovicich J, Salat D, et al. Reliability of MRI-derived measurements of human cerebral cortical thickness: the effects of field strength, scanner upgrade and manufacturer. Neuroimage 2006;32:180–194. [DOI] [PubMed] [Google Scholar]
- 14.Zhang J, Peng Q, Li Q, et al. Longitudinal characterization of brain atrophy of a Huntington's disease mouse model by automated morphological analyses of magnetic resonance images. Neuroimage 2010;49:2340–2351. [DOI] [PMC free article] [PubMed] [Google Scholar]
- 15.Jin J, Peng Q, Hou Z, et al. Early white matter abnormalities, progressive brain pathology and motor deficits in a novel knock-in mouse model of Huntington's disease. Hum Mol Genet 2015;24:2508–2527. [DOI] [PMC free article] [PubMed] [Google Scholar]
- 16.Peng Q, Wu B, Jiang M, et al. Characterization of behavioral, neuropathological, brain metabolic and key molecular changes in zQ175 knock-in mouse model of Huntington's disease. PLoS One 2016;11:e0148839. [DOI] [PMC free article] [PubMed] [Google Scholar]
- 17.R Core Team. R: a language and environment for statistical computing [online]. Vienna: R Foundation for Statistical Computing; 2017. [Google Scholar]
- 18.Mangiarini L, Sathasivam K, Seller M, et al. Exon 1 of the HD gene with an expanded CAG repeat is sufficient to cause a progressive neurological phenotype in transgenic mice. Cell 1996;87:493–506. [DOI] [PubMed] [Google Scholar]
- 19.Crook ZR, Housman D. Huntington's disease: can mice lead the way to treatment? Neuron 2011;69:423–435. [DOI] [PMC free article] [PubMed] [Google Scholar]
- 20.Paulsen J, Nopoulos P, Aylward E, et al. Striatal and white matter predictors of estimated diagnosis for Huntington's disease. Brain Res Bull 2010;82:201–207. [DOI] [PMC free article] [PubMed] [Google Scholar]
- 21.Mangiarini L, Sathasivam K, Mahal A, Mott R, Seller M, Bates GP. Instability of highly expanded CAG repeats in mice transgenic for the Huntington's disease mutation. Nat Genet 1997;15:197–200. [DOI] [PubMed] [Google Scholar]
- 22.Swami M, Hendricks AE, Gillis T, et al. Somatic expansion of the Huntington's disease CAG repeat in the brain is associated with an earlier age of disease onset. Hum Mol Genet 2009;18:3039–3047. [DOI] [PMC free article] [PubMed] [Google Scholar]
- 23.Middleton FA, Strick PL. Basal ganglia and cerebellar loops: motor and cognitive circuits. Brain Res Brain Res Rev 2000;31:236–250. [DOI] [PubMed] [Google Scholar]
- 24.Bostan AC, Dum RP, Strick PL. The basal ganglia communicate with the cerebellum. Proc Natl Acad Sci USA 2010;107:8452–8456. [DOI] [PMC free article] [PubMed] [Google Scholar]
- 25.Bostan AC, Strick PL. The cerebellum and basal ganglia are interconnected. Neuropsychol Rev 2010;20:261–270. [DOI] [PMC free article] [PubMed] [Google Scholar]
- 26.Bostan AC, Dum RP, Strick PL. Cerebellar networks with the cerebral cortex and basal ganglia. Trends Cogn Sci 2013;17:241–254. [DOI] [PMC free article] [PubMed] [Google Scholar]
- 27.Lee JK, Ding Y, Conrad AL, et al. Sex-specific effects of the Huntington gene on normal neurodevelopment. J Neurosci Res 2017;95:398–408. [DOI] [PMC free article] [PubMed] [Google Scholar]
- 28.Gaura V, Lavisse S, Payoux P, et al. Association between motor symptoms and brain metabolism in early Huntington disease. JAMA Neurol 2017;74:1088–1096. [DOI] [PMC free article] [PubMed] [Google Scholar]
- 29.Nicolas G, Devys D, Goldenberg A, et al. Juvenile Huntington disease in an 18-month-old boy revealed by global developmental delay and reduced cerebellar volume. Am J Med Genet A 2011;155A:815–818. [DOI] [PubMed] [Google Scholar]
- 30.Patra KC, Shirolkar MS. Childhood-onset (juvenile) Huntington's disease: a rare case report. J Pediatr Neurosci 2015;10:276–279. [DOI] [PMC free article] [PubMed] [Google Scholar]
- 31.Latimer CS, Flanagan ME, Cimino PJ, et al. Neuropathological comparison of adult onset and juvenile Huntington's disease with cerebellar atrophy: a report of a father and son. J Huntingtons Dis 2017;6:337–348. [DOI] [PMC free article] [PubMed] [Google Scholar]
- 32.Cervós-Navarro J, Diemer NH. Selective vulnerability in brain hypoxia. Crit Rev Neurobiol 1991;6:149–182. [PubMed] [Google Scholar]
- 33.Sandok EK, O'Brien TJ, Jack CR, So EL. Significance of cerebellar atrophy in intractable temporal lobe epilepsy: a quantitative MRI study. Epilepsia 2000;41:1315–1320. [DOI] [PubMed] [Google Scholar]
- 34.Hedjoudje A, Nicolas G, Goldenberg A, et al. Morphological features in juvenile Huntington disease associated with cerebellar atrophy: magnetic resonance imaging morphometric analysis. Pediatr Radiol 2018;48:1463–1471. [DOI] [PubMed] [Google Scholar]
- 35.de la Monte SM, Vonsattel JP, Richardson EP. Morphometric demonstration of atrophic changes in the cerebral cortex, white matter, and neostriatum in Huntington's disease. J Neuropathol Exp Neurol 1988;47:516–525. [DOI] [PubMed] [Google Scholar]
- 36.Myers RH, Vonsattel JP, Stevens TJ, et al. Clinical and neuropathologic assessment of severity in Huntington's disease. Neurology 1988;38:341–347. [DOI] [PubMed] [Google Scholar]
- 37.Spargo E, Everall IP, Lantos PL. Neuronal loss in the hippocampus in Huntington's disease: a comparison with HIV infection. J Neurol Neurosurg Psychiatry 1993;56:487–491. [DOI] [PMC free article] [PubMed] [Google Scholar]
- 38.Nopoulos P, Aylward E, Ross C, et al. Cerebral cortex structure in prodromal Huntington's disease. Neurobiol Dis 2010;40:544–554. [DOI] [PMC free article] [PubMed] [Google Scholar]
- 39.Fusilli C, Migliore S, Mazza T, et al. Biological and clinical manifestation of juvenile Huntington's disease: a retrospective analysis. Lancet Neurol 2018;17:986–993. [DOI] [PubMed] [Google Scholar]
Associated Data
This section collects any data citations, data availability statements, or supplementary materials included in this article.
Data Availability Statement
Raw imaging files and statistical output are not included in this report because of space limitations. Deidentified data will be shared by request from any qualified investigator by the corresponding author for purposes of replicating procedures and results.