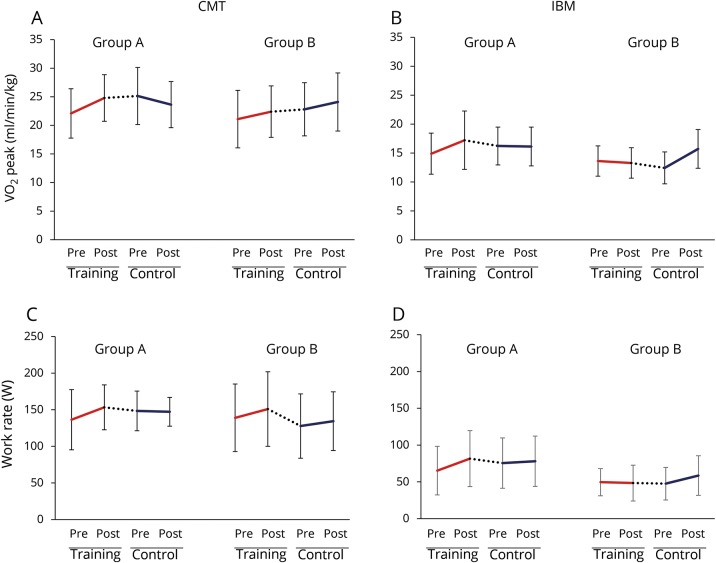
Figure 2. Effect of training and control interventions.
Line graphs of mean VO2 peak (mL/min/kg) for the Charcot-Marie-Tooth disease type 1A (CMT) group (A); VO2 peak for the inclusion body myositis (IBM) group (B); work rate (W) for the CMT group (C); work rate for the IBM group (D). Error bars are SD, solid lines represent change with the 12-week intervention/control periods, dotted lines represent change during the 8-week reversal period at crossover.

