Supplemental Digital Content is available in the text.
Abstract
Background.
Cold ischemia time (CIT) is known to impact kidney graft survival rates. We compare the impact of CIT on graft failure and mortality in circulatory death versus brain death donor kidneys and how it relates to donor age.
Methods.
We used the prospective Dutch Organ Transplantation Registry to include 2153 adult recipients of brain death (n = 1266) and circulatory death (n = 887) donor kidneys after static cold storage from transplants performed between 2005 and 2012. CIT was modeled nonlinearly with splines. Associations and interactions between CIT, donor type, donor age, 5-year (death-censored) graft survival, and mortality were evaluated.
Results.
The median CIT was 16.2 hours (interquartile range 12.8–20), ranging from 3.4 to 44.7 hours for brain death and 4.7 to 46.6 hours for circulatory death donor kidneys. At >12 hours of CIT, we observed an increased risk of graft failure in kidneys donated after circulatory death versus after brain death. This risk rose significantly at >22 hours of CIT (hazard ratio 1.45; 95% confidence interval, 1.01-2.49; P = 0.043). Kidneys that came from 60-year-old circulatory death donors demonstrated elevated hazard risk at 19 hours of CIT, a shorter timeline than that for kidneys that came from brain death donors of the same age (hazard ratio 1.33; 95% confidence interval, 1.00-1.78; P = 0.045). The additional harmful effects of increased CIT in kidneys from circulatory-death donors were also found for death-censored graft failure but did not affect mortality rates in any significant way.
Conclusions.
The findings support the hypothesis that prolonged cold ischemia is more harmful for circulatory death donor kidneys that have already been subjected to a permissible period of warm ischemia. Efforts should be made to reduce CIT, especially for older circulatory death donor kidneys.
Donor shortages have led to increased use of kidneys from donation after circulatory death (DCD).1 In the Netherlands, nearly all such donations are classified as controlled.2 These are patients for whom further treatment is suspected to be futile, with the result that withdrawal of life-sustaining treatment is initiated in the intensive care unit and circulatory arrest is awaited. In contrast to donation after brain death (DBD) kidneys, DCD kidneys suffer from additional warm ischemic injury caused by the lack of blood perfusion of these organs during the agonal phase and after circulatory arrest. Once explanted, donor kidneys are preserved for transport, either by static cold storage on ice or machine perfusion.
Static cold storage lowers the temperature of the graft to 0°C to 4°C with the aim of preventing ischemic reperfusion injury. Prolonged exposure to either warm or cold ischemia depletes adenosine triphosphate levels, leading to a build-up of reactive oxygen species and inflammation and coagulation after reperfusion, which causes renal tubular cell damage and thus increases the risk of graft failure.3-5 However, it remains unclear what impact each extra hour of cold ischemia time (CIT), the time from the cold flushing of the donor organ until the graft is implanted into the recipient, has on graft outcome and whether any impact differs between donor types (ie, DCD vs DBD) and ages.
Summers et al6 found that, in a large UK cohort (2005–2010), prolonged CIT was associated with reduced kidney graft survival in recipients of DCD kidneys and higher donor age was associated with earlier graft failure for both DCD and DBD donor kidneys. However, this study analyzed CIT categorically, leaving the exact point during the CIT window at which the risk of graft failure increases for DCD kidneys undetermined. An animal study found that, after 24 hours of CIT, energy substrates become depleted such that they could not recover at reperfusion, leading to lethal cellular injury.7 However, a recent US retrospective DCD paired kidney analysis (n = 6276), which controlled for all possible donor confounders, did not find an association between CIT and death-censored graft failure.8 These differing findings concerning the impact of CIT make it difficult to formulate any universal guidelines. Determining clear cutoff values for CIT could aid transplant professionals in estimating the quality of a donor kidney and help to safely expand the donor pool.
In this registry-based Dutch cohort study, we (1) analyze the association between CIT and renal graft failure and mortality, (2) investigate whether this association is different for DCD kidneys as compared with DBD kidneys, and (3) explore the hazard ratios (HRs) for each extra hour of CIT in both donor types and relate these findings to donor age.
MATERIALS AND METHODS
Study Population
The Dutch Organ Transplant Registry (NOTR), a nationwide prospective registry maintained by the Dutch Transplant Foundation, records kidney transplant follow-up data from all 8 transplantation centers in the Netherlands, including the date of recipient death after allograft failure. We included recipients (n = 2153) 18 years or older who received a first kidney from a DBD donor or controlled DCD donor9 between January 1, 2005, and January 1, 2012. The final follow-up date was May 1, 2015. Kidneys allocated to overseas patients are preserved by machine perfusion and thus excluded from the analysis. Adult recipients of kidneys from donors aged 10 years and younger were excluded, as were any patients who received donor kidneys either en bloc or as a dual transplant. No donors demonstrated hepatitis C virus positivity. Donor kidneys were acquired through allocation by the Eurotransplant Senior Program (ESP), which is based on Leiden, the Netherlands.9 Detailed descriptions of DBD and DCD donor procedures and recipient immunosuppression regimens are included in the supplemental section of this article (Figure S1A and B, SDC, http://links.lww.com/TXD/A202). Research studies based on the NOTR fall under transplant assessment activity and therefore do not require institutional review board approval. Additionally, all data were anonymized by the Dutch Transplant Foundation. The study was conducted in accordance with Dutch law as is consistent with the Principles of the Declaration of Istanbul as outlined in the “Declaration of Istanbul on Organ Trafficking and Transplant Tourism.”
Outcome Measures
We evaluated 5-year graft survival rates (defined as patient death or graft loss leading to dialysis treatment, whichever comes first) and death-censored graft survival. In addition, to analyze patient survival, we included the date of death for patients who experienced graft loss.
Data Analyses
Continuous variables are presented as median ± interquartile range (IQR). Continuous variables across the DBD and DCD were compared using independent t-tests (or nonparametric Mann-Whitney U tests if appropriate) and 2-tailed Fisher exact statistics for categorical variables. Cumulative incidence competing risk functions were used to calculate unadjusted incidences of 5-year graft survival and take into account the competing events of patient death and graft loss.10 Kaplan-Meier curves were used to estimate patient survival, and cause-specific Cox regression analyses were conducted to take into account possible confounders in the association between CIT and graft failure, death-censored graft failure, and mortality. For these 3 outcomes, the hazards were proportional over time; this was tested by defining the 2 donor types as a function of the time variable, which was divided into 2 equal periods (first 2.5-y vs last 2.5-y follow-up). For the restricted cubic spline analysis, 4 knots were considered based on the Akaike information criterion;11 the knots were placed at 12, 16, 20, and 24 hours of CIT based on expert opinions and sufficient sample size at the knots for both DBD and DCD. Wald tests were used to describe the association of CIT with outcome and by testing for linearity. Depending on test of linearity, the presence of interaction of CIT and donor type was evaluated by adding an interaction term with or without 4-knot restricted splines, and Wald tests were used to estimate the joint association of the interactions. The following were considered as potential confounders: (a) donor gender, (b) donor hypertension (treated) (no/yes), (c) donor’s terminal creatinine (mg/dL), (d) donor’s use of tobacco (no/yes), (e) use of inotropic drugs before donation (no/yes), (f) donor height, (g) donor weight, (h) donor’s diabetes status, (i) donor’s cause of death, (j) donor age, (k) anastomosis time (min), (l) human leukocyte antigen-A (HLA-A), HLA-B, and HLA-DR mismatch levels, (m) recipient gender, (n) recipient age, (o) recipient’s diabetes status, (p) recipient body mass index, (q) recipient hypertension, (r) recipient’s panel reactive antibodies at the time of transplantation (%), (s) dialysis vintage (y), (t) recipient’s primary renal disease, and (u) donor and recipient listed within the ESP (no/yes). The recipient’s primary renal disease leading to renal failure was categorized as polycystic kidney disease (reference), glomerulonephritis, renal vascular disease, diabetes, chronic renal failure (etiology unknown), pyelonephritis, or other. The kidney donor risk index donor-only version12 was calculated assuming a white population. For models that included only circulatory death donor kidneys, first warm ischemic time (first WIT), defined as the time from circulatory arrest to cold perfusion, was added. Each donor, transplant, and recipient characteristic had <12.4% missing information; missing values were imputed using a multivariate imputation by chained equations algorithm with a predictive mean matching modeling type.13 To take different imputed values into account using appropriate methods, 20 imputed datasets with 30 iterations were each created and the estimates combined.14
The following 4 analyses were performed: a comparison of the association of CIT with outcome between donor types using the DBD donor kidneys as the reference category; an analysis of the association of CIT with outcomes separated (stratified) for DBD and DCD, with 10-hour CIT as the reference value; a comparison of 5-year graft survival rates and CIT for DCD donors aged 30, 45, and 60 years with DBD donors of the same ages; and an analysis of the results of the ESP, through which kidneys from donors 65 years and older are allocated to recipients in the same age range.15 In a first sensitivity analysis, first WIT for DCD was categorized based on a median of 20 minutes, and the results were compared with the corresponding outcomes for DBD. In a second sensitivity analysis, the paired-kidney analysis of Kayler and colleagues8 was replicated for DCD transplants with a CIT difference of at least 1 hour between kidneys. The results are presented as HRs with 95% confidence intervals (CIs). Significance levels were set at the 5% level. Analyses were conducted using R (version 3.3.2)16 with the “rms” package (version 5.1-0) and “mice” package (version 2.30). Figures were plotted using GraphPad Prism (version 7.0).
RESULTS
Baseline Characteristics
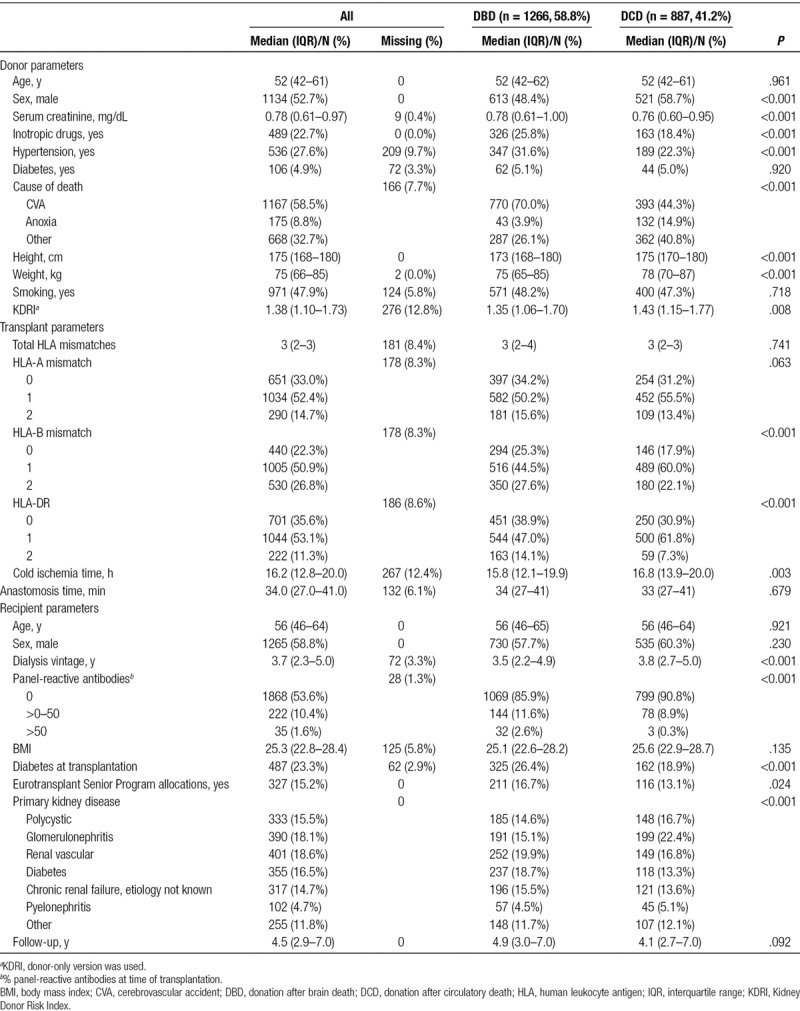
A total of 2153 transplants from 1266 DBD (58.8%) and 887 controlled DCD (41.2%) donors were analyzed (see Figures 1 and 2 and Table 1). A higher percentage of DCD than DBD donors were discarded in the transplantation selection process (29.1% vs 1.7%, respectively; Figure 1). Median kidney donor risk index was 1.38 (IQR 1.10–1.73). Median CIT was 16.2 hours (IQR 12.8–20.0) and lower for DBD (15.8 h IQR 12.1–19.9 vs 16.8 h IQR 13.9–20.0, P = 0.003) than for DCD. For DBD kidneys, CIT ranged from 3.4 hours to a maximum of 44.7 hours. For DCD kidneys, the CIT range was 4.7–46.6 hours (Figure S2, SDC, http://links.lww.com/TXD/A202). DCD donors were more likely to be male (P < .001), less likely to be users of inotropic drugs (P < .001), less likely to suffer from hypertension (P < .001), and had lower final serum creatinine (P < .001) than did DBD donors. In addition, DCD recipients were less frequently immunized (P < .001) and less likely to be diabetic (P < .001). The waiting time for a DCD donor kidney was also longer than that for a DBD kidney (P < .001). Recipients from the ESP program were more likely to receive a DBD donor kidney than a DCD donor kidney (P = 0.024).
FIGURE 1.
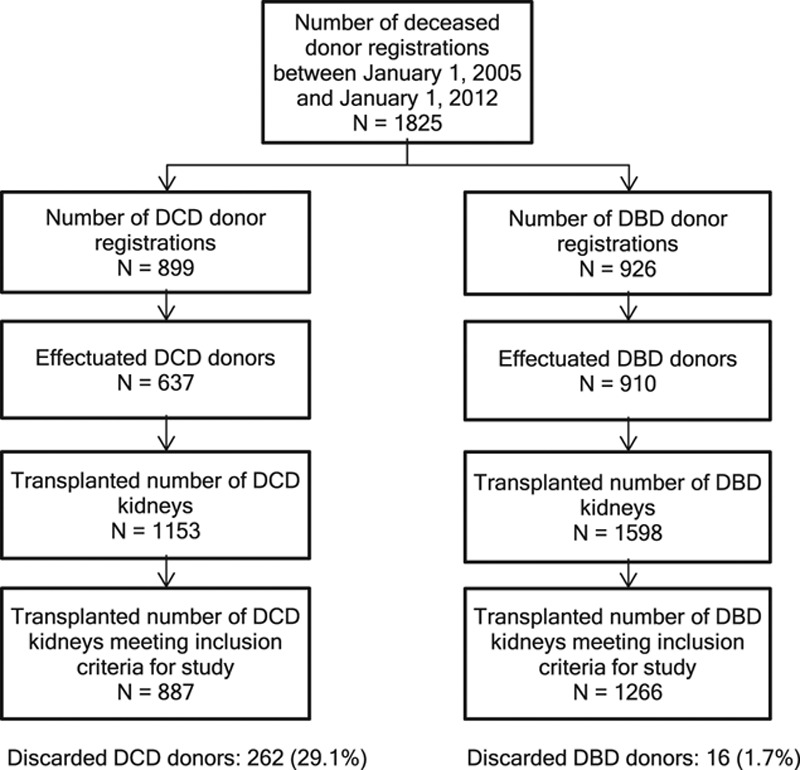
Flow diagram, with inclusion and exclusion criteria and patient counts. DBD, donation after brain death; DCD, donation after circulatory death.
FIGURE 2.
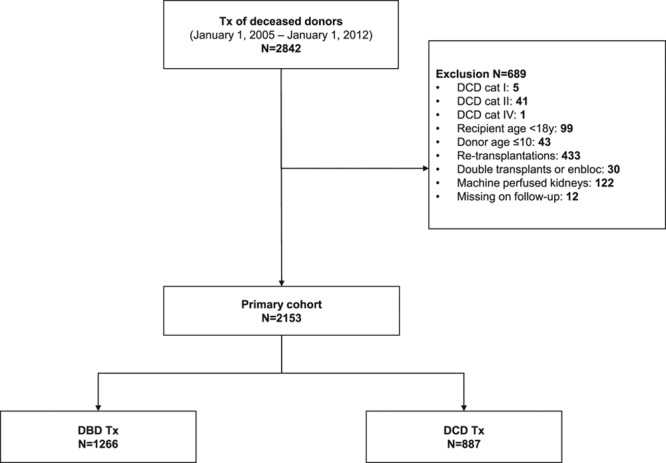
Number of DCD and DBD donor registrations, effectuated donors for transplantation, and number of transplanted kidneys. More DCD donors are discarded in the selection process for transplantation than DBD donors. We were not able to retrospectively analyze the quality of discarded donor kidneys. DBD, donation after brain death; DCD, donation after circulatory death; Tx, kidney transplantations.
TABLE 1.
Baseline characteristics
Transplant Outcomes of Deceased Donor Types
The proportion of graft failures after 5 years attributable to graft loss and return to dialysis was 10.6% (95% CI, 9.3-12), and 12.2% (95% CI, 10.8-13.7) was attributable to patient death as first event. For DCD kidneys, a higher proportion—12.3% (95% CI, 10.1-14.6)—of graft failures were attributable to graft loss and return to dialysis, compared with 9.5% (95% CI, 7.9-11.2, unadjusted P = 0.046) for DBD kidneys. Patient death as first event did not differ between DCD and DBD (12.8%, 95% CI, 10.5-15.4 vs 11.8%, 95% CI, 10.0-13.8, unadjusted P = 0.593, respectively). Mortality at 5 years, irrespective of graft failure, was 15.2% (95% CI, 13.6-17.0) and did not differ between recipients of DCD and DBD donor kidneys (15.9%, 95% CI, 13.4-18.8 vs 14.8%, 95% CI, 12.8-17.1, unadjusted P = 0.603).
Associations of CIT and DCD Donor Type With Transplant Outcomes
Figure 3 depicts unadjusted 5-year graft survival rates according to donor type and CIT categories, including the proportion of graft failures attributable to graft loss and return to dialysis or to patient death (Figure S3, SDC, http://links.lww.com/TXD/A202 presents cumulative incidences over time). If CIT exceeded 24 hours, the 5-year survival rate with a functioning graft was 58.8% for recipients of DCD kidneys, compared with 72.4% for recipients of DBD kidneys. If CIT did not exceed 18 hours, no differences in graft failures between DCD and DBD donor kidneys were observed.
FIGURE 3.
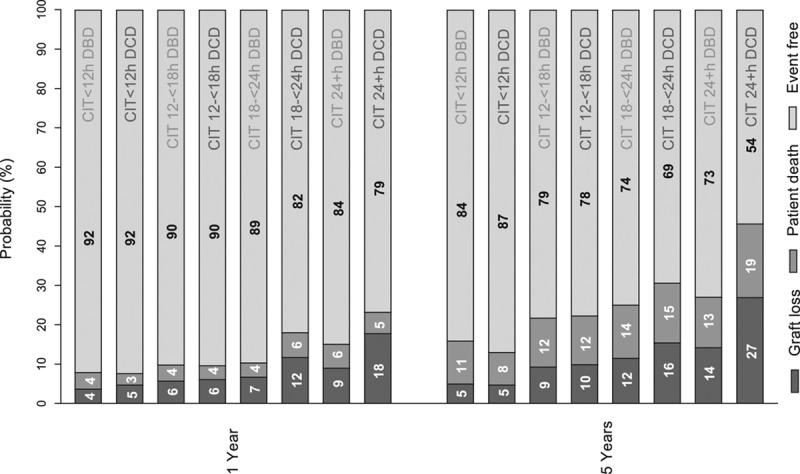
One-year and 5-y graft survival by donor type (brain death and circulatory death donor kidneys) and CIT categories (<12, ≥12<18, ≥18<24, and ≥24 h). Graft events are shown as (1) graft loss and return to dialysis, (2) patient death, or (3) alive, with functioning graft. Results are unadjusted. CIT, cold ischemia time; DBD, donation after brain death; DCD, donation after circulatory death.
Four-knot restricted cubic splines were used to explore cutoff values for CIT for the DCD donor type. Figure 4 illustrates the combined risk of transplanting DCD donor grafts with increasing CIT using DBD grafts as the reference category, which was held constant at an HR of 1 (the corresponding adjusted HRs can be found in Tables 2 and 3). For >12 hours of CIT, DCD kidneys demonstrated an increased hazard for of graft failure at 5 years when compared with DBD kidneys. This risk was significantly higher for DCD compared with DBD donor kidneys at a CIT of 22 hours (adjusted HR 1.46; 95% CI, 1.01-2.09; P = 0.043). For DCD kidneys, an increase in CIT from 10 to 14 hours caused the 5-year risk of graft failure to increase by an adjusted HR of 1.88 (95% CI, 1.01-3.50; P = 0.046; Figure 5). For DBD kidneys, the same increase in CIT led to a 5-year adjusted HR of graft failure of 1.20 (95% CI, 0.89-1.62; P = 0.234).
FIGURE 4.
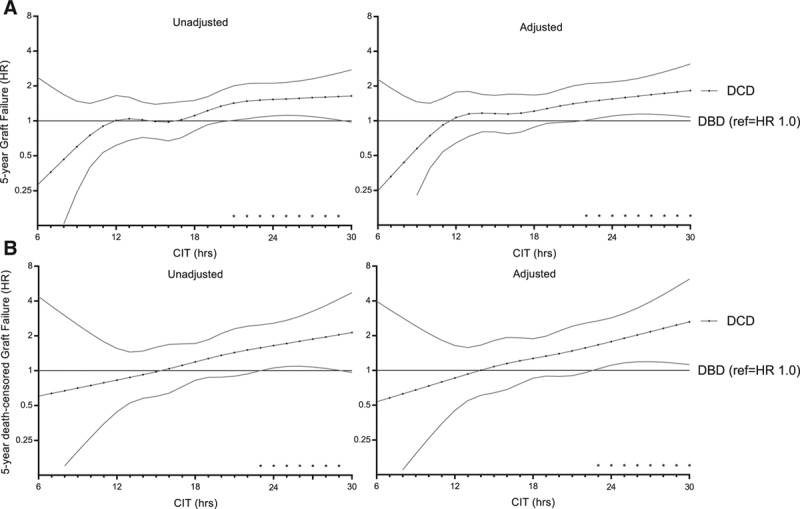
Risk of 5-y graft failure (A) and death-censored graft failure (B) with every h of CIT, comparing DCD with DBD donor kidneys. Donation after brain death is the reference category in the DBD vs DCD comparison, in which HR > 1 indicates higher risk of graft failure for DCD donor kidneys, and HR < 1 indicates higher risk of graft failure for DBD. Cold ischemia time was modeled using a restricted cubic spline with knots at 12, 16, 20, and 24 h. Both unadjusted and adjusted results are shown. Adjusted results correspond to a donor aged 52 y, with last measured creatinine of 0.81 mg/dL, CVA as cause of death, 3 HLA mismatches, height of 175 cm, weight of 75 kg, nonsmoker, no inotropic drugs administered before donation, and no diabetes or hypertension, and a male recipient aged 56 y, with a BMI of 25.4, no recipient diabetes, PRA of 0, a median waiting time for transplantation of 3.7 y, 33 min of anastomosis, and not transplanted within the ESP. Confidence intervals are at the 95% interval. *indicate p<0.05 significant difference between DCD and DBD kidneys at the 5% level. BMI, body mass index; CIT, cold ischemia time; CVA, cerebrovascular accident; DBD, donation after brain death; DCD, donation after circulatory death; ESP, Eurotransplant Senior Program; HLA, human leukocyte antigen; HR, hazard ratio; PRA, panel-reactive antibody.
TABLE 2.
Hazard ratios for graft failure between donor types
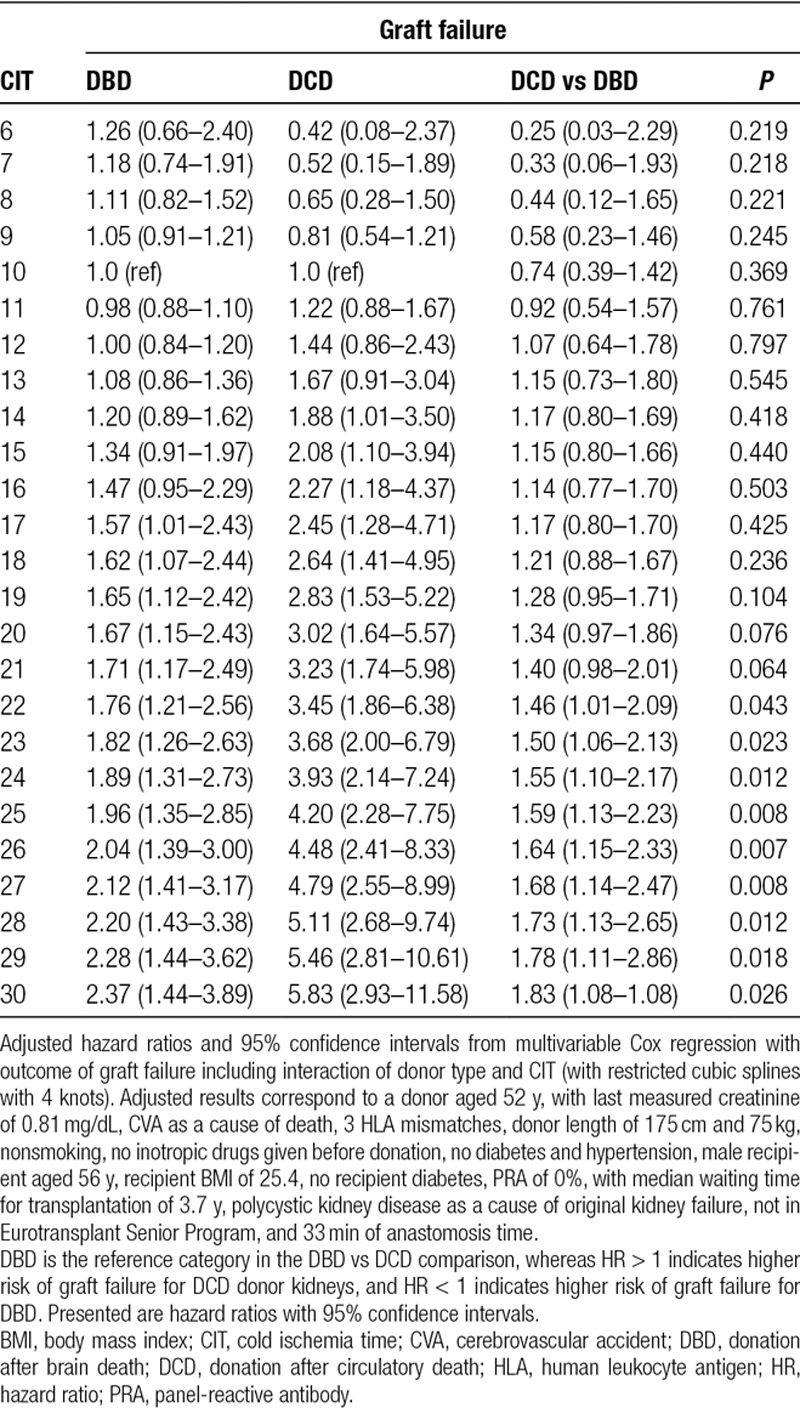
TABLE 3.
Hazard ratios for death-censored graft failure between donor types
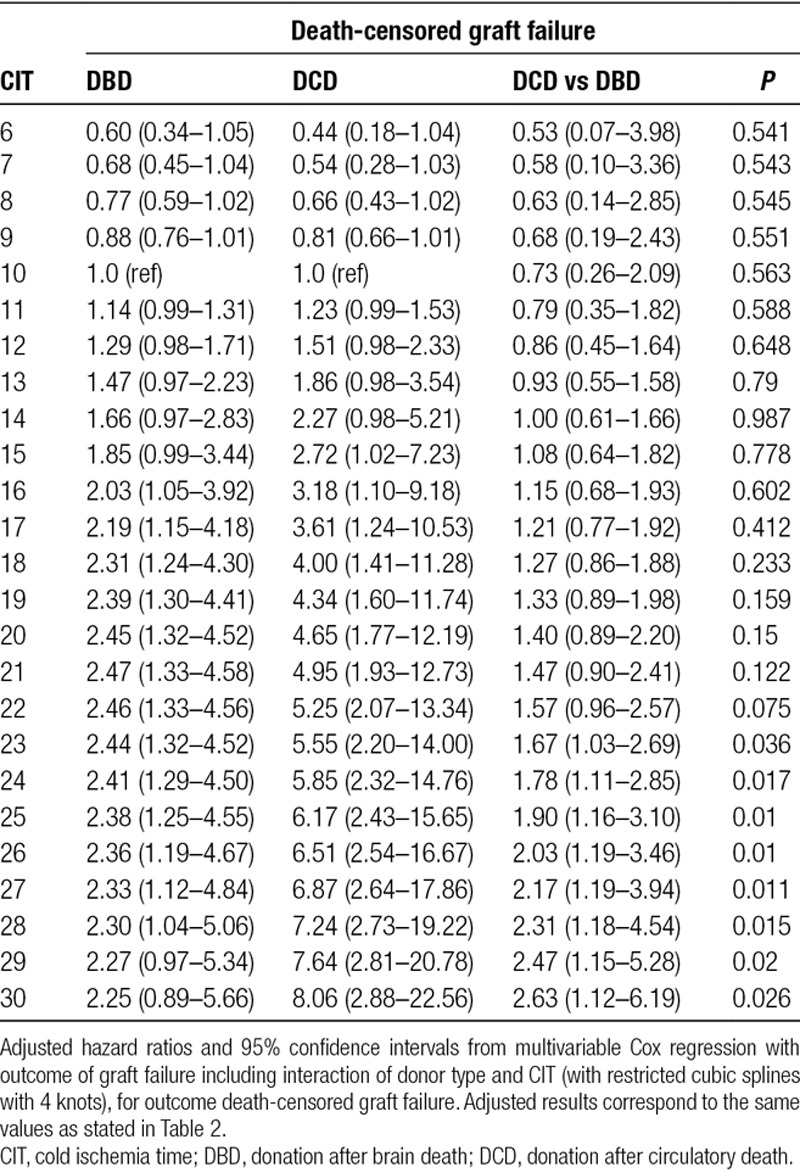
FIGURE 5.
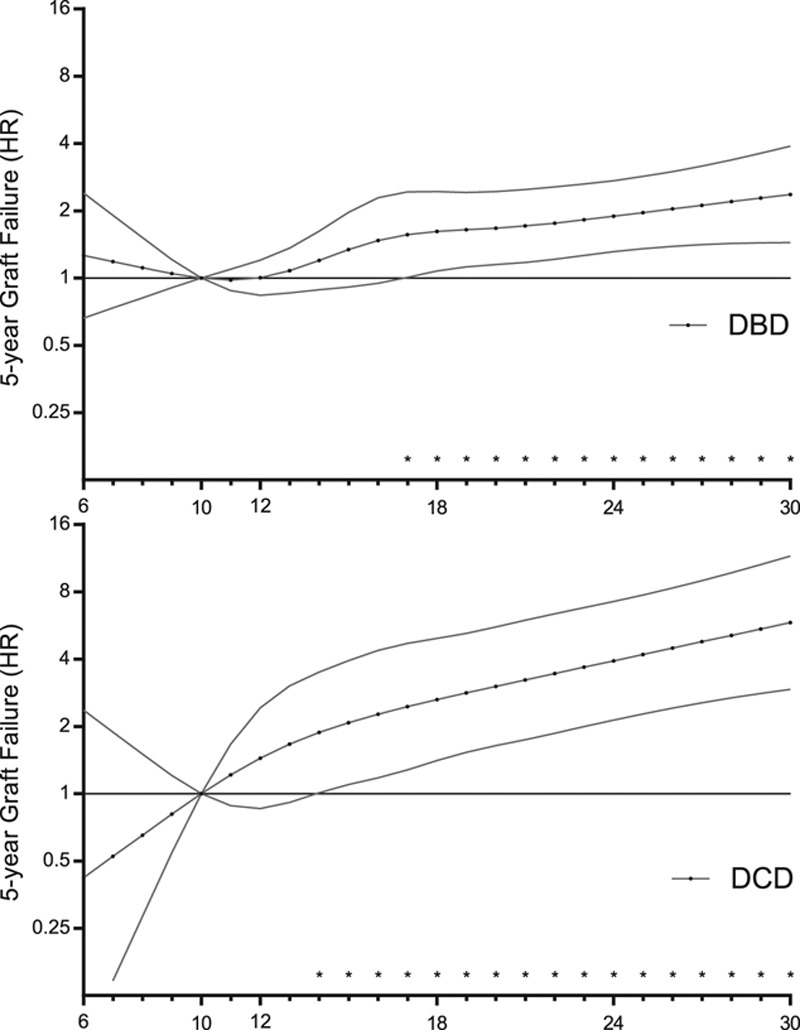
Risk of 5-y graft failure of transplanting DCD or DBD grafts with CIT, according to a reference time of 10 h. Adjusted results are shown, which correspond to the same values presented in Figure 4. CIT, cold ischemia time; DBD, donation after brain death; DCD, donation after circulatory death; HR, hazard ratio. * indicate p<0.05.
At 15 hours or more of CIT, an increased hazard for death-censored graft failure at 5 years was observed. At 23 hours or more of CIT, this hazard differed significantly for DCD and DBD donor kidneys (adjusted HR 1.67; 95% CI, 1.03-2.69; P = 0.036). No significant differences were found in terms of risk of 5-year mortality between DCD and DBD donor kidneys and increasing CIT.
Prolonged CIT and Donor Age
Figure 6 presents the combined risk of transplanting both DCD and DBD grafts with CIT for donors aged 30, 45, and 60. At 19 hours of CIT, the risk of 5-year graft failure was significantly higher for recipients of kidneys from 60-year-old DCD donors compared with recipients of kidneys from 60-year-old DBD donors (adjusted HR 1.33; 95% CI, 1.00-1.78; P = 0.045). At 25 hours of CIT, the risk of graft failure was also significantly higher for recipients of kidneys from 45-year-old DCD donors than it was for recipients of kidneys from 45-year-old DBD donors (adjusted HR 1.42; 95% CI, 1.02-1.99; P = 0.002); this risk decreased after 25 hours of CIT. Additionally, within the ESP, DCD kidneys with high CIT showed an increased 5-year risk of graft failure when compared to DBD kidneys (Figure 7; Figure S4, SDC, http://links.lww.com/TXD/A202 depicts the baseline differences between DBD and DCD in the ESP cohort). However, for 30-year-old donors, there was no significant difference in risk of 5-year graft failure for DCD and DBD kidneys, irrespective of prolonged CIT. The additive effect of donor age was not found to be multiplicative; interaction between donor age and donor type was not significant (adjusted linear interaction, P = 0.317), and the interaction of CIT and donor type according to different donor ages (CIT × donor type × donor age; adjusted linear triple interaction, P = 0.328).
FIGURE 6.
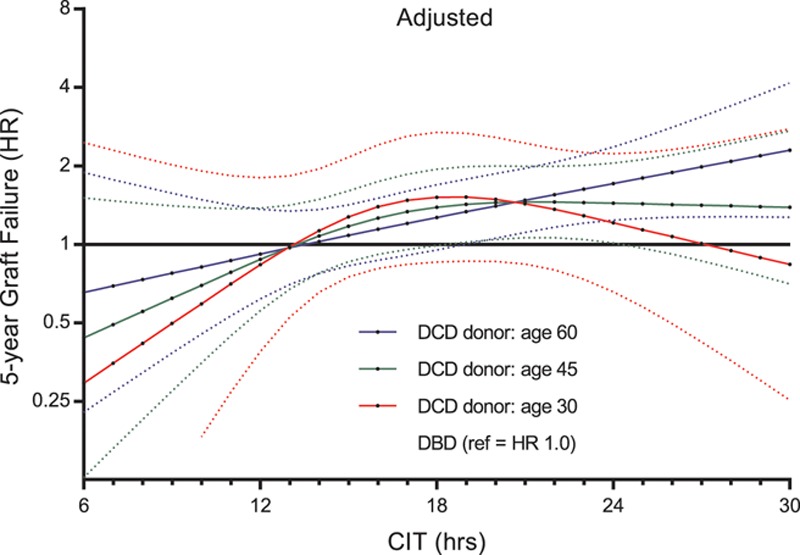
Risk of 5-y graft failure of transplanting DCD grafts with CIT according to a donor age of 30, 45, and 60 y, with each category compared with the same age of a DBD donor kidney as the reference category. Only adjusted results are shown, which correspond to the same values presented in Figure 4. CIT, cold ischemia time; DBD, donation after brain death; DCD, donation after circulatory death; HR, hazard ratio.
FIGURE 7.
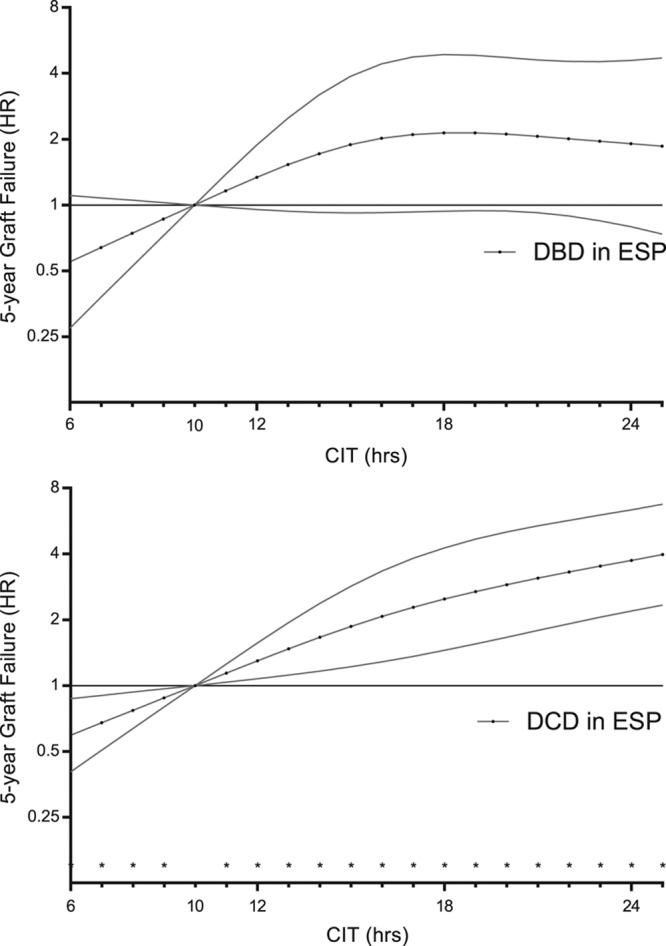
Risk of 5-y graft failure of transplanting DCD or DBD grafts with associations of CIT in the ESP. Cold ischemia time was modeled with a restricted cubic spline with 3 internal knots at 12, 15, and 20 h. For donor kidneys provided by the ESP, the median CIT was 15.8 h. Adjusted results are shown, which correspond to a donor aged 68 y, with last measured creatinine of 0.87 mg/dL, CVA as a cause of death, four HLA mismatches, height of 172 cm, weight of 75 kg, nonsmoker, no inotropic drugs administered before donation, and no diabetes and hypertension, and a male recipient aged 69 y, BMI of 25.9, no diabetes, PRA of 0, with a median waiting time for transplantation of 3.3 y, and 34 min of anastomosis. Confidence intervals are at the 95%. BMI, body mass index; CIT, cold ischemia time; CVA, cerebrovascular accident; DBD, donation after brain death; DCD, donation after circulatory death; ESP, Eurotransplant Senior Program; HLA, human leukocyte antigen; HR, hazard ratio; PRA, panel-reactive antibody.
Sensitivity Analyses
We sought to replicate the findings of 5-year graft survival, 5-year death-censored graft survival, and 5-year patient survival in a paired DCD kidney analysis to adjust for unmeasured donor quality confounders. DCD donors (n = 283) of both kidneys with CIT differences between kidneys of at least 1 hour were identified. Transplant characteristics (with the exception of CIT) and recipient characteristics did not differ between recipients of low- versus high-CIT groups. The DCD kidney recipients within the longer CIT group (median CIT 19.5, IQR 16.9–22.0) had a significantly higher risk of graft failure compared to the short CIT group (median CIT 14.6, IQR 11.8–17.2, with adjusted HR 1.40; 95% CI, 1-1.98; P = 0.048). This did not differ significantly for death-censored rates of graft failure and mortality at 5 years (Figure 8; see Table S1, SDC, http://links.lww.com/TXD/A202 for baseline differences between low- vs high-CIT groups).
FIGURE 8.
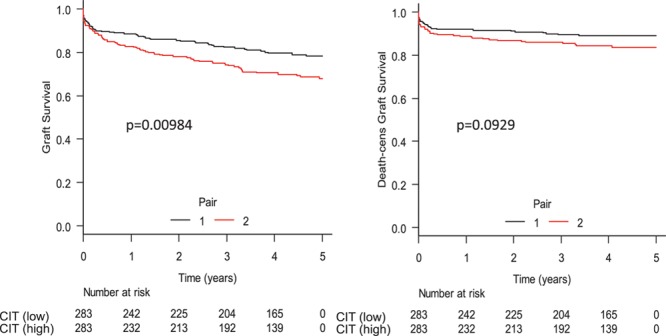
Paired DCD kidney analysis. Donation after circulatory death pair kidneys with at least 1 h of CIT difference were compared. Transplant and recipient characteristics were compared between the pairs, and no significant differences were observed. On the composite endpoint of graft survival, we found a significant difference between the low- and high-CIT pairs, but this was not significant for death-censored graft survival. CIT, cold ischemia time; DBD, donation after brain death; DCD, donation after circulatory death.
Following we analyzed the interaction of CIT with donor type according to different donor WITs, of which only the time from asystole to cold perfusion could be retrieved. In DCD kidney recipients, the donor WIT was associated with a significantly higher hazard for death-censored graft failure (per min WIT increase, adjusted P = 0.0115). If DCD donor WIT was above 20 minutes, the 5-year risk of death-censored graft failure increased for every hour of CIT, with a significant increase after 23 hours compared with DBD (adjusted HR 2.00; 95% CI, 1.04-3.80; P = 0.035; see Figure 9).
FIGURE 9.
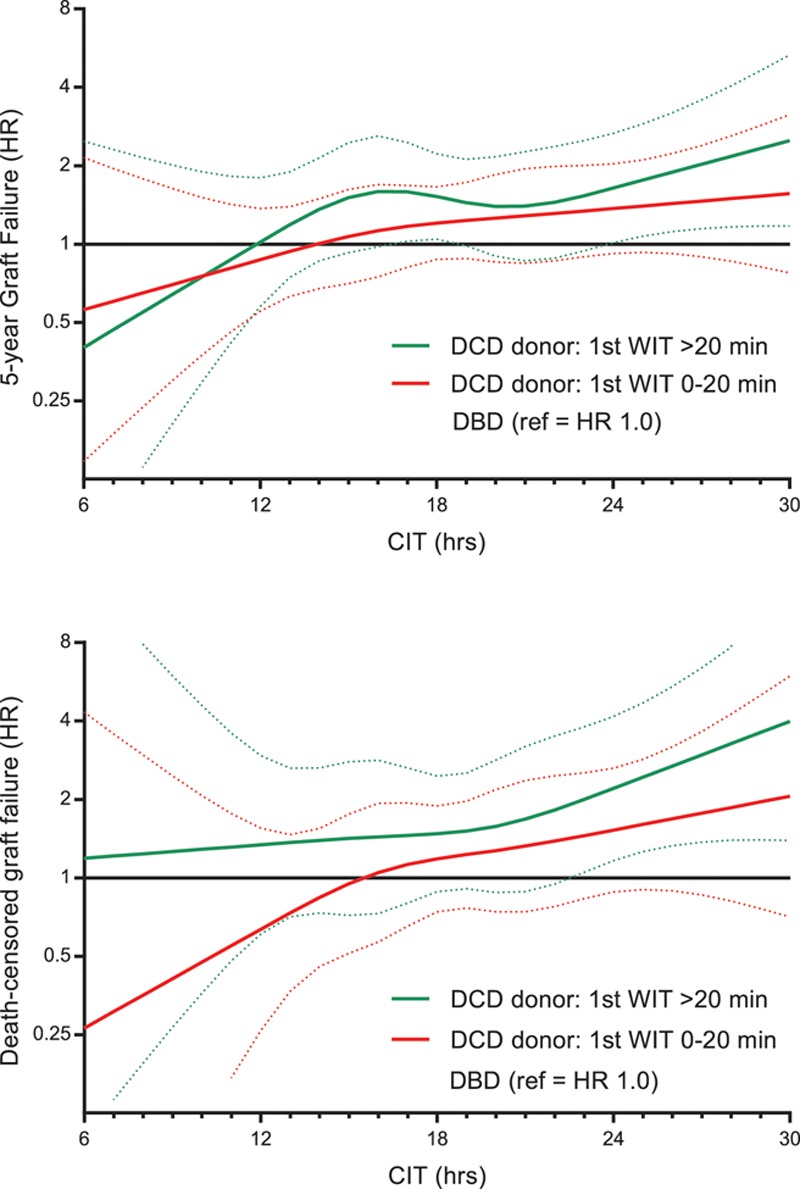
Influence of donor WIT on interaction with CIT in DCD kidneys as compared with DBD. Donor WIT was only registered from asystole to cold perfusion (as functional WIT could not be extracted from the national registry). CIT, cold ischemia time; DBD, donation after brain death; DCD, donation after circulatory death; HR, hazard ratio; WIT, warm ischemia time.
DISCUSSION
Higher CIT is associated with an increased risk of graft failure for both DCD and DBD donor kidney recipients. However, the risk of graft failure for recipients of DCD donor kidneys increased more for each extra hour of CIT than it did for DBD donor kidneys: with a reference CIT of 10 hours, the risk of graft failure for DCD kidneys increased after just 14 hours, while the same risk for DBD kidneys did not increase until at least 17 hours of CIT. With DBD as a reference category, we observed an increased risk of graft failure in DCD kidneys as compared with DBD kidneys after 12 hours of CIT, and this risk was significantly different after 22 hours. This additional risk for DCD kidneys with increased CIT as compared with DBD kidneys was also observed for the noncomposite outcome of death-censored graft failure but not for mortality. The risk of graft failure was significantly higher at 19 hours of CIT for recipients of kidneys from 60-year-old DCD donors than it was for recipients of kidneys from 60-year-old DBD donors. The same additional risk of graft failure was seen in the ESP for DCD donor kidney recipients. In contrast, increased CIT led to no difference in outcomes between 30-year-old DCD and DBD kidneys.
The Netherlands have a large controlled DCD donor pool, which allows for the analysis of differences in graft survival between DCD and DBD donors and between results from recipients of younger and older donor kidneys.17 However, identifying the precise CIT cutoff value which DCD kidney outcomes worsen relative to those of DBD were possibly subject to a lack of power in the analysis. The significant HR between DBD and DCD kidneys at 22 hours of CIT represents an estimated 7% (79.2–72.2) difference in graft survival after 5 years (corresponding to a relatively healthy donor aged 52 y and recipient aged 56 y). However, a trend of higher risk of graft failure was observed after 12 hours of CIT; for example, after 18 hours, DBD recipients were 5% (82.3–77.4) more likely to survive, which suggests clinical relevance despite not being statistically significant.18 It is unclear why exactly DCD kidneys demonstrate an earlier onset and more severe risk for worse graft survival with higher CIT; however, donor WIT may contribute to the differences in terms of risk of graft failure due to extra ischemia-mediated cellular damage.7 If we model CIT with a hypothesized donor WIT of 5 minutes in DCD donors and impute a WIT of 0 minutes in DBD donors, the correlation between CIT and donor type disappears, suggesting that the impact of CIT is exacerbated by donor WIT in DCD kidneys. However, functional donor WIT, including warm ischemic injury during the agonal phase when systolic blood pressure is below 50 mm Hg, is not registered in the NOTR and therefore could not be taken into account in this analysis.
Our results confirm the findings of Summers and colleagues,6 who found in a UK cohort (2005–2010, n = 5895) that increased CIT (≥24 h) was associated with decreased graft survival in DCD donor kidney recipients when compared with their DBD counterparts. Higher donor age was associated with decreased graft survival in recipients of deceased donor kidneys but showed no difference between DCD and DBD kidneys. When we did identify clinically relevant differences between donor types at the age of 60 years, we analyzed the interaction between the continuous variable CIT and donor type according to different donor ages (CIT × donor type × donor age). A previous Dutch study by van Vliet and colleagues,19 using data from the same NOTR (1990–2007), found significantly better rates of graft survival at under 16 hours of CIT for DCD kidneys and under 20 hours of CIT for DBD kidneys. The median CIT (23.7 h) in the study conducted by van Vliet et al was higher than that of the data analyzed and categorized here. In another Dutch study by Roodnat et al,20 CIT was found to be independently and significantly associated with death-censored graft failure, with the highest risk in the first week after transplantation. However, this study included both recipients from living related kidney donors and deceased donors, and outcomes were not presented separately.
The effects of CIT and donor type on long-term kidney transplantation have not been studied in the United States.12 This was confirmed by a recent paired-kidney analysis from the United States (1989–2013, n = 6276) that found similar graft survival rates between kidney pairs with a delta CIT of 1 hour or higher.8 Our findings suggest that, given the availability of a DCD donor kidney with a WIT that is considered acceptable, the additional cold ischemia injury caused by at least one extra hour does affect the long-term risk of graft failure. Another US cohort showed no significant difference in outcome after kidney transplantation between DCD and non-DCD donors, and this association was not affected by ECD status.21 This may reflect different approaches to selecting DCD donor kidneys for transplantation, as DCD kidneys represent a smaller proportion of transplants in the United States compared with the United Kingdom and the Netherlands.22,23 Additionally, a large proportion of kidneys in this cohort come from DCD kidneys from elderly donors with prolonged WITs.
The differences among the findings obtained in these countries may be due to allocation and policy differences, and ethical principles for deceased donor procurement. In France, as many other countries, controlled DCD donors are not accepted for organ transplantation.24,25 Similarly to our research, a French study (n = 4777) analyzed CIT as a continuous variable, finding that the risk of graft failure in DBD donor recipients was multiplied by 1.013 for each extra hour of CIT.26 Many other studies have been unable to compare outcomes between controlled DCD and DBD kidneys, indicating that, irrespective of donor source, CIT above a certain categorical limit is associated with graft failure.27-32
The primary strength of our study is the national cohort in a high-quality database that provides thorough data on mortality after graft loss. In terms of limitations, center-specific differences in demographics, treatment, or outcomes were not able to be factored into our analysis. Furthermore, since DCD donor kidneys are sometimes classified as marginal and therefore (re)allocated to marginal recipients, there may still exist residual confounding factors, despite the adjustment of many confounders in the analysis. The present analysis included first-time transplanted recipients only.
In conclusion, our study indicates that the association of CIT and graft failure was stronger for DCD donor kidneys compared with DBD. This was not true if kidneys were from younger (ie, 30-y-old) DCD donors. While these data may help to optimize the scheduling of transplant surgery, future studies on machine perfusion cohorts are necessary to identify the causes of the differential effects of CIT.
ACKNOWLEDGMENTS
All Dutch transplant centers were involved in the collection of the data registered in the Dutch Organ Transplantation Registry.
Supplementary Material
Footnotes
Published online 25 April, 2019.
H.P.-S. and J.H.E.H. contributed equally to the study.
The authors declare no conflicts of interest.
H.P.-S., J.H.E.H., M.M.I., T.M.v.G., and F.J.B. were involved in the design of the study. H.P.S. did the statistical analysis and drafted the article together with J.H.E.H., whereas all authors took part in the data interpretation and its revision. Each author contributed important intellectual content during manuscript drafting or revision and accepts accountability for the overall work by ensuring that questions pertaining to the accuracy or integrity of any portion of the work are appropriately investigated and resolved.
The Dutch Organ Transplantation Registry (NOTR) was funded and administered by the Dutch Transplantation Foundation (NTS), with initial additional funding from the Dutch Health Care Insurance Board (CVZ). The funding sources had no role in the study design, data collection, data analysis, data interpretation, or writing of the report. The corresponding author had full access to the data and final responsibility for the decision to submit for publication.
Supplemental digital content (SDC) is available for this article. Direct URL citations appear in the printed text, and links to the digital files are provided in the HTML text of this article on the journal’s Web site (www.transplantationdirect.com).
REFERENCES
- 1.Domínguez-Gil B, Haase-Kromwijk B, Van Leiden H, et al. Current situation of donation after circulatory death in European countries. Transpl Int. 2011;24:676. [DOI] [PubMed] [Google Scholar]
- 2.Thuong M, Ruiz A, Evrard P, et al. New classification of donation after circulatory death donors definitions and terminology. Transpl Int. 2016;29:749. [DOI] [PubMed] [Google Scholar]
- 3.De Rosa S, Antonelli M, Ronco C. Hypothermia and kidney: a focus on ischaemia-reperfusion injury. Nephrol Dial Transplant. 2017;32:241. [DOI] [PubMed] [Google Scholar]
- 4.Devarajan P. Cellular and molecular derangements in acute tubular necrosis. Curr Opin Pediatr. 2005;17:193. [DOI] [PubMed] [Google Scholar]
- 5.Lee DB, Huang E, Ward HJ. Tight junction biology and kidney dysfunction. Am J Physiol Renal Physiol. 2006;290:F20. [DOI] [PubMed] [Google Scholar]
- 6.Summers DM, Johnson RJ, Hudson A, et al. Effect of donor age and cold storage time on outcome in recipients of kidneys donated after circulatory death in the UK: a cohort study. Lancet. 2013;381:727. [DOI] [PubMed] [Google Scholar]
- 7.Sammut IA, Burton K, Balogun E, et al. Time-dependent impairment of mitochondrial function after storage and transplantation of rabbit kidneys. Transplantation. 2000;69:1265. [DOI] [PubMed] [Google Scholar]
- 8.Kayler L, Yu X, Cortes C, et al. Impact of cold ischemia time in kidney transplants from donation after circulatory death donors. Transplant Direct. 2017;3:e177. [DOI] [PMC free article] [PubMed] [Google Scholar]
- 9.Kootstra G, Kievit JK, Heineman E. The non heart-beating donor. Br Med Bull. 1997;53:844. [DOI] [PubMed] [Google Scholar]
- 10.Klein JP, Moeschberger ML. Survival Analysis: Techniques for Censored and Truncated Data: Statistics for Biology and Health. 20052nd ed New York, NY: Springer. [Google Scholar]
- 11.Desquilbet L, Mariotti F. Dose-response analyses using restricted cubic spline functions in public health research. Stat Med. 2010;29:1037. [DOI] [PubMed] [Google Scholar]
- 12.Rao PS, Schaubel DE, Guidinger MK, et al. A comprehensive risk quantification score for deceased donor kidneys: the kidney donor risk index. Transplantation. 2009;88:231. [DOI] [PubMed] [Google Scholar]
- 13.van Buuren S, Groothuis-Oudshoorn K. mice: Multivariate Imputation by Chained Equations in R. J Stat Softw. 2011;45:1. [Google Scholar]
- 14.Marshall A, Altman DG, Holder RL, et al. Combining estimates of interest in prognostic modelling studies after multiple imputation: current practice and guidelines. BMC Med Res Methodol. 2009;9:57. [DOI] [PMC free article] [PubMed] [Google Scholar]
- 15.Frei U, Noeldeke J, Machold-Fabrizii V, et al. Prospective age-matching in elderly kidney transplant recipients—a 5-year analysis of the Eurotransplant Senior Program. Am J Transplant. 2008;8:50. [DOI] [PubMed] [Google Scholar]
- 16.R: A Language and Environment for Statistical Computing [computer program]. 2016Copenhagen, Denmark; GBIF. [Google Scholar]
- 17.Eurotransplant International Foundation Eurotransplant international foundation annual report 2015. 2016. Available at https://www.eurotransplant.org/cms/mediaobject.php?file=AR_ET_20153.pdf. Accessed July 1, 2017.
- 18.van Rijn MHC, Bech A, Bouyer J, et al. Statistical significance versus clinical relevance. Nephrol Dial Transplant. 2017;32(Suppl 2):ii6. [DOI] [PubMed] [Google Scholar]
- 19.van der Vliet JA, Warlé MC, Cheung CL, et al. Influence of prolonged cold ischemia in renal transplantation. Clin Transplant. 2011;25:E612. [DOI] [PubMed] [Google Scholar]
- 20.Roodnat JI, Mulder PG, Van Riemsdijk IC, et al. Ischemia times and donor serum creatinine in relation to renal graft failure. Transplantation. 2003;75:799. [DOI] [PubMed] [Google Scholar]
- 21.Singh SK, Kim SJ. Does expanded criteria donor status modify the outcomes of kidney transplantation from donors after cardiac death? Am J Transplant. 2013;13:329. [DOI] [PubMed] [Google Scholar]
- 22.Eurotransplant International Foundation. Donor cause of death by donation after circulatory death, all causes, kidney, all ABO, all states, all ages, data of 2016, deceased donors, all recovery categories. Available at https://optn.transplant.hrsa.gov/data/view-data-reports/build-advanced/. Accessed July 1, 2017.
- 23.Gill J, Rose C, Lesage J, et al. Use and outcomes of kidneys from donation after circulatory death donors in the United States. J Am Soc Nephrol. 2017;28:3647. [DOI] [PMC free article] [PubMed] [Google Scholar]
- 24.Wind J, Faut M, van Smaalen TC, et al. Variability in protocols on donation after circulatory death in Europe. Crit Care. 2013;17:R217. [DOI] [PMC free article] [PubMed] [Google Scholar]
- 25.Bendorf A, Kelly PJ, Kerridge IH, et al. An international comparison of the effect of policy shifts to organ donation following cardiocirculatory death (DCD) on donation rates after brain death (DBD) and transplantation rates. PLoS One. 2013;8:e62010. [DOI] [PMC free article] [PubMed] [Google Scholar]
- 26.Debout A, Foucher Y, Trébern-Launay K, et al. Each additional hour of cold ischemia time significantly increases the risk of graft failure and mortality following renal transplantation. Kidney Int. 2015;87:343. [DOI] [PubMed] [Google Scholar]
- 27.Wong G, Teixeira-Pinto A, Chapman JR, et al. The impact of total ischemic time, donor age and the pathway of donor death on graft outcomes after deceased donor kidney Transplantation. 2017;101:1152. [DOI] [PubMed] [Google Scholar]
- 28.Denecke C, Biebl M, Fritz J, et al. Reduction of cold ischemia time and anastomosis time correlates with lower delayed graft function rates following transplantation of marginal kidneys. Ann Transplant. 2016;21:246. [DOI] [PubMed] [Google Scholar]
- 29.Opelz G, Döhler B. Multicenter analysis of kidney preservation. Transplantation. 2007;83:247. [DOI] [PubMed] [Google Scholar]
- 30.Mikhalski D, Wissing KM, Ghisdal L, et al. Cold ischemia is a major determinant of acute rejection and renal graft survival in the modern era of immunosuppression. Transplantation. 2008;85(7 SupplS3. [DOI] [PubMed] [Google Scholar]
- 31.Goldsmith PJ, Ridgway DM, Pine JK, et al. Sequential transplant of paired kidneys following donation after cardiac death: impact of longer cold ischemia time on the second kidney on graft and patient outcome. Transplant Proc. 2010;42:3960. [DOI] [PubMed] [Google Scholar]
- 32.Giblin L, O’Kelly P, Little D, et al. A comparison of long-term graft survival rates between the first and second donor kidney transplanted—the effect of a longer cold ischaemic time for the second kidney. Am J Transplant. 2005;5:1071. [DOI] [PubMed] [Google Scholar]


