

Abstract
INTRODUCTION:
Little is known about the role of age on neurodegeneration and protein deposition in atypical variants of Alzheimer’s disease (AD).
METHODS:
Regional tau and beta-amyloid PET standard uptake value ratios and grey matter volumes were calculated in a cohort of 42 atypical AD participants. The relationship between regional metrics and age was modelled using a Bayesian hierarchical linear model.
RESULTS:
Age was strongly associated with tau uptake across all cortical regions, particularly parietal, with greater uptake in younger participants. Younger age was associated with smaller parietal and lateral temporal volumes. Regional beta-amyloid differed little by age. Age showed a stronger association with tau than volume and beta-amyloid in all cortical regions. Age was not associated with cognitive performance.
DISCUSSION:
Age is an important determinant of severity of cortical tau uptake in atypical AD, with young participants more likely to show widespread and severe cortical tau uptake.
Keywords: AV-1451, Pittsburgh compound B, amyloid, tau, magnetic resonance imaging, positron emission tomography, age
1. Introduction
Age is an important determinant of brain health, with brain atrophy observed in older people[1]. However, paradoxically, the opposite relationship has been observed in Alzheimer’s disease (AD), with younger patients typically showing greater cortical atrophy than older patients, and older patients showing a pattern of disease more focused on the medial temporal lobe[2–5]. There is a great deal of clinical and pathological heterogeneity in AD across the age span that may contribute to these findings. Pathologically, the distribution of tau deposition differs with age[6]. Older patients are more likely to show a limbic-predominant pattern of tau deposition while younger patients are more likely to show a hippocampal-sparing pattern of tau deposition[6]. Findings from tau-PET studies using the [18F]AV-1451 ligand in AD largely fit with these pathological findings, with younger AD patients showing greater cortical tau uptake than older patients[7–10], and older patients showing mild medial temporal tau uptake with sparing of the cortex[7]. However, older patients are also more likely to have other pathologies and comorbidities contributing to their disease[11], such as vascular impairment, and deposition of the TAR DNA binding protein of 43KDa which increase with age and can be associated with medial temporal atrophy[12–15]. Understanding age affects across this wide spectrum of AD is, therefore, challenging.
Atypical variants of AD often have a young age at onset and show less involvement from other comorbidities, such as white matter hyperintensities[16] and TDP-43[17]; and hence allow for a less complicated interpretation of age associations. Two of the most common clinical variants of atypical AD are posterior cortical atrophy (PCA)[18, 19] and the logopenic variant of primary progressive aphasia (lvPPA)[20] which present with visuospatial/perceptual or language deficits, respectively. On MRI and [18F]AV-1451 PET, PCA involves the occipital and parietal lobes, while lvPPA involves left temporoparietal regions[21–25], although there is a large degree of overlap between the syndromes, particularly in [18F]AV-1451 uptake which is widespread in both[23]. Little is currently known about the role of age on these patterns in atypical AD. Furthermore, it is unknown whether age is a stronger predictor of neurodegeneration or protein deposition in AD, and whether it influences cognition. Understanding the role of age is critical to increase understanding of the pathophysiology of the disease, in helping to interpret imaging findings, both clinically and in clinical treatment trials, and could aid in providing better information and prognosis to patients and families.
We aimed to assess the relationship between age and deposition of the two cardinal AD proteins, paired helical filament tau and beta-amyloid (Aβ), as well as neurodegeneration measured on MRI in atypical AD participants, and compare age associations across modalities. We also aimed to assess the evidence that age is predictive of the degree of cognitive impairment in atypical AD.
2. Methods
2.1. Patient recruitment
Forty-two patients that met clinical diagnostic criteria for either PCA[18] (n=21) or lvPPA[20] (n=21) were recruited from the Department of Neurology, Mayo Clinic, Rochester, into an atypical AD NIH- funded study between June 9th 2016 and March 8th 2018. All patients underwent a neurological examination (KAJ, JGR), neuropsychological testing, a volumetric 3T MRI, [18F]AV-1451 PET and Pittsburgh compound B (PiB)-PET. To be included in the study patients had to show Aβ deposition on PiB-PET (as described below). Patients were excluded if they had a stroke/tumor; if they presented with early episodic memory impairment or met clinical criteria for amnestic mild cognitive impairment or typical AD [26]; if they had poor vision or if MRI was contraindicated. One patient was excluded for not showing Aβ deposition on PiB-PET. The median age of the cohort at assessment was 68 years (interquartile range, 61–74 years, min = 53 years, max = 80 years), with 69% female. The study was approved by the Mayo Clinic IRB and all patients or proxies consented for the research study (proxies provided consent for 23 participants).
2.2. Clinical testing
All participants underwent a thorough neurological evaluation which included the Montreal Cognitive Assessment Battery (MoCA) [27] to assess general cognitive function, the Clinical Dementia Rating (CDR) Scale [28] to assess functional ability, 15-item Boston Naming Test (BNT) [29] to assess naming, the Repetition of Sentences subtest of the Boston Diagnostic Aphasia Examination (BDAE) [30] to assess sentence repetition, the Western Aphasia Battery subtest for ideomotor apraxia [31], and tests of letter (FAS) and animal fluency to assess phonemic and semantic fluency. The presence/absence of oculomotor apraxia and optic ataxia were assessed as previously described[23]. A subject was considered to have Gerstmann syndrome if they had acalculia, left-right confusion, agraphia or finger agnosia. The severity of simultanagnosia was determined on a 20-point scale, as previously described[23].
The neuropsychological battery included the Visual Object and Space Perception Battery (VOSP) [32] incomplete letters test to assess visual perception, the Rey-Osterrieth (Rey-O) Complex Figure test [33] to assess visual constructional abilities, and the Wechsler Memory Scale-III (WMS-III) Visual Reproduction test [34] to assess visual memory. The Rey-O and WMS-III % retention scores were expressed as Mayo Older American Normative (MOANS) age-adjusted scale scores which have a mean of 10 and standard deviation of 3 among cognitively normal individuals.
2.3. Neuroimaging
All PET scans were acquired using GE PET/CT scanners. For tau-PET, participants were injected with ~370MBq (range 333–407MBq) of [18F]AV-1451, followed by a 20-minute PET acquisition performed 80 minutes after injection. For PiB-PET, participants were injected with ~628 MBq (range, 385–723 MBq) of PiB and after a 40-to-60-minute uptake period a 20-minute PiB scan was obtained. Both 20-minute late- uptake PET scans consisted of four, five-minute dynamic frames following a low dose CT image. PET sinograms were iteratively reconstructed into a 256mm FOV (pixel size= 1.0mm, slice thickness=3.3mm). The four individual frames were averaged for analysis. All participants underwent a 3T MRI protocol on a GE scanner that included magnetization-prepared rapid gradient-echo (MPRAGE) (TR/TE/T1=2300/3/900ms; 26-cm FOV, slice thickness=1.2mm, in-plane resolution= 1mm) and fluid- attenuated inversion recovery (FLAIR) (TR/TE=11000/147ms; 22-cm FOV; slice thickness=3.6mm) sequences.
Regional metrics were calculated for each neuroimaging modality for the same set of 10 regions-of-interest (ROIs) generated using the Mayo Clinic Adult Lifespan Template (MCALT) (https://www.nitrc.org/projects/mcalt/): medial temporal (entorhinal cortex+parahippocampal hippocampus+amygdala), lateral temporal (inferior+middle+superior temporal gyri), fusiform gyrus, inferior parietal (inferior parietal+supramarginal+angular gyrus), superior parietal, posterior cingulate, precuneus, medial occipital (cuneus+lingual+calcerine), lateral occipital (inferior+middle+superior occipital) and lateral frontal (middle frontal+superior frontal+inferior triangularis+inferior opercularis+frontal inferior orb). These regions were selected to cover most of the cortex as well as the medial temporal lobe, and because these regions are involved in atypical AD[23–25]. The image processing steps are detailed (Figure 1 )legend. Median [18F]AV-1451 uptake and PiB-PET uptake were calculated across grey and white matter in each ROI, and median values (composite regions were combined as the size-weighted mean of medians) were divided by median uptake in cerebellar crus grey matter to create standard uptake value ratios (SUVRs). The MCALT atlas was also used to calculate grey matter volume of each ROI as a sum of the segmentation grey matter probabilities. Total intracranial volume (TIV) was also calculated. For inclusion in the study, participants were considered to have Aβ deposition on PiB-PET if the global PiB SUVR[35] was greater than 1.42[36]. White matter hyperintensities were segmented and manually edited on the FLAIR images by a trained image analyst (AJ) using a semi-automated method[37].
Figure 1: Image analysis processing steps.
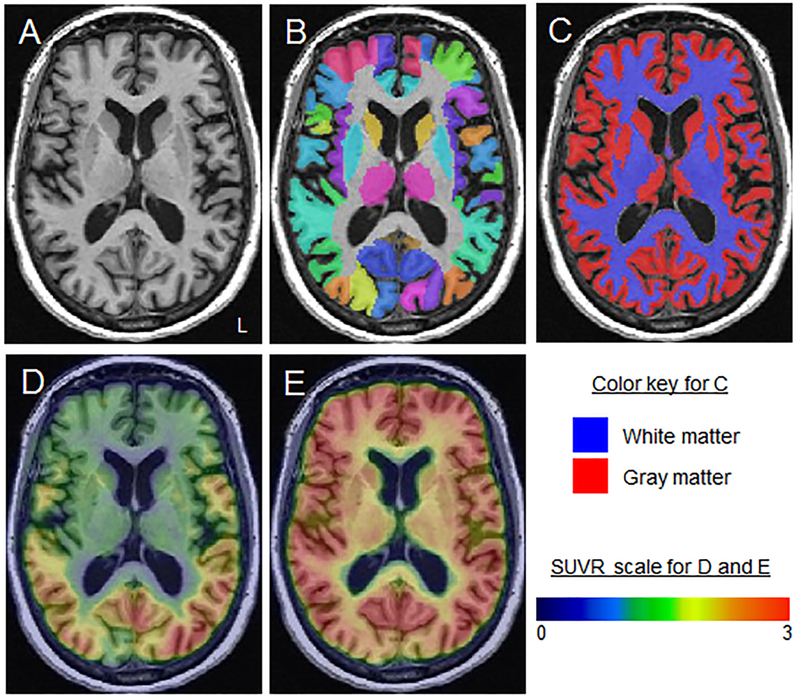
A: The subject-space MPRAGE is shown for a PCA participant.B: Normalization parameters were computed between each MPRAGE and the MCALT atlas using ANTs and the MCALT atlases were propagated to native MPRAGE space and used to output regional values. C: The MPRAGE scans were segmented using unified segmentation in SPM12 with MCALT tissue priors and settings. D and E: [18F]AV-1451 (D) and PiB-PET (E) images were co-registered to each participant’s MPRAGE using 6 degrees-of-freedom registration in SPM12. Median [18F]AV-1451 uptake and PiB-PET uptake were calculated across grey and white matter in each ROI, and median values (composite regions were combined as the size-weighted mean of medians) were divided by median uptake in cerebellar crus grey matter to create standard uptake value ratios (SUVRs). The MCALT atlas was also used to calculate grey matter volume of each ROI as a sum of the segmentation grey matter probabilities.
2.4. Statistical analysis
The goal of our analysis was to compare age associations across regions within a modality, across modalities within a region, and between lvPPA and PCA. To achieve our goal, we used Markov Chain Monte Carlo simulation to obtain posterior estimates across thirty regions, three modalities, and two syndromes from a single, comprehensive hierarchical linear model in the Bayesian paradigm, which addressed the problem of multiple comparisons while providing more accurate, stable, and generalizable estimates[38, 39]. Estimates of the posterior distribution were obtained using R [40] version 3.4.2 and the rjags [41] package version 4–6. Results were categorized into two tiers; we us the term “evidence” when there was a posterior probability ≥0.90 of an effect and the term “strong evidence” when there was a posterior probability ≥0.99 of an effect. More detailed motivations and explanations for this model can be found in Appendix A.
In a secondary analysis, we fit ten independent linear models using age-at-scan to predict the ten clinical test measures in an attempt to show directionality of the age effect on clinical presentation. Thirty one patients that had complete clinical data (17 lvPPA and 14 PCA) were included in these models. A priori we acknowledge that these clinical instruments are themselves measuring a composite of multiple factors that comprise the clinical presentation, adding additional layers of complexity to any more sophisticated analyses. Hence, further analyses that would require a method of standardization across the ten clinical outcome measures of these clinical tests were not pursued and exploratory results were not corrected for multiple comparisons.
3. Results
3.1. Group characteristics
Age at scan did not differ between IvPPA and PCA, although PCA had younger age at onset and longer disease duration (Table 1). PCA performed worse than IvPPA on CDR, VOSP letters, Rey-O and simultanagnosia severity, and had a greater proportion of optic ataxia, oculomotor apraxia and Gerstmann syndrome. There was a trend for PCA to show greater burden of white matter hyperintensities.
Table 1:
Demographic and clinical features of the cohort
| Total (N=42) | lvPPA (N=21) | PCA (N=21) | P value | |
|---|---|---|---|---|
| Female sex | 29 (69.0%) | 14 (66.7%) | 15 (71.4%) | >.99 |
| Age Onset, years | 62 (56, 68) | 65 (59, 72) | 58 (55, 64) | 0.03 |
| Age at scan, years | 68 (61, 74) | 68 (62, 75) | 65 (60, 71) | 0.40 |
| Disease duration, years | 3 (2, 5) | 2 (2, 3) | 4 (3, 6) | 0.003 |
| Right handedness | 37 (88.1%) | 18 (85.7%) | 19 (90.5%) | 0.66 |
| Global PiB SUVR | 2.43 (2.19, 2.69) | 2.44 (2.19, 2.89) | 2.42 (2.19, 2.54) | 0.54 |
| MoCA (/30) | 18 (14, 22) | 19 (17, 22) | 16 (12, 20) | 0.18 |
| CDR-SB (/18) | 3 (1, 5) | 2 (1, 3) | 4 (2, 9) | 0.004 |
| Boston naming test (/15) | 12 (9, 13) | 11 (8, 13) | 12 (9, 14) | 0.25 |
| Repetition Boston Diagnostic (/10) | 8 (6, 9) | 7 (6, 8) | 8 (6, 9) | 0.21 |
| WAB ideomotor praxis (/60) | 58 (56, 60) | 58 (56, 60) | 59 (54, 60) | 0.82 |
| Letter Fluency (FAS) | 29 (22, 34) | 26 (22, 32) | 32 (25, 42) | 0.22 |
| Animal Fluency | 11 (7, 14) | 10 (8, 14) | 12 (6, 15) | 0.91 |
| WMS III VR % Retention MOANS | 8 (7, 10) | 9 (7, 11) | 8 (6, 9) | 0.34 |
| Optic ataxia | 8 (19.0%) | 0 (0.0%) | 8 (38.1%) | 0.003 |
| Oculomotor apraxia | 7 (16.7%) | 0 (0.0%) | 7 (33.3%) | 0.009 |
| Gertsmann syndrome | 14 (35.9%) | 2 (10.5%) | 12 (60.0%) | 0.002 |
| Simultanagnosia severity | 17 (8, 19) | 19 (17, 20) | 8 (3, 13) | < 0.001 |
| VOSP Letters | 18 (14, 19) | 19 (18, 20) | 14 (4, 18) | <.001 |
| Rey-O MOANS | 2 (2, 6) | 6 (2, 10) | 2 (2, 2) | 0.002 |
| WMH volume, cm3 | 14.2 (10.4, 19.9) | 11.8 (9.8, 18.3) | 17.4 (13.1, 27.6) | 0.05 |
| WMH volume, % of white matter vol. | 3.51 (2.39, 5.03) | 2.97 (2.37, 4.06) | 4.16 (2.57, 6.76) | 0.11 |
Data are shown as median (25th percentile, 75th percentile) or N (%). MoCA = Montreal Cognitive Assessment Battery; CDR = Clinical Dementia Rating Scale sum of boxes; WAB = Western Aphasia Battery; WMS III VR % Retention = Wechsler memory scale, version 3, visual reproduction percent retention; VOSP = Visual object and space perception; MOANS= Mayo’s older adults normative scale; WMH = white matter hyperintensities
3.2. Age associations in the entire cohort
Negative associations were observed between tau-PET uptake and age across all ROIs except medial temporal lobe, with younger age associated with greater tau-PET uptake (Figure 2). The age effect was largest for the four parietal ROIs, with the age effect in posterior cingulate (27%) greater than in all other regions (probabilities ≥0.94) (Table 2). Age effects were similar for inferior parietal, superior parietal and precuneus regions (approximately 25%), while age effects in all other regions were smaller (Table 2). For MRI-volume, positive associations were observed with age, whereby younger age was associated with smaller volumes, although age effects were smaller than those observed for tau-PET (Figure 2). The age effect was comparable for the parietal and lateral temporal regions at roughly 5% or less (Figure 2). There was no apparent age effect on volume in fusiform, medial temporal, lateral occipital, or lateral frontal ROIs, but indications that younger participants may have had larger volumes of the medial occipital lobe with an age effect of about −3%. Across regions, Aβ varied little with age effects of only a few percent (Figure 2).
Figure 2: Decade-age associations with tau SUVR, MRI-volume and Aβ SUVR in the ten regions-of- interest in the whole atypical AD cohort.
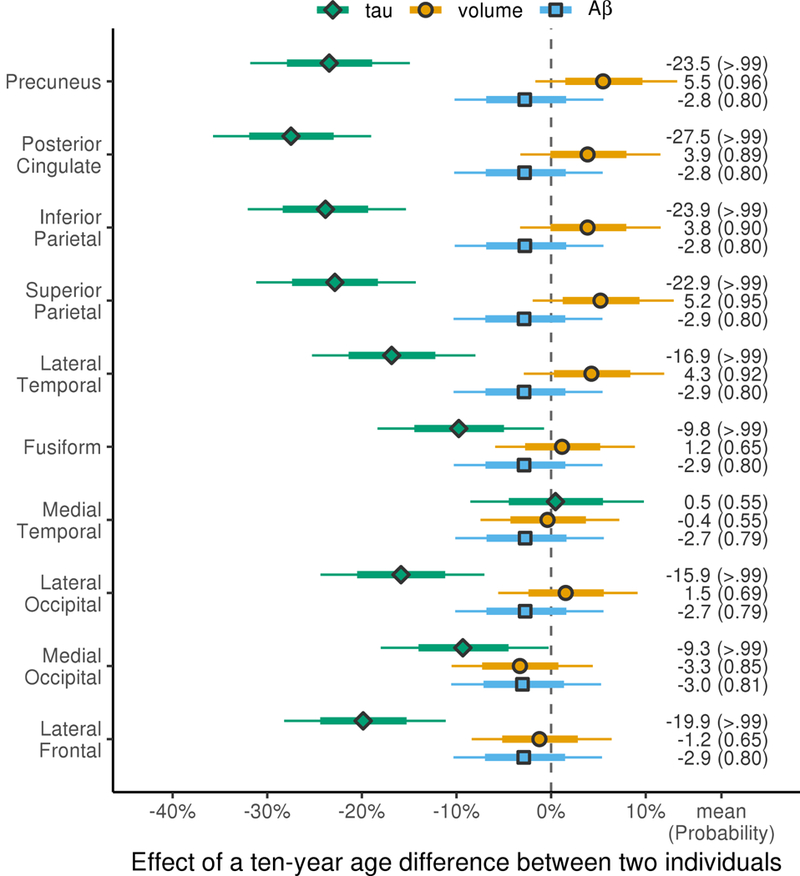
Estimates are shown as median percentage difference in biomarker for patients with a ten-year difference in age-at-presentation (i.e. comparing a 75 year old to a 65 year old, or a 70 year old to a 60 year old) with posterior probabilities of a nonzero decade-age association in each region for each modality shown in brackets. The thick and thin bars in each row represent 80% and 98% posterior confidence intervals, which clearly show two levels of posterior probability; posterior probability > .99 of a nonzero decade-age effect when the thinner bar doesn’t cross the zero line and posterior probability >.90 of a nonzero decade-age effect when the thicker bar doesn’t cross the zero line.
Table 2: Comparisons of regional decade-age associations within each modality.
The median difference in percent decade-age effects is given followed by the posterior probability of a difference in parentheses, i.e. the probability decade-age effects are different between regions within modality.
| Posterior | Inferior | Superior | Lateral | Medial | Lateral | Medial | Lateral | ||||
|---|---|---|---|---|---|---|---|---|---|---|---|
| Process | Precuneus | Cingulum | Parietal | Parietal | Temporal | Fusiform | Temporal | Occipital | Occipital | Frontal | |
| tau | Precuneus | 4% (0.96) | 0% (0.57) | −1% (0.60) | −7% (>.99) | −14% (>.99) | −24% (>.99) | −8% (>.99) | −14% (>.99) | ||
| Posterior Cingulum | −4% (0.96) | −4% (0.94) | −5% (0.97) | −11% (>.99) | −18% (>.99) | −28% (>.99) | −12% (>.99) | −18% (>.99) | −4% (0.96) | ||
| Inferior Parietal | 0% (0.57) | 4% (0.94) | −1% (0.66) | −7% (>.99) | −14% (>.99) | −24% (>.99) | −8% (>.99) | −15% (>.99) | 0% (0.57) | ||
| Superior Parietal | 1% (0.60) | 5% (0.97) | 1% (0.66) | −6% (>.99) | −13% (>.99) | −23% (>.99) | −7% (>.99) | −14% (>.99) | 1% (0.60) | ||
| Lateral Temporal | 7% (>.99) | 11% (>.99) | 7% (>.99) | 6% (>.99) | −7% (>.99) | −17% (>.99) | −1% (0.65) | −8% (>.99) | 7% (>.99) | ||
| Fusiform | 14% (>.99) | 18% (>.99) | 14% (>.99) | 13% (>.99) | 7% (>.99) | −10% (>.99) | 6% (0.99) | 0% (0.56) | 14% (>.99) | ||
| Medial Temporal | 24% (>.99) | 28% (>.99) | 24% (>.99) | 23% (>.99) | 17% (>.99) | 10% (>.99) | 16% (>.99) | 10% (>.99) | 24% (>.99) | ||
| Lateral Occipital | 8% (>.99) | 12% (>.99) | 8% (>.99) | 7% (>.99) | 1% (0.65) | −6% (0.99) | −16% (>.99) | −7% (>.99) | 8% (>.99) | ||
| Medial Occipital | 14% (>.99) | 18% (>.99) | 15% (>.99) | 14% (>.99) | 8% (>.99) | 0% (0.56) | −10% (>.99) | 7% (>.99) | 14% (>.99) | ||
| Lateral Frontal | 4% (0.93) | 8% (>.99) | 4% (0.95) | 3% (0.89) | −3% (0.88) | −10% (>.99) | −20% (>.99) | −4% (0.94) | −11% (>.99) | 4% (0.93) | |
| volume | Precuneus | 2% (0.76) | 2% (0.76) | 0% (0.55) | 1% (0.70) | 4% (0.97) | 6% (>.99) | 4% (0.95) | 9% (>.99) | ||
| Posterior Cingulum | −2% (0.76) | 0% (0.50) | −1% (0.72) | 0% (0.57) | 3% (0.88) | 4% (0.97) | 2% (0.84) | 7% (>.99) | −2% (0.76) | ||
| Inferior Parietal | −2% (0.76) | 0% (0.50) | −1% (0.72) | 0% (0.57) | 3% (0.88) | 4% (0.97) | 2% (0.85) | 7% (>.99) | −2% (0.76) | ||
| Superior Parietal | 0% (0.55) | 1% (0.72) | 1% (0.72) | 1% (0.66) | 4% (0.96) | 6% (>.99) | 4% (0.94) | 8% (>.99) | 0% (0.55) | ||
| Lateral Temporal | −1% (0.70) | 0% (0.57) | 0% (0.57) | −1% (0.66) | 3% (0.91) | 5% (0.98) | 3% (0.88) | 8% (>.99) | −1% (0.70) | ||
| Fusiform | −4% (0.97) | −3% (0.88) | −3% (0.88) | −4% (0.96) | −3% (0.91) | 2% (0.75) | 0% (0.57) | 4% (0.98) | −4% (0.97) | ||
| Medial Temporal | −6% (>.99) | −4% (0.97) | −4% (0.97) | −6% (>.99) | −5% (0.98) | −2% (0.75) | −2% (0.80) | 3% (0.91) | −6% (>.99) | ||
| Lateral Occipital | −4% (0.95) | −2% (0.84) | −2% (0.85) | −4% (0.94) | −3% (0.88) | 0% (0.57) | 2% (0.80) | 5% (0.99) | −4% (0.95) | ||
| Medial Occipital | −9% (>.99) | −7% (>.99) | −7% (>.99) | −8% (>.99) | −8% (>.99) | −4% (0.98) | −3% (0.91) | −5% (0.99) | −9% (>.99) | ||
| Lateral Frontal | −7% (>.99) | −5% (0.99) | −5% (0.99) | −6% (>.99) | −5% (>.99) | −2% (0.86) | −1% (0.65) | −3% (0.89) | 2% (0.83) | −7% (>.99) | |
| Aβ | Precuneus | 0% (0.51) | 0% (0.50) | 0% (0.54) | 0% (0.54) | 0% (0.53) | 0% (0.52) | 0% (0.52) | 0% (0.61) | ||
| Posterior Cingulum | 0% (0.51) | 0% (0.51) | 0% (0.53) | 0% (0.52) | 0% (0.52) | 0% (0.54) | 0% (0.53) | 0% (0.60) | 0% (0.51) | ||
| Inferior Parietal | 0% (0.50) | 0% (0.51) | 0% (0.54) | 0% (0.54) | 0% (0.53) | 0% (0.52) | 0% (0.51) | 0% (0.61) | 0% (0.50) | ||
| Superior Parietal | 0% (0.54) | 0% (0.53) | 0% (0.54) | 0% (0.50) | 0% (0.50) | 0% (0.56) | 0% (0.56) | 0% (0.57) | 0% (0.54) | ||
| Lateral Temporal | 0% (0.54) | 0% (0.52) | 0% (0.54) | 0% (0.50) | 0% (0.50) | 0% (0.56) | 0% (0.55) | 0% (0.58) | 0% (0.54) | ||
| Fusiform | 0% (0.53) | 0% (0.52) | 0% (0.53) | 0% (0.50) | 0% (0.50) | 0% (0.56) | 0% (0.55) | 0% (0.58) | 0% (0.53) | ||
| Medial Temporal | 0% (0.52) | 0% (0.54) | 0% (0.52) | 0% (0.56) | 0% (0.56) | 0% (0.56) | 0% (0.51) | 0% (0.63) | 0% (0.52) | ||
| Lateral Occipital | 0% (0.52) | 0% (0.53) | 0% (0.51) | 0% (0.56) | 0% (0.55) | 0% (0.55) | 0% (0.51) | 0% (0.63) | 0% (0.52) | ||
| Medial Occipital | 0% (0.61) | 0% (0.60) | 0% (0.61) | 0% (0.57) | 0% (0.58) | 0% (0.58) | 0% (0.63) | 0% (0.63) | 0% (0.61) | ||
| Lateral Frontal | 0% (0.55) | 0% (0.54) | 0% (0.55) | 0% (0.51) | 0% (0.52) | 0% (0.52) | 0% (0.58) | 0% (0.57) | 0% (0.56) | 0% (0.55) | |
When comparing age effects across modalities, age effects in tau-PET were greater than MRI- volume and Aβ-PET (Figure 3), except in medial temporal lobe where none of the modalities showed age associations (Figure 2). There was little evidence for a difference in age associations of MRI-volume and Aβ-PET other than moderate evidence of a difference (probability=0.92) in the medial occipital region (Figure 3). When comparing modalities, the sign of volume age effects was corrected so that decreasing volume was accurately compared to an increase in protein uptake.
Figure 3: Comparisons of regional decade-age associations between modality pairs.
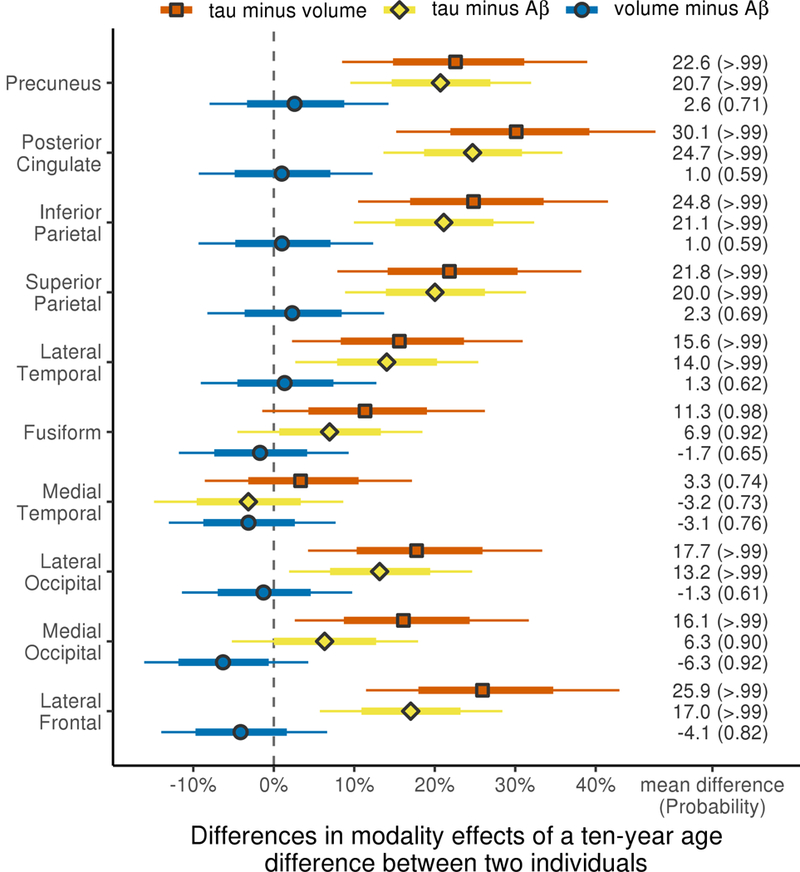
Decade-age effect estimates are shown as mean percentage difference in age-at-presentation associations between modality pairs (i.e. tau SUVR vs. MRI-volume, tau SUVR vs. Aβ SUVR and MRI-volume vs. Aβ SUVR) within region with posterior probabilities that the age association is higher or lower in each modality comparison. Thick and thin bars again represent 80% and 98% posterior confidence intervals, similar to figure 1.
3.3. Age associations in IvPPA and PCA
Both lvPPA and PCA showed clear evidence of negative associations between age and tau-PET uptake across all ROIs, except for medial temporal lobe (Figure 4). However, there was evidence that the age associations were stronger in PCA than lvPPA in precuneus (30% versus 17%) and posterior cingulate (34% versus 21%). Similarly, although age effects on MRI tracked well between lvPPA and PCA, PCA showed a stronger precuneus age effect than lvPPA (8.5% versus 2.3%), with only weak evidence of a precuneus age effect in lvPPA. There was clear evidence of an association between age and volume of both inferior and superior parietal ROIs in lvPPA with age effect sizes of roughly 6%, with weaker evidence of age effects in PCA with age effect sizes of only 1% and 4%, respectively. A negative age effect of ~5% was observed in medial occipital volume in PCA, whereby younger age was associated with larger volumes. No differential age effects across diagnoses in Aβ were found in any ROIs.
Figure 4: Decade-age associations with tau SUVR, MRI-volume and Aβ SUVR in the ten regions-of- interest considered separately in PCA and lvPPA.
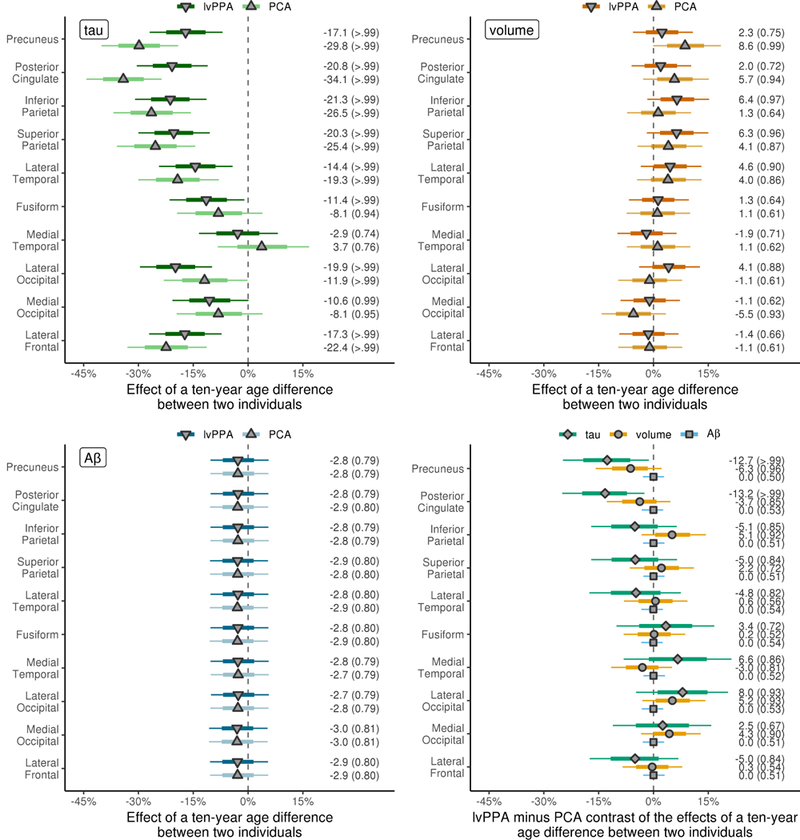
Syndrome specific decade-age effect estimates are shown as median percentage difference in imaging measure between patients with a ten year difference in age-at-presentation. The posterior probabilities of a nonzero decade-age associations in each region for each modality are shown in brackets. The bottom right plot shows a direct comparison of PCA and lvPPA for each modality, with mean percentage difference in age associations between syndromes shown along with the posterior probabilities that the age associations differ between syndromes. Thick and thin bars again represent 80% and 98% posterior confidence intervals, similar to figure 1.
3.4. Age associations with clinical outcomes
There was no evidence for an association between age and performance on MoCA (p=0.28), CDR-SB (p=0.66), letter fluency (p=0.57), animal fluency (p=0.15), WMS III VR% (p=0.81), BNT (p=0.65), WAB apraxia (p=0.56), VOSP letters (p=0.25) or Rey-O (p=0.22) across cohort. Performance on BDAE repetition showed a potential relationship with age (p=0.04), with poorer performance observed in younger participants.
4. Discussion
The findings from this study suggest that age plays a strong role in determining the degree of cortical tau uptake in atypical AD, with younger participants more likely to show widespread and severe cortical tau uptake compared to older participants. Age showed a stronger relationship to tau uptake compared to atrophy on MRI and Aβ deposition, and no relationships between age and cognitive decline were found.
The association between younger age and greater tau uptake on PET was observed across all cortical regions, but was significantly stronger in medial and lateral parietal regions. This pattern was observed in lvPPA and PCA showing that this regional pattern was not driven by the specific atypical AD syndrome. It, therefore, appears as though tau uptake in the parietal lobe is particularly age related in atypical AD. Studies that have assessed the relationship between age and tau uptake in participants with typical AD have similarly found age associations in cortical regions, with one study implicating frontal and inferior parietal lobes[10], and another medial and lateral parietal and occipital lobes[9], suggesting some similarity between atypical and typicalAD. Tau uptake in the medial temporal lobe did not vary with age perhaps suggesting that these regions show either high uptake or little uptake across the cohort, and hence show little variation with age. Medial temporal regions do show elevated tau uptake in atypical AD[23], but they are less involved than cortex[7] suggesting that the later explanation is most likely.
The fact that we observed greater tau uptake with younger age in atypical AD strongly suggests that younger patients have a more aggressive disease course, and hence accumulate tau at a faster rate. Indeed, rates of brain loss have been shown to be greater in younger typical AD patients[42]. The reason that the cortex, particularly parietal lobes, shows more aggressive tau accumulation in younger patients is unclear. If the theory that disease proteins spread through functional networks[43] is correct, then one explanation for our findings could be that proteins are better able to spread through more healthy networks present in younger adults[44]. An alternative explanation for the findings, however, could be that younger patients may have greater brain reserve, and hence can tolerate a larger tau burden before being impaired enough to see a neurologist. This latter explanation would lead us to assume that the older patients would eventually develop as much cortical tau deposition as the younger patients; a hypothesis that would need to be tested using longitudinal data. The fact that we did not observe any striking relationship between cognition and age in atypical AD, despite differences in degree of cortical tau uptake and atrophy, may support this view. We also cannot rule out the possibility of some selection bias whereby older patients with severe tau uptake may be too severe to enter a research study due to poorer cognitive reserve.
We also observed relationships between age and volume, with younger age associated with more atrophy in parietal and lateral temporal regions, although effect sizes were smaller compared to the associations between age and tau, and there was also more evidence that regional age associations with volume differed by atypical AD syndrome. In PCA, the strongest positive associations with age were observed in precuneus and posterior cingulate, whereas in lvPPA the strongest positive associations were observed in inferior and superior parietal lobe, although these differences were relatively modest. One previous study assessed the influence of age at onset on atrophy in PCA, and similarly found that younger participants had thinner cortex in the precuneus and parietal lobe[45]. The fact that age showed much weaker associations with atrophy compared to tau uptake provides evidence that age is indeed playing a large role on the underlying tau pathology of the disease, with MRI proving a weaker surrogate of the disease process. This may speak to the specificity of tau PET imaging relative to MRI since the latter is a nonspecific biomarker affected by many aspects of ageing. An additional, unexpected finding was that volume of the medial occipital lobe showed a negative association with age, i.e. smaller volumes with older age, in PCA. This was in contrast to the tau-PET results where this region showed greater tau uptake in younger subjects. The reason for this discrepancy is unclear, although it may suggest that other non-tau age-related comorbidities or pathologies may be influencing volume in this region. A previous study suggested that this region has unique metabolic, connectional, and vascular features that may confer enhanced vulnerability to neurodegeneration[46].
In contrast to tau, it was clear that age showed no important relationship with Aβ uptake. In particular, there was almost no evidence of older age being associated with greater Aβ uptake, as one observes in cognitively normal participants[47]. This discordance is likely because Aβ is related to disease in our participants, but this may not be the case in cognitively normal cohorts where it often reflects an aging phenomenon. Since Aβ deposition occurs very early in the disease process and likely eventually plateaus[48] it is perhaps unsurprising that there is not a direct relationship between age and Aβ. A potential limitation was that our analysis was restricted to patients with evidence of Aβ uptake on PET, i.e. patients that had biomarker evidence for AD, and hence this would have reduced the range of Aβ SUVRs for the analysis.
We did not perform extensive modelling of cognitive test performance but generally did not find evidence that younger age was associated with poorer cognitive performance. Only sentence repetition showed a tentative positive relationship with age and singling out this result may be over-interpreting the data. However, we previously demonstrated that sentence repetition is associated with tau uptake in parietal lobes in atypical AD[23] fitting with the age associations we observed in this study. One previous study also found poorer performance on tasks involving phonological short term memory and parietal lobe function in younger PCA patients[45]. One explanation for the lack of associations between age and cognition is that cognitive decline likely follows neurodegeneration, which in turn follows the deposition of tau; so the clinical measures are even further removed from the primary pathological process which shows the strongest relationship to age. Older age would also worsen cognitive performance, an effect which may balance out any associations in the opposite direction, particularly for tests which are not age-corrected. A limitation of our analysis was that the relationships between age and clinical outcomes were assessed using simple linear regressions, rather than a Bayesian model. This was due to both not having a clear hierarchical data structure (e.g., regions within modality) and the difficulty of standardizing outcomes across clinical measures. Furthermore, not all patients had complete cognitive testing allowing them to be included in these analyses, hence our power was reduced and we may have excluded the most cognitively severe patients. Our cohort also had at least moderate cognitive impairment, as evidenced by a median MoCA score of 18, and hence we may have lacked range to detect age effects.
A strength of this study was that we used a single Bayesian hierarchical linear model to provide a comprehensive profile of age associations across ten regions in three modalities and two syndromes simultaneously, elegantly addressing the problem of multiple comparisons. A limitation was that the cohort was predominantly female. While we have no reason to believe that age would differentially influence atrophy and tau uptake by sex, the results may not generalize to cohorts with different sex ratios. The PCA and lvPPA groups had a similar median age at scan, although the PCA participants had a longer disease duration and worse functional severity. These differences could explain why the lvPPA participants did not perform worse on tests of naming and repetition compared to PCA. White matter hyperintensities were observed in both groups, although with a slightly higher burden observed in PCA. However, white matter hyperintensity burden was lower than is observed in typialAD, and was similar to the burden reported in healthy controls[49].
The results from this study show that age plays a critical role in the pathophysiology of atypical AD and should be considered in any studies assessing neuroimaging outcomes, including clinical treatment trials. Tau status at entry to a clinical treatment trial may be just as important as Aβ status, since if the trial includes younger ages they may be including people that already have a high tau burden even if they are mildly affected clinically. Our results show that age is a particularly strong determinant of tau pathology in the cortex and future studies will be needed to determine the mechanism underlying this association. Although our study was cross-sectional in design, the suggestion that younger patients exhibit a more aggressive disease will be important to help educate patients and longitudinal studies will be needed to determine whether these patients also show worse prognosis.
Supplementary Material
Highlights
Younger age is associated with more severe cortical tau uptake in atypical AD
Age shows a stronger relationship to tau uptake than volume or beta-amyloid uptake
Posterior cortical atrophy and logopenic aphasia show similar age associations
Age is an important determinant of pathophysiology in atypical AD
Research in context
Systematic review:
The authors reviewed the literature using PubMed and search term “age” as well as disease (“Alzheimer”, “posterior cortical atrophy”, “logopenic”) and neuroimaging search terms (“MRI”, “PET”). One study has shown that age influences atrophy in a clinical variant of atypical Alzheimer’s disease (AD), but no publications have assessed the effect of age on both atrophy and protein deposition in atypical AD.
Interpretation:
Our findings show that age plays a critical role in the pathophysiology of atypical AD, particularly in severity of tau uptake on PET, with younger patients showing worse neuroimaging outcomes. Age should be considered in studies and treatment trials assessing neuroimaging outcomes.
Future directions:
Serial data is needed to determine whether younger atypical AD patients show a more aggressive longitudinal decline on neuroimaging outcomes or worse future prognosis than older patients.
5. Acknowledgements
This study was supported by the National Institutes of Health [R01-AG50603 (PI Whitwell) and R21- NS94684 (PI Josephs)]. We would like to acknowledge AVID Radiopharmaceuticals for provision of AV-1451 precursor, chemistry production advice and oversight, and FDA regulatory cross-filing permission and documentation needed for this work.
The sponsor played no role in study design, in the collection, analysis and interpretation of data; in the writing of the report; or in the decision to submit the article for publication.
Footnotes
Publisher's Disclaimer: This is a PDF file of an unedited manuscript that has been accepted for publication. As a service to our customers we are providing this early version of the manuscript. The manuscript will undergo copyediting, typesetting, and review of the resulting proof before it is published in its final citable form. Please note that during the production process errors may be discovered which could affect the content, and all legal disclaimers that apply to the journal pertain.
References
- [1].Oh H, Madison C, Villeneuve S, Markley C, Jagust WJ. Association of gray matter atrophy with age, beta-amyloid, and cognition in aging. Cereb Cortex. 2014;24:1609–18. [DOI] [PMC free article] [PubMed] [Google Scholar]
- [2].Dickerson BC, Brickhouse M, McGinnis S, Wolk DA. Alzheimer’s disease: The influence of age on clinical heterogeneity through the human brain connectome. Alzheimers Dement (Amst). 2017;6:122–35. [DOI] [PMC free article] [PubMed] [Google Scholar]
- [3].Frisoni GB, Testa C, Sabattoli F, Beltramello A, Soininen H, Laakso MP. Structural correlates of early and late onset Alzheimer’s disease: voxel based morphometric study. J Neurol Neurosurg Psychiatry. 2005;76:112–4. [DOI] [PMC free article] [PubMed] [Google Scholar]
- [4].Ishii K, Kawachi T, Sasaki H, Kono AK, Fukuda T, Kojima Y, et al. Voxel-based morphometric comparison between early- and late-onset mild Alzheimer’s disease and assessment of diagnostic performance of z score images. AJNR Am J Neuroradiol. 2005;26:333–40. [PMC free article] [PubMed] [Google Scholar]
- [5].Moller C, Vrenken H, Jiskoot L, Versteeg A, Barkhof F, Scheltens P, et al. Different patterns of gray matter atrophy in early- and late-onset Alzheimer’s disease. Neurobiol Aging. 2013;34:2014–22. [DOI] [PubMed] [Google Scholar]
- [6].Murray ME, Graff-Radford NR, Ross OA, Petersen RC, Duara R, Dickson DW. Neuropathologically defined subtypes of Alzheimer’s disease with distinct clinical characteristics: a retrospective study. Lancet Neurol. 2011;10:785–96. [DOI] [PMC free article] [PubMed] [Google Scholar]
- [7].Whitwell JL, Graff-Radford J, Tosakulwong N, Weigand SD, Machulda M, Senjem ML, et al. [(18) F]AV- 1451 clustering of entorhinal and cortical uptake in Alzheimer’s disease. Ann Neurol. 2018;83:248–57. [DOI] [PMC free article] [PubMed] [Google Scholar]
- [8].Lowe VJ, Wiste HJ, Senjem ML, Weigand SD, Therneau TM, Boeve BF, et al. Widespread brain tau and its association with ageing, Braak stage and Alzheimer’s dementia. Brain. 2018;141:271–87. [DOI] [PMC free article] [PubMed] [Google Scholar]
- [9].Cho H, Choi JY, Lee SH, Lee JH, Choi YC, Ryu YH, et al. Excessive tau accumulation in the parieto-occipital cortex characterizes early-onset Alzheimer’s disease. Neurobiol Aging. 2017;53:103–11. [DOI] [PubMed] [Google Scholar]
- [10].Scholl M, Ossenkoppele R, Strandberg O, Palmqvist S, Swedish Bio Fs, Jogi J, et al. Distinct 18F-AV- 1451 tau PET retention patterns in early- and late-onset Alzheimer’s disease. Brain. 2017;140:2286–94. [DOI] [PubMed] [Google Scholar]
- [11].Gerritsen AA, Bakker C, Verhey FR, de Vugt ME, Melis RJ, Koopmans RT, et al. Prevalence of Comorbidity in Patients With Young-Onset Alzheimer Disease Compared With Late-Onset: A Comparative Cohort Study. J Am Med Dir Assoc. 2016;17:318–23. [DOI] [PubMed] [Google Scholar]
- [12].Vemuri P, Lesnick TG, Przybelski SA, Knopman DS, Lowe VJ, Graff-Radford J, et al. Age, vascular health, and Alzheimer disease biomarkers in an elderly sample. Ann Neurol. 2017;82:706–18. [DOI] [PMC free article] [PubMed] [Google Scholar]
- [13].Josephs KA, Dickson DW, Tosakulwong N, Weigand SD, Murray ME, Petrucelli L, et al. Rates of hippocampal atrophy and presence of post-mortem TDP-43 in patients with Alzheimer’s disease: a longitudinal retrospective study. Lancet Neurol. 2017;16:917–24. [DOI] [PMC free article] [PubMed] [Google Scholar]
- [14].Josephs KA, Whitwell JL, Weigand SD, Murray ME, Tosakulwong N, Liesinger AM, et al. TDP-43 is a key player in the clinical features associated with Alzheimer’s disease. Acta Neuropathol. 2014;127:811–24. [DOI] [PMC free article] [PubMed] [Google Scholar]
- [15].Fiford CM, Manning EN, Bartlett JW, Cash DM, Malone IB, Ridgway GR, et al. White matter hyperintensities are associated with disproportionate progressive hippocampal atrophy. Hippocampus. 2017;27:249–62. [DOI] [PMC free article] [PubMed] [Google Scholar]
- [16].Whitwell JL, Kantarci K, Weigand SD, Lundt ES, Gunter JL, Duffy JR, et al. Microbleeds in atypical presentations of Alzheimer’s disease: a comparison to dementia of the Alzheimer’s type. J Alzheimers Dis. 2015;45:1109–17. [DOI] [PMC free article] [PubMed] [Google Scholar]
- [17].Sahoo A, Murray ME, Tosakulwong N, Whitwell JL, Weigand SD, Serie AM, et al. TDP-43 in non- amnestic Alzheimer’s Dementia. Journal of Alzheimer’s Disease. [DOI] [PMC free article] [PubMed] [Google Scholar]
- [18].Crutch SJ, Schott JM, Rabinovici GD, Murray M, Snowden JS, van der Flier WM, et al. Consensus classification of posterior cortical atrophy. Alzheimers Dement. 2017;13:870–84. [DOI] [PMC free article] [PubMed] [Google Scholar]
- [19].Tang-Wai DF, Graff-Radford N, Boeve BF, Dickson DW, Parisi JE, Crook R, et al. Clinical, genetic, and neuropathologic characteristics of posterior cortical atrophy. Neurology. 2004;63:1168–74. [DOI] [PubMed] [Google Scholar]
- [20].Gorno-Tempini ML, Hillis AE, Weintraub S, Kertesz A, Mendez M, Cappa SF, et al. Classification of primary progressive aphasia and its variants. Neurology. 2011;76:1006–14. [DOI] [PMC free article] [PubMed] [Google Scholar]
- [21].Nasrallah IM, Chen YJ, Hsieh MK, Phillips JS, Ternes K, Stockbower GE, et al. (18)F-Flortaucipir PET/MRI Correlations in Nonamnestic and Amnestic Variants of Alzheimer Disease. J Nucl Med. 2018;59:299–306. [DOI] [PMC free article] [PubMed] [Google Scholar]
- [22].Ossenkoppele R, Schonhaut DR, Scholl M, Lockhart SN, Ayakta N, Baker SL, et al. Tau PET patterns mirror clinical and neuroanatomical variability in Alzheimer’s disease. Brain. 2016;139:1551–67. [DOI] [PMC free article] [PubMed] [Google Scholar]
- [23].Tetzloff KA, Graff-Radford J, Martin PR, Tosakulwong N, Machulda MM, Duffy JR, et al. Regional Distribution, Asymmetry, and Clinical Correlates of Tau Uptake on [18F]AV-1451 PET in Atypical Alzheimer’s Disease. J Alzheimers Dis. 2018;62:1713–24. [DOI] [PMC free article] [PubMed] [Google Scholar]
- [24].Madhavan A, Whitwell JL, Weigand SD, Duffy JR, Strand EA, Machulda MM, et al. FDG PET and MRI in Logopenic Primary Progressive Aphasia versus Dementia of the Alzheimer’s Type. PLoS One. 2013;8:e62471. [DOI] [PMC free article] [PubMed] [Google Scholar]
- [25].Whitwell JL, Jack CR Jr, Kantarci K, Weigand SD, Boeve BF, Knopman DS, et al. Imaging correlates of posterior cortical atrophy. Neurobiol Aging. 2007;28:1051–61. [DOI] [PMC free article] [PubMed] [Google Scholar]
- [26].McKhann GM, Knopman DS, Chertkow H, Hyman BT, Jack CR Jr., Kawas CH, et al. The diagnosis of dementia due to Alzheimer’s disease: recommendations from the National Institute on Aging- Alzheimer’s Association workgroups on diagnostic guidelines for Alzheimer’s disease. Alzheimers Dement. 2011;7:263–9. [DOI] [PMC free article] [PubMed] [Google Scholar]
- [27].Nasreddine ZS, Phillips NA, Bedirian V, Charbonneau S, Whitehead V, Collin I, et al. The Montreal Cognitive Assessment, MoCA: a brief screening tool for mild cognitive impairment. Journal of the American Geriatrics Society. 2005;53:695–9. [DOI] [PubMed] [Google Scholar]
- [28].Hughes CP, Berg L, Danziger WL, Coben LA, Martin RL. A new clinical scale for the staging of dementia. Br J Psychiatry. 1982;140:566–72. [DOI] [PubMed] [Google Scholar]
- [29].Lansing AE, Ivnik RJ, Cullum CM, Randolph C. An empirically derived short form of the Boston naming test. Archives of Clinical Neuropsychology. 1999;14:481–7. [PubMed] [Google Scholar]
- [30].Goodglass H, Barresi B. Boston diagnostic aphasia examination: Short form record booklet: Lippincott Williams & Wilkins; 2000. [Google Scholar]
- [31].Kertesz A Western Aphasia Battery (Revised). San Antonio, Tx: PsychCorp; 2007. [Google Scholar]
- [32].Warrington EK, James M. The visual object and space perception battery: Thames Valley Test Company Bury St Edmunds; 1991. [Google Scholar]
- [33].Osterrieth PA . Le test de copie d’une figure complexe. Arch Psychol. 1944;30:206–356. [Google Scholar]
- [34].Wechsler D Wechsler adult intelligence scale-Fourth Edition (WAIS-IV). San Antonio, TX: NCS Pearson; 2008;22:498. [Google Scholar]
- [35].Jack CR Jr., Lowe VJ, Senjem ML, Weigand SD, Kemp BJ, Shiung MM, et al. 11C PiB and structural MRI provide complementary information in imaging of Alzheimer’s disease and amnestic mild cognitive impairment. Brain. 2008;131:665–80. [DOI] [PMC free article] [PubMed] [Google Scholar]
- [36].Jack CR Jr., Wiste HJ, Weigand SD, Therneau TM, Lowe VJ, Knopman DS, et al. Defining imaging biomarker cut points for brain aging and Alzheimer’s disease. Alzheimers Dement. 2017;13:205–16. [DOI] [PMC free article] [PubMed] [Google Scholar]
- [37].Raz L, Jayachandran M, Tosakulwong N, Lesnick TG, Wille SM, Murphy MC, et al. Thrombogenic microvesicles and white matter hyperintensities in postmenopausal women. Neurology. 2013;80:911–8. [DOI] [PMC free article] [PubMed] [Google Scholar]
- [38].Gelman A, Hill J L. Data Analysis Using Regression and Multilevel/Hierarchical Models. Cambridge, UK: Cambridge University Press; 2006. [Google Scholar]
- [39].Greenland S Principles of multilevel modelling. Int J Epidemiol. 2000;29:158–67. [DOI] [PubMed] [Google Scholar]
- [40].R Core team. R: A language and environment for statistcial computing. Austria, Vienna: R Foundation for Statistical Computing; 2017. [Google Scholar]
- [41].Plummer M. JAGS: A program for analysis of Bayesian graphical models using Gibbs sampling. Version 4.3.0. ed2017.
- [42].Fiford CM, Ridgway GR, Cash DM, Modat M, Nicholas J, Manning EN, et al. Patterns of progressive atrophy vary with age in Alzheimer’s disease patients. Neurobiol Aging. 2018;63:22–32. [DOI] [PMC free article] [PubMed] [Google Scholar]
- [43].Pievani M, de Haan W, Wu T, Seeley WW, Frisoni GB. Functional network disruption in the degenerative dementias. Lancet Neurol. 2011;10:829–43. [DOI] [PMC free article] [PubMed] [Google Scholar]
- [44].Andrews-Hanna JR, Snyder AZ, Vincent JL, Lustig C, Head D, Raichle ME, et al. Disruption of large- scale brain systems in advanced aging. Neuron. 2007;56:924–35. [DOI] [PMC free article] [PubMed] [Google Scholar]
- [45].Suarez-Gonzalez A, Lehmann M, Shakespeare TJ, Yong KXX, Paterson RW, Slattery CF, et al. Effect of age at onset on cortical thickness and cognition in posterior cortical atrophy. Neurobiol Aging. 2016;44:108–13. [DOI] [PMC free article] [PubMed] [Google Scholar]
- [46].McKee AC, Au R, Cabral HJ, Kowall NW, Seshadri S, Kubilus CA, et al. Visual association pathology in preclinical Alzheimer disease. J Neuropathol Exp Neurol. 2006;65:621–30. [DOI] [PubMed] [Google Scholar]
- [47].Roberts RO, Aakre JA, Kremers WK, Vassilaki M, Knopman DS, Mielke MM, et al. Prevalence and Outcomes of Amyloid Positivity Among Persons Without Dementia in a Longitudinal, Population-Based Setting. JAMA Neurol. 2018. [DOI] [PMC free article] [PubMed] [Google Scholar]
- [48].Jack CR, Knopman DS, Jagust WJ, Petersen RC, Weiner MW, Aisen PS, et al. Tracking pathophysiological processes in Alzheimer’s disease: an updated hypothetical model of dynamic biomarkers. Lancet Neurol. 2013;12:207–16. [DOI] [PMC free article] [PubMed] [Google Scholar]
- [49].Sarro L, Tosakulwong N, Schwarz CG, Graff-Radford J, Przybelski SA, Lesnick TG, et al. An investigation of cerebrovascular lesions in dementia with Lewy bodies compared to Alzheimer’s disease. Alzheimers Dement. 2017;13:257–66. [DOI] [PMC free article] [PubMed] [Google Scholar]
Associated Data
This section collects any data citations, data availability statements, or supplementary materials included in this article.