Abstract
Background:
Average life expectancy increases year after year throughout the world. The Mini Nutritional Assessment (MNA) test is one of the most extensively applied tools for identifying the nutritional risks in elderly people. Here, we assess the nutritional status of elderlies accommodated in nursing homes by the MNA-SF test.
Methods:
A cross-sectional study of 773 elderly individuals living in nursing homes was conducted to evaluate their nutritional status, using the mini nutritional assessment questionnaire (MNA-SF), in Turkey.
Results:
In this cross-sectional study, 773 elderly individuals were included. Of these, 404 (52.27%) were men and 369 (47.73%) women. Of all subjects, 8.4% were malnourished, 37% at risk of malnutrition, and 54.6% well nourished. In terms of frequency of subjects at risk of malnutrition (43.6% in women and 30.9% in men) and well-nourished (47.2% in women and 61.4% in men), there was a statistically significant difference between women and men (p<0.001). The results showed that 80% and 58.5% of individuals with malnutrition had a sharp or moderate reduction in food intakes, respectively, and their weight loss was greater than three kg in the last three months. This difference was statistically significant (p<0.001). Regression results indicated that the lower MNA-score was independently associated with higher age (r=-0.2). Moreover, the MNA-score had a significant positive correlation with weight (r=0.42), BMI (r=0.34), MACs (r=0.33) and CCs (r=0.32) (P<0.001).
Conclusion:
This study reveals that nursing home residents are at increased risk of malnutrition, and this problem is associated with weight loss, increased drug use, health status, and decline in physical activity and food intake.
Keywords:nursing home, elderly, malnutrition, MNA–Short Form, Turkey.
INTRODUCTION
Malnutrition is one of the common problems among elderly people, especially institutionalized persons (1, 2). Malnutrition is associated with insufficient nutrition and low quality of life in this age group (3-6). The prevalence of malnutrition is 5–10% in elderly individuals living independently and 30–60% in elderly patients (7-9). Prevalence rates of malnutrition among nursing home residents ranges from 2% up to 74% (1, 10-13). These huge differences could be due to both malnutrition assessment methods and resident characteristics (6).
usually more dependent on health care services than the general population (14). In nursing home residents, early identification of malnutrition risk plays an important role in the successful interventions in elderly people (2). In this view, several tools are available for identifying malnutrition in elderly people (2). Among these methods, the Mini Nutritional Assessment (MNA) has been shown to be probably the best screening tool to detect malnourished and risk of malnutrition (15). The MNA is a rapid nutrition assessment that was developed to assess nutrition status as part of the standard evaluation of elderly patients in clinics, nursing homes and hospitals (16). In 1994, the MNA full form was developed and published; it has eighteen items, including anthropometric measurements, general, dietary and self-assessments (13). The MNA-short form tests (MNA-SFs) have been confirmed to work well for older people from different settings (17-19). The nutritional assessment is essential to identify the risk of malnutrition or malnutrition in elderly individuals to prevent malnutrition-related consequences. The aim of this study was to evaluate the nutritional status of elderly nursing home residents by application of the MNA-SF test.
METHODS
The current cross-sectional study was conducted for assessing the nutritional status of elderly people living in Turkish nursing homes, using the mini nutritional assessment questionnnaire (MNA). The statistical populations were selected by cluster sampling from nursing home residents in Turkey. In this study, 773 elderly people were enrolled. All subjects were made aware of the content of the study and agreed to participate in the study. Residents were over 60 years and have been in the nursing home for at least six months. Also, all subjects were orally feed and were not nourished by tube or syringe feeding, and had no amputations. Participants with advanced dementia and cognitive impairment that made them unable to communicate with ease were excluded. Data were collected using a questionnaire for MNA-short form (MNA-SF).
Many studies reported the validity and reliability of MNA-SF questionnaire (1, 16, 20) consisting of two stages. In the first part (screening step), the maximum screening score is 14 points and based on it, three nutritional categories are defined: normal nutritional status (12–14 points), at risk of malnutrition (8–11 points) and malnutrition (0–7 points) (2). If the score is less than 12, the second part (assessment step) of the MNA should be completed. In the second stage, the difference between women and men (p<0.001). The results showed that 80% and 58.5% of individuals with malnutrition had a sharp or moderate reduction in food intakes, respectively, and their weight loss was greater than three kg in the last three months. This difference was statistically significant (p<0.001). Regression results indicated that the lower MNA-score was independently associated with higher age (r=-0.2). Moreover, the MNA-score had a significant positive correlation with weight (r=0.42), BMI (r=0.34), MACs (r=0.33) and CCs (r=0.32) (P<0.001). Conclusion: This study reveals that nursing home residents are at increased risk of malnutrition, and this problem is associated with weight loss, increased drug use, health status, and decline in physical activity and food intake. Keywords: nursing home, elderly, malnutrition, MNA–Short Form, Turkey. 40 Maedica A Journal of Clinical Medicine, Volume 14, No. 1, 2019 MNA-SF maximum score is 16. The nutrition index was determined based on the total points obtained from the first and second stages. Total assessment scores between 17 and 24 indicated risk of malnutrition, those <17 malnutrition and scores >24 satisfactory nutritional status (16). The study protocol was approved by the Ethics Committee of Cumhuriyet University, Turkey, with 2014-03/15 number.
Statistical analysis
Statistical analysis was performed using SPSS version 20.0 (SPSS for Windows, SPSS Inc., Chicago, IL, USA). All values are presented as mean±standard deviation (SD) for continuous variables or frequency (%) for categorical variables. The frequency of baseline variables including age-groups, BMI, MACs, CCs, MNA score and the health factors as categorical variables were compared using Person’s Chi-square or Fisher`s exact test among males and females or according to the subjects’ nutritional status. The mean values of the MNA score were compared among well-nourished, at risk of malnutrition, and malnourished subjects by one-Way ANOVA analysis. Linear regression analysis was used for assessing the association of independent factors with the total score of Mini Nutritional Assessment Scale. P-values less than 0.05 were considered to be statistically significant.
RESULTS
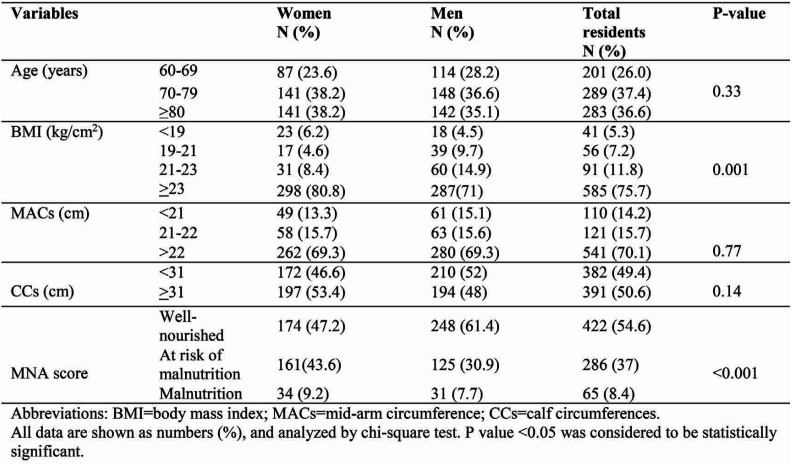
This study was conducted on 773 elderly nursing home residents in Turkey. Of these, 404 (52.27%) were men and 369 (47.73%) women. The age range of participants was between 60 and 101 years. Overall, the mean age was 75.94±7.7 years. The 70-79 age group frequency (37.4%) was higher than other age subgroups. Age, MACs, and CCs between men and women were not statistically significant. Of all subjects, 8.4% were malnourished, 37% at risk of malnutrition and 54.6% well-nourished. According to Bonferroni method, the frequency of subjects who were at risk of malnutrition (43.6% women and 30.9% men) and well-nourished (47.2% women and 61.4% men) had a statistically significant difference between women and men (p<0.001) (Table 1).
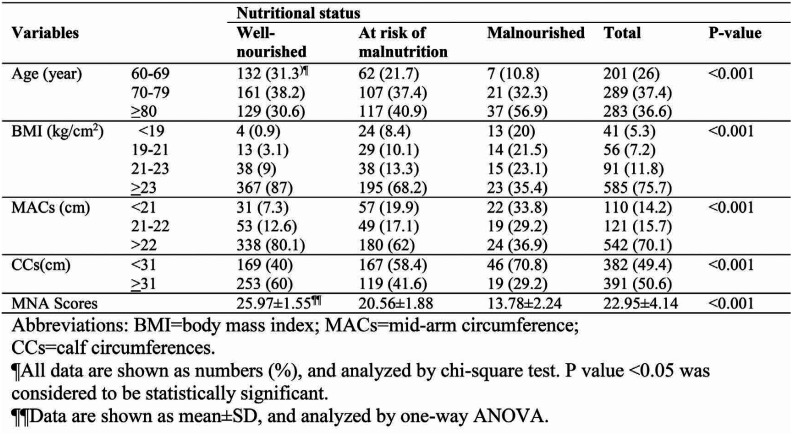
There was a significant difference in the nutritional status according to baseline characteristics. The older subjects had a higher frequency of malnutrition status (89.2% in the age group over 70 compared to 10.8% in the age group under 70). Most of the malnourished subjects (35.4%) had a BMI >23 kg/m2. Malnutrition frequency (36.9%) was more than between subjects with MACs >22cc compared to the other subgroups. The risk of malnutrition and malnourished subjects was higher in CCs >31 cc subgroup (Table 2).
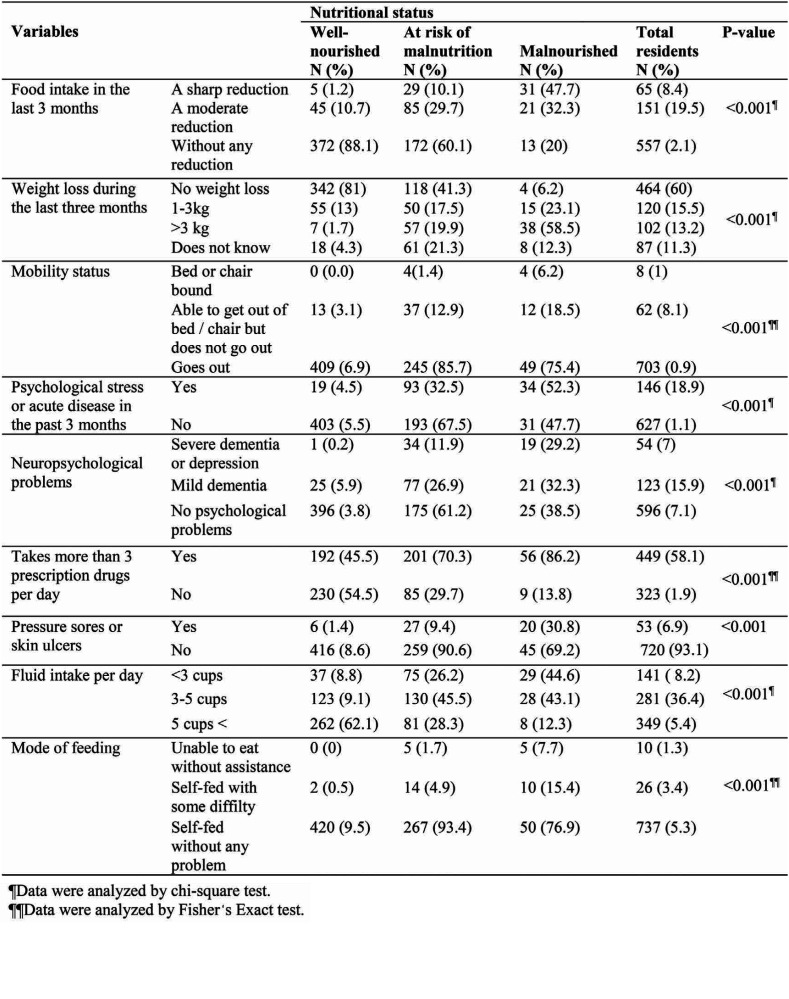
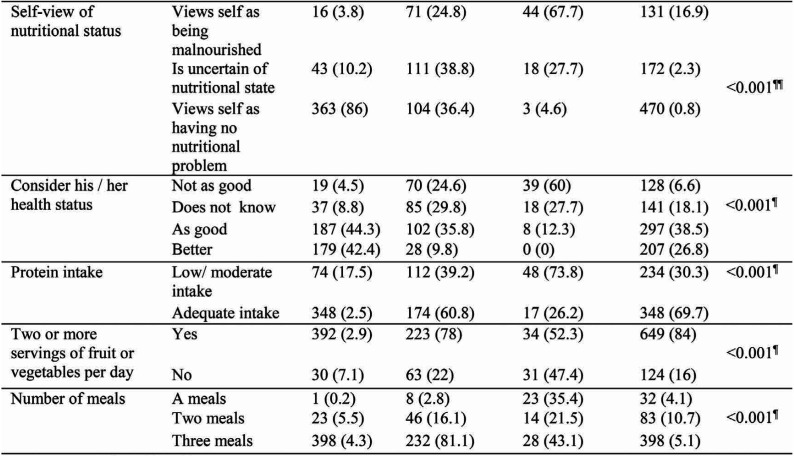
The association between health factors and nutritional status is shown in Table 3. Eighty percent of all subjects with malnutrition had a sharp or moderate reduction in food intake during the last three months, while the well-nourished older people (88.1%) had no reduction and this difference was statistically significant (p<0.001). The weight loss greater than three kilograms within the last three months (58.5%) was significantly higher in the malnutrition group than the well-nourished one (1.7%) (p<0.001). The frequency of psychological stress or acute disease in the past three months was 4.5%, 32.5% and 52.3% among normal, at risk of malnutrition and malnutrition groups, respectively, which was found to be statistically significant (p<0.001). Severe or mild dementia and depression was found in 61.5% of malnutrition subjects but in only 6.1% of normal participants and 38.8% of those at risk of malnutrition, and this difference was significant (p<0.001). Of all malnourished elderly subjects, 86.2% took more than three drugs per day. Subjects whose fluid intake was less than three cups per day were most affected by malnutrition (44.6%). The frequency of unhealthy status was higher in the malnutrition group (60%) than the normal one (4.5%). Subjects with adequate protein intake were fewer in the malnourished elderly compared with the normal group (26.2% vs. 82.5%). The frequency of two or more serving of fruits or vegetables per day was 92.9% in the well-nourished group and 52.3% in the malnutrition one. There was a significant difference in number of meals between the three groups.
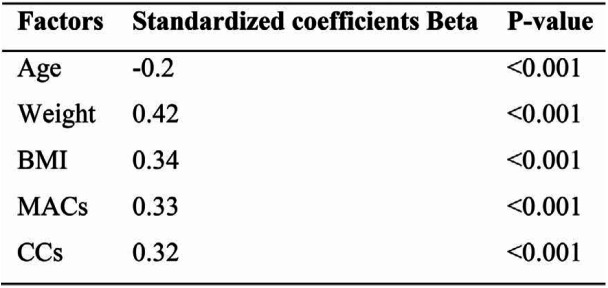
The results of the regression analysis are shown in Table 4. The lower MNA-score was independently associated with higher age (r=-0.2). Moreover, MNA-score had a significant positive TABLE 3. Health factors according to nutritional status Short Form (MNA-SF) in Turkey Continued from previous page Maedica A Journal of Clinical Medicine, Volume 14, No. 1, 2019 43 correlation with weight (r=0.42), BMI (r=0.34), MACs (r=0.33) and CCs (r=0.32) (P<0.001).
DISCUSSION
The present study aimed to estimate the prevalence of the malnutrition and its risk factors among elderly residents of Turkish nursing homes. Our findings showed that 8.4% of participants were malnourished, 37% at risk of malnutrition and 54.6% well nourished. The rate of the malnutrition prevalence in this study was lower than other studies (2-5, 20). Also, we found that the frequency of elderly people at risk of malnutrition was higher than that of those actually malnourished, which is consistent with other previous studies (21, 23). Therefore, early screening and intervention in initial risk populations is needed in order to prevent malnutrition in these groups (10). According to the MNA, 11% to 57% of the elderly people studied by us actually suffered from malnutrition and 40% to 89% were at risk of malnutrition, whereas only 0% to 16% had a good nutritional status (2, 6). This wide range might be partly due to functional impairment, disability, impaired health and different institutional settings (3, 4). It has been recently reported that among nursing home residents, 20% had some form of malnutrition (7). The prevalence of malnutrition among non-institutionalized and independently living elderly is generally low (8, 9). In contrast, high prevalence rates of malnutrition could be expected among nursing home residents because of disability and need for care or help.
The current study showed that malnutrition (9.2%) and risk of malnutrition (43.6%) are significantly more frequent in females, which was also reported by other studies (5, 20-22). This difference may be related to various factors such as health status, food choices, intake of energy and nutrient, depression and other factors that influence nutrition status in females (13). This study indicated that there was a significant difference in the nutritional status of subjects among BMI, MACs and CCs indexes different categories. One study in Taiwan recommended the use of BMI as a long-term predictor of functional decline, while CC was a good indicator of current functional ability in elderly Taiwanese adults .65 years old (6).
However, in practice, BMI may not reflect malnutrition well in elderly people. An elderly patient, despite having a high BMI, may suffer from malnutrition because of inadequate food intake due to an underlying disease such as hip fracture or dementia; otherwise, an individual could be thin with a low BMI but without malnutrition (15). This study showed that all health factors such as weight loss greater than three kilograms, taking more than three prescription drugs per day and low/moderate protein intake were positively associated with malnutrition and risk of malnutrition. Similar results have been reported in the literature (17, 18).
Our study showed that lower MNA-scores were independently associated with higher age. Moreover, MNA-score had a significant positive correlation with weight, BMI, MACs and CCs. Our findings are mostly consistent with other studies (19, 21). The poor nutritional status in aging can be due to reduced mobility and also exposure to various illnesses including hypertension, diabetes mellitus, ischemic heart disease, dementia, dental problems, and eating disorders (22)
CONCLUSIONS
This study revealed that nursing home residents are at an increased risk of malnutrition, and this problem is associated with weight loss; more drug take, health status, and decline in physical activity and food intake. Thus, dietary program and educational programs tailored to elderly people’s needs are necessary to improve the situation.
Conflicts of interest: none declared.
Financial support: none declared.
Acknowledgements: This study was supported by TUBITAK 1001 project “Anthropometric Dimensions of Anatolian Elderly People” No. 115M548.
TABLE 1.
Baseline characteristics according to gender
TABLE 2.
Baseline characteristics according to nutritional status
TABLE 3.
Health factors according to nutritional status
TABLE 3.
Health factors according to nutritional status
TABLE 4.
Linear regression analysis of independent factors associated with the total score of Mini Nutritional Assessment Scale (MNA-score)
Contributor Information
Gülüsan ÖZGÜN BASIBÜYÜK, Akdeniz University, Faculty of Health Sciences, Dept. of Gerontology, Antalya, Turkey.
Parvin AYREMLOU, Clinical Research Development Unit of Imam Khomeini Hospital, Urmia University of Medical Sciences, Urmia, The Islamic Republic of Iran.
Sakineh NOURI S AEIDLOU, Food and Beverages Safety Research Center, Urmia University of Medical Sciences, Urmia, Iran.
Ziynet ÇINAR, Cumhuriyet University Faculty of Medicine, Dept. of Biostatistics, Sivas, Turkey.
Faruk AY, Cumhuriyet University Faculty of Letters, Dept. of Anthropology, Sivas, Turkey.
Yener BEKTAS, Nevþehir Hacý Bektaþ Veli University, Faculty of Arts and Sciences, Dept. of Archaeology, Nevþehir, Turkey.
Gábor Áron VITÁLYOS, Eötvös Loránd University, Faculty of Primary and Pre-School Education, Department of Natural Sciences, Budapest, Hungary.
REFERENCES
- 1.Van Nie-Visser NC, Meijers J, Schols J, Lohrmann C, Bartholomeyczik S, Spreeuwenberg M, et al. Which characteristics of nursing home residents influence differences in malnutrition prevalence? An international comparison of The Netherlands, Germany and Austria. British Journal of Nutrition. 2014;6:1129–1136. doi: 10.1017/S0007114513003541. [DOI] [PubMed] [Google Scholar]
- 2.Afkhami A, Keshavarz SA, Rahimi FA, Jazayeri SAA, Sadrzadeh YH. Nutritional status and associated non-dietary factors in the elderly living in nursing homes of Tehran and Shemiranat, 2004. Payesh. 2008;3:211–217. [Google Scholar]
- 3.Aliabadi M, Kimiagar M, Ghayour-Mobarhan M, Shakeri MT, Nematy M, Ilaty AA, et al. Prevalence of malnutrition in free living elderly people in Iran: a cross-sectional study. Asia Pacific Journal of Clinical Nutrition. 2008;2:285–289. [PubMed] [Google Scholar]
- 4.Nowroozi J, Mirgalili A, Bagheri KP. Study on nutrition status and urinary tract infection in elderly people at nursing home. Iranian Journal of Public Health. 2004;3:36–39. [Google Scholar]
- 5.Saeidlou SN, Merdol TK, Mikaili P, Bekta Y. Assessment of the nutritional status and affecting factors. International Journal of Academic Research. 2011;1:173–181. [Google Scholar]
- 6.Tsai H-J, Chang F-K. Associations between body mass index, mid-arm circumference, calf circumference, and functional ability over time in an elderly Taiwanese population. Plos One. 2017;4:1–11. doi: 10.1371/journal.pone.0175062. [DOI] [PMC free article] [PubMed] [Google Scholar]
- 7.Bell CL, Lee AS, Tamura BK. Malnutrition in the nursing home. Current Opinion in Clinical Nutrition and Metabolic Care. 2015;1:17–23. doi: 10.1097/MCO.0000000000000130. [DOI] [PubMed] [Google Scholar]
- 8.De Groot C, Van Staveren W. Undernutrition in the European SENECA studies. Clinics in Geriatric Medicine. 2002;4:699–708. doi: 10.1016/s0749-0690(02)00043-5. [DOI] [PubMed] [Google Scholar]
- 9.Margetts B, Thompson R, Elia M, Jackson A. Prevalence of risk of undernutrition is associated with poor health status in older people in the UK. European Journal of Clinical Nutrition. 2003;1:69–74. doi: 10.1038/sj.ejcn.1601499. [DOI] [PubMed] [Google Scholar]
- 10.Iizaka S, Tadaka E, Sanada H. Comprehensive assessment of nutritional status and associated factors in the healthy, community-dwelling elderly. Geriatrics and Gerontology International. 2008;1:24–31. doi: 10.1111/j.1447-0594.2008.00443.x. [DOI] [PubMed] [Google Scholar]
- 11.Nazan S, Buket K. Evaluation of nutritional status of elderly patients presenting to the Family Health Center. Pakistan Journal of Medical Sciences. 2018;2:446–451. doi: 10.12669/pjms.342.14936. [DOI] [PMC free article] [PubMed] [Google Scholar]
- 12.Suominen M, Muurinen S, Routasalo P, Soini H, Suur-Uski I, Peiponen A, et al. Malnutrition and associated factors among aged residents in all nursing homes in Helsinki. European Journal of Clinical Nutrition. 2005;4:578–583. doi: 10.1038/sj.ejcn.1602111. [DOI] [PubMed] [Google Scholar]
- 13.Li J, Erdt M, Chen L, Cao Y, Lee S-Q, Theng Y-L. The Social Effects of Exergames on Older Adults: Systematic Review and Metric Analysis. Journal of Medical Internet Research. 2018;6:1–9. doi: 10.2196/10486. [DOI] [PMC free article] [PubMed] [Google Scholar]
- 14.Robb L, Walsh CM, Nel M, Nel A, Odendaal H, van Aardt R. Malnutrition in the elderly residing in long-term care facilities: a cross sectional survey using the Mini Nutritional Assessment (MNA®) screening tool. South African Journal of Clinical Nutrition. 2017;2:34–40. [Google Scholar]
- 15.Vellas B, Guigoz Y, Garry PJ, Nourhashemi F, Bennahum D, Lauque S, et al. The Mini Nutritional Assessment (MNA) and its use in grading the nutritional state of elderly patients. Nutrition. 1999;2:116–122. doi: 10.1016/s0899-9007(98)00171-3. [DOI] [PubMed] [Google Scholar]
- 16.Guigoz Y. The Mini Nutritional Assessment (MNA®) review of the literature-what does it tell us? Journal of Nutrition Health and Aging. 2006;6:466–487. [PubMed] [Google Scholar]
- 17.Soini H, Routasalo P, Lagström H. Characteristics of the Mini-Nutritional Assessment in elderly home-care patients. European Journal of Cinical Nutrition. 2004;1:64–70. doi: 10.1038/sj.ejcn.1601748. [DOI] [PubMed] [Google Scholar]
- 18.Murphy M, Brooks C, New S, Lumbers M. The use of the Mini-Nutritional Assessment (MNA) tool in elderly orthopaedic patients. European Journal of Clinical Nutrition. 2000;7:555–562. doi: 10.1038/sj.ejcn.1601055. [DOI] [PubMed] [Google Scholar]
- 19.Forster S, Gariballa S. Age as a determinant of nutritional status: a cross sectional study. Nutrition Journal. 2005;1:28–33. doi: 10.1186/1475-2891-4-28. [DOI] [PMC free article] [PubMed] [Google Scholar]
- 20.Tannen A, Lohrmann C. Malnutrition in Austrian hospital patients. Prevalence, risk factors, nursing interventions, and quality indicators: a descriptive multicentre study. Journal of Advanced Nursing. 2013;8:1840–1849. doi: 10.1111/jan.12051. [DOI] [PubMed] [Google Scholar]
- 21.Lahiri S, Biswas A, Santra S, Lahiri SK. Assessment of nutritional status among elderly population in a rural area of West Bengal, India. International Journal of Medical Science and Public Health. 2015;4:569–572. [Google Scholar]
- 22.Kabir ZN, Ferdous T, Cederholm T, Khanam MA, Streatfied K, Wahlin Å. Mini Nutritional Assessment of rural elderly people in Bangladesh: the impact of demographic, socio-economic and health factors. Public Health Nutrition. 2006;8:968–974. doi: 10.1017/s1368980006009906. [DOI] [PubMed] [Google Scholar]


