


Abstract
The repertoire of small noncoding RNAs (sncRNAs), particularly miRNAs, in animals is considered to be evolutionarily conserved. Studies on sncRNAs are often largely based on homology-based information, relying on genomic sequence similarity and excluding actual expression data. To obtain information on sncRNA expression (including miRNAs, snoRNAs, YRNAs and tRNAs), we performed low-input-volume next-generation sequencing of 500 pg of RNA from 21 animals at two German zoological gardens. Notably, none of the species under investigation were previously annotated in any miRNA reference database. Sequencing was performed on blood cells as they are amongst the most accessible, stable and abundant sources of the different sncRNA classes. We evaluated and compared the composition and nature of sncRNAs across the different species by computational approaches. While the distribution of sncRNAs in the different RNA classes varied significantly, general evolutionary patterns were maintained. In particular, miRNA sequences and expression were found to be even more conserved than previously assumed. To make the results available for other researchers, all data, including expression profiles at the species and family levels, and different tools for viewing, filtering and searching the data are freely available in the online resource ASRA (Animal sncRNA Atlas) at https://www.ccb.uni-saarland.de/asra/.
INTRODUCTION
Since the establishment of the central dogma of molecular biology by Crick (1), for decades the main role of RNAs was believed to be either in the transfer of information between DNA and proteins (mRNAs) or in housekeeping functions (tRNAs, rRNAs). With the discovery of microRNAs in the early 1990s (2), research on small noncoding RNAs (sncRNAs) and later on long noncoding transcripts (3) gained traction. Moreover, advances in high-throughput sequencing technology that allowed the sequencing of millions to billions of small RNA fragments with reasonable effort and cost (4) led to a further growth in the field. Via sequencing-based approaches, the number of identified sncRNAs, especially of miRNAs, increased markedly in just a few years. While the reference repository miRBase (5) was established in the year 2000 with only 222 miRNAs in five species, the most recent version stores 48 885 miRNAs in 271 species. miRCarta (6), a database that collects mature miRNAs independently of the organism, suggests up to 44 347 miRNA candidates; however, only a fraction of these can be assumed to actually be true miRNAs. Because miRNAs have been described in a variety of organisms, their assumed conservation is frequently used to identify additional miRNAs in related species by homology- and sequence-based approaches (7–11), which often exclude expression profiling. Interestingly, the expression patterns of homologous miRNAs also appear to be comparable between organs in different species, as we successfully showed for human and rat (12).
One of the most commonly performed types of study on sncRNAs is biomarker discovery analysis (13–15). Here, human serum, plasma or blood cells are sequenced, or expression profiling using microarrays or real-time quantitative reverse transcription PCR (RT-qPCR) is performed. Blood cells are especially suitable for this as they contain many hundred to over 1000 human miRNAs (12,16). It has already been demonstrated that the use of standardized protocols for collecting and analysing blood-borne miRNA profiles has huge potential for comparing biomarker profiles across different human pathologies (17,18). Because blood can be obtained in a standardized manner and miRNA expression patterns are technically very stable, it is easy to accurately compare expression between different animal species. In particular, dried blood spots (19) (DBS) or microsampling devices (20) appear to be well suited as containers for miRNAs. While such decentralized collection kits are perfectly suited to collecting samples from different sites, the small amount of RNA that can be purified presents a challenge for further investigations. Previously, analyses based on DBS were mostly limited to microarrays and RT-qPCR, but excluded next-generation sequencing (NGS). However, the application of NGS was mandatory for our study to be able to compare the total sncRNA repertoires amongst different species. Thus, we developed a novel low-input-volume NGS protocol to facilitate sequencing from capillary microsampling devices starting with only 50 pg of RNA (20).
In the present study, we sequenced blood samples of 21 animals collected at two regional German zoos: in Saarbrücken and Neunkirchen. A phylogenetic tree of the animals is presented in Figure 1. The primary data analysis was performed with our tool miRMaster (21). We analysed and compared the read profiles as well as the distribution and composition of small RNAs across species. In addition, an online resource for the collected data was implemented and is freely available at: https://www.ccb.uni-saarland.de/asra/. This resource provides access to all detected sncRNAs, their families and their expression patterns across all species in this study. In summary, the compiled dataset and associated online web server constitute a valuable resource for sncRNA research, either for finding and validating miRNA candidates because of their conservation, or for general research on evolutionary aspects of sncRNAs.
Figure 1.

Circular taxonomy tree based on the species that were sequenced in our study.
MATERIALS AND METHODS
Sample collection
We collected 21 animal samples from regional zoos in Saarbrücken and Neunkirchen (Germany) comprising 19 different species. In addition, we collected four human samples as a reference. All blood samples were collected with the Mitra™ microsampler device (Neoteryx, CA). The samples were collected from remaining blood samples in the context of veterinary examinations. No additional examinations were performed with the animals. The study was permitted by the regional authority, the State Office for Consumer Protection (Landesamt für Verbraucherschutz). Human blood samples were collected from volunteers with informed consent. An overview of the samples in this study with their corresponding taxonomic classification is given in Table 1. Metadata containing the age, gender, as well as the health condition for each specimen are available in Supplementary Table S1.
Table 1.
Overview of the sequenced species ordered by phylogeny, their taxonomic classification, their total generated reads and remaining valid reads after filtering and trimming, as well as the availability of a genome assembly
| Taxid | Species | Superorder | Order | Total reads (Mio) | Valid reads (Mio) | Genome |
|---|---|---|---|---|---|---|
| 9568 | Mandrillus leucophaeus | Euarchontoglires | Primates | 72.65 | 52.19 | ✓ |
| 9606 | Homo sapiens | Euarchontoglires | Primates | 25.45 | 12.14 | ✓ |
| 9606 | Homo sapiens | Euarchontoglires | Primates | 15.46 | 10.02 | ✓ |
| 9606 | Homo sapiens | Euarchontoglires | Primates | 16.98 | 9.87 | ✓ |
| 9606 | Homo sapiens | Euarchontoglires | Primates | 24.50 | 19.26 | ✓ |
| 9493 | Callithrix pygmaea | Euarchontoglires | Primates | 38.80 | 27.76 | ✗ |
| 34829 | Eulemur rubriventer | Euarchontoglires | Primates | 35.50 | 21.09 | ✗ |
| 297387 | Cavia magna | Euarchontoglires | Rodentia | 36.54 | 25.38 | ✗ |
| 273791 | Potamochoerus porcus | Laurasiatheria | Artiodactyla | 32.85 | 24.68 | ✗ |
| 1088130 | Rusa timorensis | Laurasiatheria | Artiodactyla | 37.23 | 25.41 | ✗ |
| 9720 | Phoca vitulina | Laurasiatheria | Carnivora | 24.57 | 16.15 | ✗ |
| 9720 | Phoca vitulina | Laurasiatheria | Carnivora | 23.73 | 14.95 | ✗ |
| 9651 | Nasua nasua | Laurasiatheria | Carnivora | 46.87 | 34.31 | ✗ |
| 9627 | Vulpes vulpes | Laurasiatheria | Carnivora | 29.23 | 20.26 | ✓ |
| 13124 | Lynx | Laurasiatheria | Carnivora | 47.84 | 22.31 | ✗ |
| 13124 | Lynx | Laurasiatheria | Carnivora | 28.72 | 17.23 | ✗ |
| 32536 | Acinonyx jubatus | Laurasiatheria | Carnivora | 30.62 | 20.65 | ✓ |
| 9407 | Rousettus aegyptiacus | Laurasiatheria | Chiroptera | 33.75 | 24.99 | ✓ |
| 9783 | Elephas maximus | Afrotheria | Proboscidea | 97.67 | 63.16 | ✗ |
| 9818 | Orycteropus afer | Afrotheria | Tubulidentata | 36.68 | 26.45 | ✓ |
| 371907 | Bubo scandiacus | Neognathae | Strigiformes | 58.79 | 38.58 | ✗ |
| 126836 | Strix nebulosa | Neognathae | Strigiformes | 37.81 | 27.92 | ✗ |
| 176015 | Aratinga solstitialis | Neognathae | Psittaciformes | 43.77 | 28.29 | ✗ |
| 9240 | Spheniscus humboldti | Neognathae | Sphenisciformes | 72.75 | 53.41 | ✗ |
| 66190 | Astrochelys radiata | Chelonia | Testudines | 25.24 | 17.76 | ✗ |
RNA extraction and sequencing
Animal blood was collected onto Mitra™ collection devices (Neoteryx, CA) and dried at least for 2 h. Small RNAs were extracted by a modified version of the manufacturer’s procedure using the miRNeasy Serum/Plasma Kit (Qiagen, Hilden, Germany). Size distribution and concentration were analysed using Agilent Bioanalyzer small RNA chips (Agilent Technologies, Santa Clara, CA). A total of 500 pg of sRNA with a size range of ∼15–150 nt was subjected to library preparation using a ligation-free procedure involving 3′-polyadenylation and template switch-based cDNA synthesis using the CATS sRNA-seq Kit (Diagenode, Liege, Belgium), omitting any dephosphorylation to enrich 3′-OH. Library size enrichment was carried out using 1.8 vol AMPure XP beads (Beckman Coulter, Krefeld, Germany) to achieve the enrichment of libraries containing RNAs larger than 15–20 nt (library size >160 bp). Libraries were multiplex-sequenced in an Illumina HiSeq 2500 platform in high-output mode with 50 cycles, except for common seal (1), human (3), pygmy marmoset, radiated tortoise and red-bellied lemur that were (re)sequenced with 40 cycles. Lynx (2) was sequenced with 47 cycles.
Bioinformatics
Sample preprocessing
All samples were trimmed and cleaned using miRMaster (21). In detail, we first removed the template switch motif, i.e. the first three bases of the reads. Then, we removed the bases resulting from the polyadenylation process. Therefore, we first checked the reads for adenine homopolymers with at least 13 bases and at most one mismatch and, if no match was found, we relaxed the requirement for an adenine homopolymer with at least five bases and no mismatch starting at position 15 of the read. Finally, we removed sequencing adapter contamination. The quality filtering was performed using default parameters together with a sliding window of four bases and a quality threshold of 20. The resulting reads that were shorter than 17 nt were discarded.
Statistics and visualizations
All statistical tests were computed using the free statistical programming language R (22) (version 3.4.4). If not specified otherwise, reported P-values were adjusted for multiple testing using the Benjamini-Hochberg procedure (23). Cramer’s V was computed using the R package rcompanion (24). Wilcoxon-rank sum test was applied when the data did not follow normal distribution according to Shapiro–Wilk test. Plots were generated using the R packages ggplot2 3.1.0 (25) and pheatmap 1.0.12.
Sample distance estimation and similarity to NCBI phylogenetic tree
We computed Mash sketches for all samples (using Mash 2.0 (26)) with a k-mer size of 17 and a signature size of 1000 and used them to estimate the pairwise sample distances. Reads were subsampled using Seqtk 1.2. We constructed a phylogenetic tree using the neighbour-joining approach (27) implemented in the R-package phangorn (28) and visualized it using the Interactive Tree of Life (29). The similarity to the phylogenetic tree provided by NCBI was computed using the normalized Robinson-Founds distance. To be able to compare both trees, we collapsed the nodes of the same species. We determined the significance of the similarity of both trees by creating 100 000 random trees with 20 leaves, labeled by the analysed species and comparing them with the NCBI tree. We then tested if the resulting distances were smaller than the computed distance and derived from this the P-value.
Rfam
We downloaded all Rfam family sequences from the Rfam FTP server (ftp://ftp.ebi.ac.uk/pub/databases/Rfam, version 13, accessed on 27/3/2018). Then, we determined that sequences were related to Metazoa by performing an SQL query against the Rfam database, and selected them accordingly. To this end, we used the following SQL query:
SELECT fr.rfam_acc, fr.rfamseq_acc,
fr.seq_start, fr.seq_end, f.type
FROM full_region fr, rfamseq rf,
taxonomy tx, family f
WHERE rf.ncbi_id = tx.ncbi_id
AND f.rfam_acc = fr.rfam_acc
AND fr.rfamseq_acc = rf.rfamseq_acc
AND tx.tax_string LIKE '
AND is_significant = 1
Next, we mapped all samples against the Metazoa Rfam sequences using RazerS 3 (30), while requiring at least 95% identity and allowing only forward mappings. We determined the RNA composition based on the RNA class annotations of each family. If a read mapped to multiple classes, it was counted in full for each.
miRNA homology determination
We collected the miRNA sequences of miRBase v22, miRCarta v1.0 and MirGeneDB 2.0 via their respective websites (accessed on 18 July 2018). To determine the expression of each miRNA, we mapped the samples against the databases with Bowtie (31) (version 1.1.2), while allowing no mismatches and disabling mapping against the reverse complement, using the following command:
bowtie -f -v 0 -a --fullref --norc
-S <reference_mirnas_idx> <sample.fa>
To ensure that each read corresponds to a real miRNA, we discarded all reads with lengths different from those of their mapped miRNA. A miRNA was considered to be expressed in a species if it was present in at least one of its samples.
miRNA expression and potential precursor determination
MiRNAs found in any of the three considered databases were first clustered according to 90% sequence similarity using vsearch 2.7.1 (32), thereby merging potential isoforms into one cluster. The RPM normalized counts for each cluster were determined by summing up the expression of each miRNA contained in it. MiRNA arms were determined according to their annotation in the databases. Potential precursors were determined for the miRNAs by considering all combinations of 5′ and 3′ miRNAs of precursors of the same precursor family for MirGeneDB, with the same base name for miRBase and according to the exact annotations in miRCarta. MiRNAs that could not be assigned unambiguously to one arm were discarded. Using the thereby obtained potential precursors, we could then compute arm ratio differences to investigate arm switches.
MiRNA candidate prediction
MiRNA candidates were predicted using mirnovo (33) (downloaded on 20 July 2018) with the default parameters, except for the brown-nosed coati, for which we had to increase the required minimum number of isoform variants from 1 to 3 because the program was not terminating with lower numbers. Predicted miRNAs were filtered in a first step by only keeping those that did not map with at least 90% identity to any known miRNA. The mapping was performed with RazerS 3 (version 3.5.8). Subsequently, we built a scoring scheme similar to our tool novoMiRank (34). In a first step, we determined the values of the features used by mirnovo for known miRNAs in our dataset. To this end, we restricted the known miRNAs to those contained in the high-confidence set of miRBase v22, as we recently showed that this subset contains by far the largest fraction of true miRNAs (35). The features of mirnovo do depend not only on the miRNAs but also on the samples. It is thus possible that some miRNAs that are more expressed than others bias the feature distribution. To avoid this bias, we took the mean feature values for every miRNA. We then normalized all features to a mean of zero and a variance of once, since they were all on different scales and computed z-scores for all known miRNAs. To avoid too large influences of single features, we restricted the absolute values to 3. We then computed for every predicted miRNA its distance to the distribution of known miRNAs, for every feature, and reported the mean z-score. As filtering threshold we chose the 80th percentile of the z-scores of known miRNAs, corresponding to 0.8 standard deviations above or below the mean of the known miRNAs.
ASRA
In the web resource, we provide a species specificity index (SSI) for miRNAs and for Rfam families that describe the variability of their expression patterns. It is computed analogously to the tissue specificity index used in our miRNA tissue atlas (12). It allows measurement of the specificity of expression of an miRNA/Rfam family over different species. The SSI ranges from 0 to 1, where values closer to 1 represent molecules expressed in a few or only one species (species-specific molecules) and values closer to 0 represent molecules similarly expressed in many species (well-conserved molecules). To this end, the SSI for an miRNA/Rfam family j is calculated as follows:
 |
where N corresponds to the total number of species and xj, i is the RPM expression of the miRNA/Rfam family j in species i normalized by the maximal expression in any species of miRNA/Rfam family j.
RESULTS
Using the Mitra™ system, we collected a total of 21 specimens from two regional zoos, including 19 animal species, as well as four human samples. The species in this study belong to five different superorders and 11 different orders. The samples were sequenced on an Illumina HiSeq 2500, yielding a total of 973 994 362 reads. After quality filtering and adapter trimming 654 217 441 reads remained and were used for downstream analysis. An overview of the collected samples, their taxonomy and read counts is presented in Table 1. Due to the fact that for only five of the sequenced animal species a genome assembly is available to date, of which all are on scaffold level, no genome mappings were computed. Also, no miRNAs were annotated in any of the considered reference databases. All downstream analyses were performed only with the valid reads.
Read profiles resemble phylogenetic descriptors
One of the core hypotheses in this study is that the differences in read profiles between the species also mirror their known taxonomic classification. To test this hypothesis, we conducted a minHash analysis using Mash (26). The top panel of Figure 2 shows the resulting 2D embedding based on the computed sample Mash distances for superorders (2 A) and orders (2 B). For the superorders, we observe a cluster pattern matching what one would expect from their taxonomy, with the exception of Afrotheria. In the more detailed 2D embedding for orders, we see that samples belonging to Primates, Carnivora and Strigiformes cluster together well. Since the amount of reads for our samples varied greatly we wanted to estimate this influence. Therefore, we generated embeddings based on 15 times subsampling of the depth of the smallest sample, for each sample. This way, we ensure that all samples have the same size, while still keeping a realistic sequencing depth. The resulting plots (Supplementary Figure S1) show that the sample depth has only a minor influence on the clustering. To increase the resolution to the species level, we visualized the computed Mash distances as a phylogenetic tree, as shown in the lower panel of Figure 2, in comparison to the phylogenetic tree from NCBI. The biological replicates for human, common seal and lynx cluster together, confirming the reproducibility of the sample collection and sequencing process. For some species, the clustering in the Mash tree matches very well with the partitioning in the NCBI taxonomy tree; for example, the two owls cluster with the Humboldt penguin and the sun conure, which form a larger cluster with the radiated tortoise. Drill and pygmy marmoset also cluster together in both trees; however, the human samples do not cluster with these species as we would expect from the NCBI phylogenetic tree, which is partly related to the heuristic nature of the neighbour-joining algorithm used to create the tree. To quantify the resemblance of both trees, we computed the normalized Robinson-Foulds distance between both trees (D = 0.8) and found that it was significantly lower than expected by chance (P = 4 × 10⁻⁵). While some of the remaining sample clusters do not fit the known taxonomy perfectly, we still see that, based on the distance of read profiles alone, we can derive evolutionary relationships to a certain extent.
Figure 2.

2D embedding including a Voronoi diagram of the pairwise sample Mash distances for superorders (A) and orders (B). Each point in the plot represents a sample. Taxonomic tree built using the computed Mash distances of the read profiles at the species level (C) in comparison to the taxonomic tree derived from NCBI (D). The branches are colored according to the superorder of the corresponding species.
Distribution of sncRNAs varies across species
To obtain an overview of the distribution and composition of sncRNAs across species, we mapped their reads to the sequences from the Rfam database (36) with a threshold of 95% identity. We then evaluated the quality of the mappings by inspecting the distribution of their read lengths after trimming (Supplementary Figure S2) and comparing them with the distribution of the mappings against every RNA class of Rfam (Supplementary Figures S3–10). We observe in all sample peaks at the length of the sequenced reads (minus 3 nt of the template switch motif), i.e. at 47 nt and for some that ran with less cycles at 37 nt. In general, we would expect that for RNA classes that are longer than the read lengths, and which have no known functional fragments, mostly untrimmed reads map. This is the case for rRNAs where we observe mainly untrimmed reads. It holds also for snRNAs, where only in few species over 15% of the reads shorter than 30 nt map. Reads mapping to SRP RNAs are mainly untrimmed reads as well; however, in some species the length of the mapped reads is nearly evenly distributed. YRNAs, as well as tRNAs, are either mostly covered by untrimmed reads or reads in the length of YRNA and tRNA fragments (around 26 nt and around 32 nt). For reads mapping to miRNAs, we observe clear mapping patterns that show peaks at 21–22 nt, with mostly no mapping read exceed a length of 24 nt. Considering snoRNAs, we observe mostly mappings of untrimmed reads, except for some species with peaks around 26 nt. Finally, all other mapping reads are composed mostly of untrimmed reads or short reads around 20 nt. The overall results of the mapping distribution are presented per sample in Supplementary Figure S11 and summarized per species by taking the average mapping fraction in Figure 3. As expected, in almost all species, the most dominant read fraction is represented by rRNAs. However, the percentages vary substantially across species: from 7% in lynx to 49.3% in snowy owl, with a median of 35.2%. In particular, the composition of the RNA classes in both lynx samples diverge the most from those in the other species. Here, not only is the rRNA fraction very small, but also the tRNA fraction (which is in median the third most abundant class) represents 38.1% of the sncRNA reads. In most other species, the fraction of tRNAs is under 10% (median 5.5%). The distribution of miRNAs, which are the second most abundant RNA class, also varies amongst the different species, ranging from 0.2% in radiated tortoise to 16.4% in red river hog. Similar patterns could be observed for all other RNA classes. Interestingly, the fraction of miRNAs, but also of YRNAs, was highly underrepresented in all species of the Neognathae and Chelonia superorder (miRNA mean: 1.1% versus 8.7%, Wilcoxon rank-sum test P = 5 × 10⁻⁶; YRNA mean: 0.27% versus 2.9%, Wilcoxon rank-sum test P = 4 × 10⁻⁴). The differences in the compositions of RNA classes might also be influenced by the number of unmapped reads. Human reads are much better recovered in Rfam than reads of rusa and radiated tortoise, for example (unmapped: ∼23% versus ∼62%, respectively). We investigated if the mapping rates were associated with the presence of a genome assembly; however, no significant association was found (Wilcoxon rank-sum test (two-sided) P = 0.968). A chi-square test of homogeneity showed that all pairwise sample comparisons differ significantly (P = 0). Since the P-values are strongly affected by large read counts, we also computed the effect sizes using Cramer’s V, see Supplementary Table S2. Thereby, we found that the values for samples of the same species (median: 0.16) were significantly smaller (i.e. the class distributions were more similar to each other) than for samples between different species (median: 0.31, Wilcoxon rank-sum test (one-sided) P = 9 × 10⁻⁶), highlighting that even though all RNA class distributions were significantly different, the heterogeneity between samples of different species was higher than between samples of the same. To assess if the observed class distributions of some RNA classes are related to each other, we computed all pairwise Spearman correlation coefficients (Supplementary Figure S12) on the number of reads mapped to each class. This showed that miRNA and YRNA levels, as well as snoRNAs and snRNAs, are significantly and positively correlated to each other (ρ = 0.72, P = 6 × 10⁻⁴ for miRNAs and YRNAs, and ρ = 0.89, P = 3 × 10⁻⁵ for snoRNAs and snRNAs).
Figure 3.

Overview of reads mapped to the different Rfam classes for all species in this study. The colors are ordered according to the median mapping ratio of each class. Classes with mapped reads <0.05% are summarized in the category ‘Other’.
Zoo animals express common miRNA families that are more conserved than previously assumed
We also evaluated the coverage of known miRNA sequences and miRNA families in the different species. To obtain a comprehensive overview, we made use of three different miRNA databases with different scope: miRBase v22 (5), miRCarta v1.0 (6) and MirGeneDB 2.0 (37). miRBase is the gold standard resource for miRNAs; miRCarta also collects many miRNA candidates, of which only a fraction might be true miRNAs; and MirGeneDB collects miRNA genes that are manually curated and validated. We mapped the reads of the different species against the mature miRNA sequences of the three different databases, allowing only exact matches, which means that we count only reads that have exactly the same sequence and length as the sequence deposited in the corresponding database. Figure 4 summarizes the findings for the three databases separately, as well as the results overlapping amongst them. As a median, we recovered 847 miRNAs per sample. Because human is the organism with the most annotated miRNAs, we recovered the most miRNA sequences in human (n = 1846), followed by Asian elephant (n = 1210) and brown-nosed coati (n = 1187). At the lower end, the reads of the radiated tortoise sample recovered only 358 miRNAs. We could expect the number of recovered miRNAs to be significantly higher in species with known genome; however, this was not the case (Wilcoxon rank-sum test (one-sided) P = 0.1037). Although a large proportion of the miRNA sequences overlap with references in the three databases or in any combination thereof, we still found many unique hits of the reads, especially for miRNAs from miRBase. While this is surprising at first glance, it can be explained by the difference in set-up between miRCarta and miRBase. In these databases, similar miRNAs are merged into one representative, but miRBase might contain variants of the same miRNA sequence with different lengths. Nonetheless, for assessing which miRNAs actually exist, these sequences uniquely recovered in the different databases might provide new insights, because they appear to be expressed in different species in our study. To this end, we analysed the uniquely recovered sequences in miRBase in more detail. In total, we discovered 862 unique miRBase sequences, of which 44 were found in all 20 species in our deep sequencing approach. Interestingly, most of these have been described in only three different organisms in miRBase, on average. Amongst those 44 recovered sequences, there are many representatives of well-known families, such as let-7, mir-17, mir-103, mir-24, mir-181 and mir-92. Our findings indicate that these miRNAs are expressed in substantially more species than previously assumed and provide new insights into their conservation. If we look at the unique miRBase sequences recovered that have the most miRBase organisms’ annotations, but are found in only a few of the species in our analysis, we might conclude that these are either not as evolutionarily conserved or predominantly expressed as isoforms with different sequence lengths, or might even represent artefacts that have been derived by sequence-based homology but not by expression analysis. One such example is the sequence 5′-CUGCCCUGGCCCGAGGGACCGA-3′, which is only found in one species amongst our samples, but is annotated in 10 miRBase organisms. However, if we remove one base at the 3′ end from this, we also find this sequence in seven further organisms in our study and in two from miRBase. Essentially, this shows that this sequence might be a conserved miRNA, but occurs in at least two isoforms of different lengths. The uniquely recovered miRBase sequences, the number of species they cover in our study and in how many miRBase organisms the sequences are annotated are shown in Supplementary Table S3.
Figure 4.
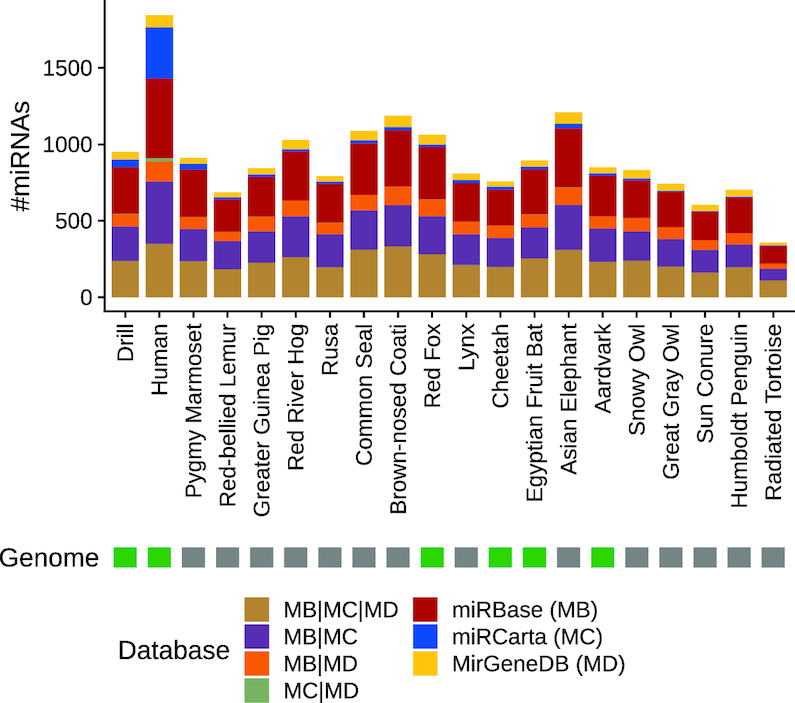
Comparison of mapping the reads of the different species against the three miRNA databases: miRBase, miRCarta and MirGeneDB. The mapping was performed with perfect matches, allowing no mismatches or differences in lengths between read and database sequence. The stacked barplot shows the number of miRNAs found uniquely in the corresponding databases, as well as the different overlaps amongst the databases.
Some sncRNAs are processed depending on the superorder of their species
Small noncoding RNAs and especially miRNAs are known to be expressed differently in organisms depending on various factors such as diseases, developmental stages or tissues. Therefore, we asked if we could find such relationships between our species as well, and in particular if this would be related to phylogeny. In a first step, to avoid biases related to isoforms, we clustered all detected miRNAs with an identity of at least 90% together and summed their expression values. Next, we clustered the miRNAs that represented at least 0.1% of the total miRNA expression in the corresponding species and that were present in at least 5 species (see Supplementary Figure S13). There, we observed that the strongest split between the species happened between those of the superorders of Neognathae and Chelonia in comparison to the other three. This is in concordance with our observations made in the previous analyses, as well as with the phylogenetic tree provided by NCBI. One example of miRNA expressed nearly exclusively in Neognathae and Chelonia is miR-2188-5p. This miRNA is expressed with a median of over 30 000 reads in those species, whereas in others we found it in at most 328 reads. In opposition, for example miR-423-3p is mostly expressed in Afrotheria, Euarchontoglires and Laurasiatheria (median of over 25 000 reads) but nearly not in Chelonia and Neognathae (at most 467 reads). We also evaluated if either 5′or 3′ miRNAs were over-represented amongst the evaluated miRNAs; however, their numbers were very similar (66 5′ miRNAs, 63 3′ miRNAs and 48 either undetermined or miRNAs that have been annotated on 5′ and 3′ positions). The observed differences led us to the question if there were potential miRNA precursors that indicated arm switches between species of different superorders. Supplementary Figure S14 shows the fraction of 5′ minus 3′ miRNA reads (1 being thus precursors exclusively expressing their 5′ miRNA and -1 their 3′ miRNA) of potential precursors, derived from the known annotations. We see that most precursors express mainly one form across all species. However, there are some for which there is no clear form. We decided to investigate those further, in particular regarding differences at the superorder level and found nine potential precursors with large differences between the Neognathae and Chelonia superorders in contrast to the Afrotheria, Euarchontoglires and Laurasiatheria superorders (see Supplementary Figure S15). However, differential processing seems to be not only limited to miRNAs, since we found for example different processing profiles for fragments of SNORD14 enriched in most species at the 5′ end, but showing clear preferences for fragments at the 3′ end in great gray owl, red fox and sun conure, as shown in Supplementary Figure S16.
Gender and health condition have limited impact in cross-species RNA expression
Others and we have shown that expression levels of certain sncRNAs, in particular miRNAs, are driven by gender or disease conditions (38–40). Therefore, we evaluated if we could observe different expression levels of Rfam families or miRNAs according to the gender or health conditions (unaffected versus affected) of our sequenced species. We did not perform a more fine grained comparison by disease, since the group sizes would have been too small and some miRNAs, such as miR-144-5p, have been shown to be deregulated independent of the disease in human (39). While significantly differing miRNA and Rfam family levels were found according to a two-sided Wilcoxon rank-sum test (gender specific: RF01412 (P = 0.013), miR-224 (P = 0.026); health condition specific: RF00009 (P = 0.0025), miR-238|miR-548c|miR-1842 (P = 0.009)), none remained significant after adjustment for multiple testing. Therefore, we conclude that the impact of these variables in a cross-species setup is too small and that differences between the species dominate the expression levels.
Many miRNA candidates are not covered by known databases
In addition to known miRNAs from the databases above, it is likely that there are other small noncoding RNAs that have not yet been annotated. A mapping-based analysis using a reference genome usually supports the discovery of these candidates. Because, for the majority of the animals included in this study, no reference genome is available, we applied mirnovo for genome-free miRNA prediction (33). First, we assessed how many known miRNAs can be recovered by a run of this tool. Figure 5A shows a stacked barplot for the number of recovered miRNAs deposited in the databases miRBase, miRCarta and MirGeneDB. In this case, we defined a positive hit if the reads mapped with at least 90% identity to the miRNA sequence in a database taking into account mismatches and differences in length. The prediction algorithm recovers most known miRNAs for human, followed by lynx, Egyptian fruit bat and common seal. In contrast to the comparison of the perfect matches above, we see that the largest fraction of recovered miRNAs is shared by all three databases for each organism and that miRCarta entries contribute the largest proportion. Still, the number of recovered miRNAs is moderate overall; even for human, we recover only 360 miRNAs. As a median, we recover only 40.5 miRNAs across all samples. Second, we analysed the results of the mirnovo algorithm by excluding known miRNAs and illustrate the numbers of novel predictions in Supplementary Figure S17. Here, as a median, approximately 575 miRNAs per species remain. The organism yielding the most candidates is sun conure, with more than 2000 predicted miRNAs, followed by Asian elephant with 1298. Because the gap between known recovered miRNAs and novel miRNAs is quite large, it is questionable how many of the predicted candidates represent true positive findings. To increase the likelihood of predicting true miRNAs, we applied a score filtering similar to novoMiRank (34), based on the features of mirnovo. The obtained scores (see Supplementary Figure S18) highlight that many predicted miRNAs are very different from the miRNAs of the high confidence set of miRBase. By filtering the predictions according to their scores, we reduced the number of predictions by 4-fold in median, as show in Figure 5B, while the number of recovered miRNAs dropped in median only by 2-fold (see Supplementary Figure S19). The results of the filtered mirnovo analysis are available in our online repository.
Figure 5.

Prediction of novel miRNAs with the tool mirnovo. (A) Comparison of recovered known miRNAs deposited in the three databases: miRBase, miRCarta and MirGeneDB. For the mapping, we required at least 90% identity between read and database sequence. The stacked barplot shows the number of miRNAs found uniquely in the corresponding databases, as well as the different overlaps amongst the databases. (B) Number of novel miRNAs predicted by mirnovo and filtered by us for the samples in this study.
ASRA: the online resource
In the previous sections, we provide only a snapshot of the potential analyses that are possible using the NGS dataset, excluding many further considerations, such as animal-specific miRNA arm expression preferences, isoforms and others. To make our findings and data easily accessible to others and to promote secondary analyses, we implemented the online resource ASRA (Animal sncRNA Atlas), available at https://www.ccb.uni-saarland.de/asra/. ASRA consists of five major modules. First, we provide an overview of all studied samples and display their read profile similarity in comparison to their phylogenetic annotations, represented as a 2D embedding plot and a phylogenetic tree. Second, users can search specific miRNAs or Rfam families in the databases considered here (miRBase, miRCarta, MirGeneDB and Rfam) and display their expression in all species (for an example, see Supplementary Figure S20). Thereby, the total read counts or expression normalized as the reads per million (RPM) can be shown, as well as the expression of known similar miRNAs (known miRNAs with 90% similarity to the selected one). In addition, a species specificity index is shown for each entry, which indicates whether the displayed RNA is preferentially expressed in few species (values closer to 1) or ubiquitously in all species (values closer to 0). Third, each organism and considered database can be browsed separately; for example, for each organism we provide an overview of the number of reads and their mapped fraction, as well as their class distribution. In addition, detailed mapping information, such as total reads and average RPM, are displayed for the three analysed miRNA databases, the predicted miRNA candidates, the Rfam RNA families as well as their Gene Ontology terms. In particular, for Rfam RNA families, we provide coverage plots with the average RPM at each position of the 500 most expressed family members. All tables can be filtered according to their miRNA/RFAM IDs, their expression or the number of samples in which the sequence was found. Because Rfam families are composed of many sequences, we provide a detailed view for each family and species, which comprises the fourth usability feature. Users can then see if the detected parts of the family are common to many family members or if they are specific to few members. Furthermore, we enable the family coverage profiles to be directly compared amongst different species, which can highlight differences such as miRNA arm expression preferences (arm switches). Finally, users can search nucleotide sequences, either exactly or as part of a read, in all samples of the database and inspect their distribution amongst all species.
DISCUSSION
High-throughput sequencing in combination with microsampling devices allows the generation of data from species for which normal sample collection would be challenging. In our study, we collected blood from a variety of different species at German zoos and compared their small noncoding RNA profiles.
In the first steps of data analysis, quality filtering removed a considerable number of reads. This is probably due to two factors: as we used a minimally invasive method for sampling peripheral blood, the amount of RNA was indeed limited. We consequently chose a library preparation protocol suitable for low input amounts based on ligation-free template-switching cDNA generation. To this end, we used total small RNA fractions from precipitation-free isolation from dried blood without further size exclusion. As such, a high number of very small reads (shorter than 17 nt) were obtained and thus discarded. Next, we used 3′ polyadenylation of small RNAs before reverse transcription, which then requires the trimming of poly(A) stretches. Here, any small RNA with a poly(A) region is trimmed, as we cannot differentiate this from in vitro poly(A). For the unmapped fraction of reads and also for species for which, to date, no genome is available, it is unlikely that we sequenced many RNA degradation products, as we omitted any de-phosphorylation and therefore enriched the library for 3′-OH RNAs.
Analysing the similarity of the read profiles by computing the Mash distances revealed that most of the samples of the same superorders and orders clustered together. Even at the species level, we still found two groups (birds and primates) that clustered in a way that was comparable to the phylogenetic taxonomy in NCBI. To the best of our knowledge, this is the first study showing that k-mer profiles derived from small RNA reads across many species still maintain the known evolutionary relationships.
Upon considering the distribution of RNA classes across species, we could not observe a clear pattern. As expected, rRNA constituted the dominant fraction in most species, with some exceptions. The number of reads that could be mapped to the Rfam classes varied enormously amongst the species. Human had the best coverage, but is also amongst the best annotated and most researched organisms. Relating these distributions to the differing amount of annotations known for many species, it seems reasonable that RNA classes are distributed heterogeneously. However, this is certainly also related to the fact that some organisms are more in the research focus than others. As the other animals in our study are not model organisms, it is possible that their unmapped reads belong to RNA families that have not yet been annotated in Rfam or otherwise present sequencing artefacts. Astonishingly, we found that the tRNA fraction was incredibly high in both lynx samples. As we found similar extreme distributions for both samples, this reduces the likelihood of sequencing or library preparation errors. Therefore, we hypothesize that this could be related to the physiological or even pathophysiological condition of the Lynx that has not been diagnosed so far, especially since tRNA overexpression has often been associated with various cancer types in human (41–43). Interestingly, we found that miRNAs and YRNA levels were positively correlated, suggesting that even though their biogenesis pathways are different (44) they might share, potentially complementary, functions. We also found that the levels of snoRNAs and snRNAs correlated positively, which is not surprising, as they both belong to the upper class of small nuclear RNAs that guide RNA processing proteins.
The evaluation of the expression of sncRNAs in the context of their phylogeny highlighted that large differences that can be observed between some superorders, and in particular between Neognathae and Chelonia in comparison to the others of this study. We even found examples of potential precursors that showed preferential arm expressions depending on their superorders. Nevertheless, these findings are of course limited by the size of groups, and more samples would be needed for higher confidence. In particular, arm expression comparisons can be difficult, due to the fact that precursors containing the same or similar miRNAs do not necessarily exist in all species. Further evidence, in particular via genome assemblies, would help to reduce this limitation.
The recovery of deposited miRNA sequences from three miRNA databases highlighted that miRBase contains the highest number of unique sequences, but also include numerous redundant variations of sequences belonging to the same family. We showed that known miRNAs are available in more species than previously assumed and other ones might be expressed predominantly as different isoforms.
For the prediction of novel miRNAs from NGS data, we chose mirnovo (33) because this tool does not require a reference genome. To obtain an estimate of how well this prediction works, we counted how many known miRNA sequences can be recovered with the prediction. Although we used a very lenient mapping strategy, a median of only about 40.5 miRNAs were found per organism. In contrast, the tool predicted more than 10 times as many novel candidates per organism. By applying a filtering approach and thus reducing the predictions by 4-fold, we expect to have increased the ratio of true positives considerably. Because we cannot verify these results experimentally, it remains unclear how many true positive findings the predictions actually contain.
While our study describes expression patterns of sncRNAs in blood cells for a large collection of animals and provides fascinating new insights into the distribution and conservation of sncRNAs, certain limitations of the present study need to be considered and discussed. First, the samples were collected during veterinary examinations, including routine examinations but also blood collection of animals with pathologies. These factors might be reflected in the patterns of sncRNAs, but according to our experience from human samples, such effects are rather moderate compared with the variations that we observe here. A more important factor may be variations between representatives of the same species; we thus aim to obtain more specimens, in terms of collecting more samples from the same species but also adding more species. Another limitation stems from the focus of our study. We focus exclusively on circulating sncRNAs in blood cells and thus miss sncRNAs which might be specific to other cell types. In order to reach a comprehensive description of the sncRNAs present in the analysed species, more tissues and specimens will be needed.
CONCLUSION
The detection, annotation and validation of sncRNAs, especially miRNAs, is still a growing field. To understand their function and their potential as biomarkers for diseases, we must first understand how to distinguish actually expressed and valid miRNAs from false positive findings. Conservation is a widely applied feature for identifying miRNAs in related species. Such analyses are often only performed via homology- and sequence-based in silico approaches. With our study, we provide a large collection of small RNA NGS expression data for species that have not been analysed before in great detail. We created a comprehensive publicly available online resource for researchers in the field to facilitate the assessment of evolutionarily conserved small RNA sequences.
DATA AVAILABILITY
All sequencing data have been deposited in the Sequence Read Archive with the accession SRP162759.
Supplementary Material
ACKNOWLEDGEMENTS
We thank Edanz (www.edanzediting.com) for editing the English text of a draft of this manuscript.
SUPPLEMENTARY DATA
Supplementary Data are available at NAR Online.
FUNDING
Saarland University; Saarland; Michael J. Fox Foundation for Parkinson’s Research (US) [14446]. Funding for open access charge: Saarland.
Conflict of interest statement. None declared.
REFERENCES
- 1. Crick F. Central dogma of molecular biology. Nature. 1970; 227:561–563. [DOI] [PubMed] [Google Scholar]
- 2. Lee R.C., Feinbaum R.L., Ambros V.. The C. elegans heterochronic gene lin-4 encodes small RNAs with antisense complementarity to lin-14. Cell. 1993; 75:843–854. [DOI] [PubMed] [Google Scholar]
- 3. Mercer T.R., Dinger M.E., Mattick J.S.. Long non-coding RNAs: insights into functions. Nat. Rev. Genet. 2009; 10:155–159. [DOI] [PubMed] [Google Scholar]
- 4. Veneziano D., Di Bella S., Nigita G., Laganà A., Ferro A., Croce C.M.. Noncoding RNA: Current deep sequencing data analysis approaches and challenges. Human Mutat. 2016; 37:1283–1298. [DOI] [PubMed] [Google Scholar]
- 5. Kozomara A., Birgaoanu M., Griffiths-Jones S.. miRBase: from microRNA sequences to function. Nucleic Acids Res. 2018; 47:D155–D162. [DOI] [PMC free article] [PubMed] [Google Scholar]
- 6. Backes C., Fehlmann T., Kern F., Kehl T., Lenhof H.-P., Meese E., Keller A.. miRCarta: a central repository for collecting miRNA candidates. Nucleic Acids Res. 2018; 46:D160–D167. [DOI] [PMC free article] [PubMed] [Google Scholar]
- 7. Weber M.J. New human and mouse microRNA genes found by homology search. FEBS J. 2005; 272:59–73. [DOI] [PubMed] [Google Scholar]
- 8. Yue J., Sheng Y., Orwig K.E.. Identification of novel homologous microRNA genes in the rhesus macaque genome. BMC Genomics. 2008; 9:8. [DOI] [PMC free article] [PubMed] [Google Scholar]
- 9. Artzi S., Kiezun A., Shomron N.. miRNAminer: a tool for homologous microRNA gene search. BMC Bioinformatics. 2008; 9:39. [DOI] [PMC free article] [PubMed] [Google Scholar]
- 10. Baev V., Daskalova E., Minkov I.. Computational identification of novel microRNA homologs in the chimpanzee genome. Comput. Biol. Chem. 2009; 33:62–70. [DOI] [PubMed] [Google Scholar]
- 11. Long J.-E., Chen H.-X.. Identification and characteristics of cattle MicroRNAs by homology searching and small RNA cloning. Biochem. Genet. 2009; 47:329–343. [DOI] [PubMed] [Google Scholar]
- 12. Ludwig N., Leidinger P., Becker K., Backes C., Fehlmann T., Pallasch C., Rheinheimer S., Meder B., Stähler C., Meese E. et al.. Distribution of miRNA expression across human tissues. Nucleic Acids Res. 2016; 44:3865–3877. [DOI] [PMC free article] [PubMed] [Google Scholar]
- 13. Backes C., Meese E., Keller A.. Specific miRNA disease biomarkers in blood, serum and plasma: challenges and prospects. Mol. Diagn. Ther. 2016; 20:509–518. [DOI] [PubMed] [Google Scholar]
- 14. Keller A., Fehlmann T., Ludwig N., Kahraman M., Laufer T., Backes C., Vogelmeier C., Diener C., Biertz F., Herr C. et al.. Genome-wide MicroRNA expression profiles in COPD: Early predictors for cancer development. Genomics Proteomics Bioinformatics. 2018; 16:162–171. [DOI] [PMC free article] [PubMed] [Google Scholar]
- 15. Keller A., Backes C., Haas J., Leidinger P., Maetzler W., Deuschle C., Berg D., Ruschil C., Galata V., Ruprecht K. et al.. Validating Alzheimer’s disease microRNAs using next-generation sequencing. Alzheimers Demen. 2016; 12:565–576. [DOI] [PubMed] [Google Scholar]
- 16. Fehlmann T., Ludwig N., Backes C., Meese E., Keller A.. Distribution of microRNA biomarker candidates in solid tissues and body fluids. RNA Biol. 2016; 13:1084–1088. [DOI] [PMC free article] [PubMed] [Google Scholar]
- 17. Keller A., Leidinger P., Bauer A., Elsharawy A., Haas J., Backes C., Wendschlag A., Giese N., Tjaden C., Ott K. et al.. Toward the blood-borne miRNome of human diseases. Nat. Methods. 2011; 8:841–843. [DOI] [PubMed] [Google Scholar]
- 18. Keller A., Leidinger P., Vogel B., Backes C., ElSharawy A., Galata V., Mueller S.C., Marquart S., Schrauder M.G., Strick R. et al.. miRNAs can be generally associated with human pathologies as exemplified for miR-144. BMC Med. 2014; 12:224. [DOI] [PMC free article] [PubMed] [Google Scholar]
- 19. Kahraman M., Laufer T., Backes C., Schrörs H., Fehlmann T., Ludwig N., Kohlhaas J., Meese E., Wehler T., Bals R. et al.. Technical stability and biological variability in microRNAs from dried blood spots: a lung cancer therapy-monitoring showcase. Clin. Chem. 2017; 63:1476–1488. [DOI] [PubMed] [Google Scholar]
- 20. Pirritano M., Fehlmann T., Laufer T., Ludwig N., Gasparoni G., Li Y., Meese E., Keller A., Simon M.. NGS analysis of total small non coding RNAs from low input RNA from dried blood sampling. Anal. Chem. 2018; 90:11791–11796. [DOI] [PubMed] [Google Scholar]
- 21. Fehlmann T., Backes C., Kahraman M., Haas J., Ludwig N., Posch A.E., Würstle M.L., Hübenthal M., Franke A., Meder B. et al.. Web-based NGS data analysis using miRMaster: a large-scale meta-analysis of human miRNAs. Nucleic Acids Res. 2017; 45:8731–8744. [DOI] [PMC free article] [PubMed] [Google Scholar]
- 22. R Core Team R: A Language and Environment for Statistical Computing R Foundation for Statistical Computing Vienna. 2018; Austria: https://www.r-project.org. [Google Scholar]
- 23. Benjamini Y., Hochberg Y.. Controlling the false discovery rate: a practical and powerful approach to multiple testing. J. R. Stat. Soc. B. 1995; 57:289–300. [Google Scholar]
- 24. Mangiafico S. rcompanion: Functions to Support Extension Education Program Evaluation. R package version 2.0.10. 2019; https://rcompanion.org. [Google Scholar]
- 25. Wickham H. ggplot2: Elegant Graphics for Data Analysis. 2016; NY: Springer-Verlag; https://ggplot2.tidyverse.org. [Google Scholar]
- 26. Ondov B.D., Treangen T.J., Melsted P., Mallonee A.B., Bergman N.H., Koren S., Phillippy A.M.. Mash: fast genome and metagenome distance estimation using MinHash. Genome Biol. 2016; 17:132. [DOI] [PMC free article] [PubMed] [Google Scholar]
- 27. Saitou N., Nei M.. The neighbor-joining method: a new method for reconstructing phylogenetic trees. Mol. Biol. Evol. 1987; 4:406–425. [DOI] [PubMed] [Google Scholar]
- 28. Schliep K.P. phangorn: phylogenetic analysis in R. Bioinformatics. 2011; 27:592. [DOI] [PMC free article] [PubMed] [Google Scholar]
- 29. Letunic I., Bork P.. Interactive tree of life (iTOL) v3: an online tool for the display and annotation of phylogenetic and other trees. Nucleic Acids Res. 2016; 44:W242–W245. [DOI] [PMC free article] [PubMed] [Google Scholar]
- 30. Weese D., Holtgrewe M., Reinert K.. RazerS 3: faster, fully sensitive read mapping. Bioinformatics. 2012; 28:2592–2599. [DOI] [PubMed] [Google Scholar]
- 31. Langmead B., Trapnell C., Pop M., Salzberg S.L.. Ultrafast and memory-efficient alignment of short DNA sequences to the human genome. Genome Biol. 2009; 10:R25. [DOI] [PMC free article] [PubMed] [Google Scholar]
- 32. Rognes T., Flouri T., Nichols B., Quince C., Mahé F.. VSEARCH: a versatile open source tool for metagenomics. PeerJ. 2016; 4:e2584. [DOI] [PMC free article] [PubMed] [Google Scholar]
- 33. Vitsios D.M., Kentepozidou E., Quintais L., Benito-Gutiérrez E., van Dongen S., Davis M.P., Enright A.J.. Mirnovo: genome-free prediction of microRNAs from small RNA sequencing data and single-cells using decision forests. Nucleic Acids Res. 2017; 45:e177. [DOI] [PMC free article] [PubMed] [Google Scholar]
- 34. Backes C., Meder B., Hart M., Ludwig N., Leidinger P., Vogel B., Galata V., Roth P., Menegatti J., Grässer F. et al.. Prioritizing and selecting likely novel miRNAs from NGS data. Nucleic Acids Res. 2015; 44:e53. [DOI] [PMC free article] [PubMed] [Google Scholar]
- 35. Alles J., Fehlmann T., Fischer U., Backes C., Galata V., Minet M., Hart M., Abu-Halima M., Grässer F.A., Lenhof H.-P. et al.. An estimate of the total number of true human miRNAs. Nucleic Acids Res. 2019; doi:10.1093/nar/gkz097. [DOI] [PMC free article] [PubMed] [Google Scholar]
- 36. Kalvari I., Argasinska J., Quinones-Olvera N., Nawrocki E.P., Rivas E., Eddy S.R., Bateman A., Finn R.D., Petrov A.I.. Rfam 13.0: shifting to a genome-centric resource for non-coding RNA families. Nucleic Acids Res. 2018; 46:D335–D342. [DOI] [PMC free article] [PubMed] [Google Scholar]
- 37. Fromm B., Domanska D., Hackenberg M., Mathelier A., Hoye E., Johansen M., Hovig E., Flatmark K., Peterson K.J.. MirGeneDB2.0: the curated microRNA Gene Database. 2018; bioRxiv doi: 10.1101/258749, 05 February 2018, preprint: not peer reviewed. [DOI]
- 38. Meder B., Backes C., Haas J., Leidinger P., Stähler C., Großmann T., Vogel B., Frese K., Giannitsis E., Katus H.A. et al.. Influence of the confounding factors age and sex on microRNA profiles from peripheral blood. Clin. Chem. 2014; 60:1200–1208. [DOI] [PubMed] [Google Scholar]
- 39. Keller A., Leidinger P., Vogel B., Backes C., ElSharawy A., Galata V., Mueller S.C., Marquart S., Schrauder M.G., Strick R. et al.. MiRNAs can be generally associated with human pathologies as exemplified for miR-144. BMC Med. 2014; 12:224. [DOI] [PMC free article] [PubMed] [Google Scholar]
- 40. Muñoz-Culla M., Irizar H., Sáenz-Cuesta M., Castillo-Triviño T., Osorio-Querejeta I., Sepúlveda L., De Munain A.L., Olascoaga J., Otaegui D.. SncRNA (microRNA & snoRNA) opposite expression pattern found in multiple sclerosis relapse and remission is sex dependent. Sci. Rep. 2016; 6:20126. [DOI] [PMC free article] [PubMed] [Google Scholar]
- 41. Goodarzi H., Nguyen H.C., Zhang S., Dill B.D., Molina H., Tavazoie S.F.. Modulated expression of specific tRNAs drives gene expression and cancer progression. Cell. 2016; 165:1416–1427. [DOI] [PMC free article] [PubMed] [Google Scholar]
- 42. Huang S.-q., Sun B., Xiong Z.-p., Shu Y., Zhou H.-h., Zhang W., Xiong J., Li Q.. The dysregulation of tRNAs and tRNA derivatives in cancer. J. Experiment. Clin. Cancer Res. 2018; 37:101. [DOI] [PMC free article] [PubMed] [Google Scholar]
- 43. Zhou Y., Goodenbour J.M., Godley L.A., Wickrema A., Pan T.. High levels of tRNA abundance and alteration of tRNA charging by bortezomib in multiple myeloma. Biochem. Biophys. Res. Commun. 2009; 385:160–164. [DOI] [PMC free article] [PubMed] [Google Scholar]
- 44. Nicolas F.E., Hall A.E., Csorba T., Turnbull C., Dalmay T.. Biogenesis of Y RNA-derived small RNAs is independent of the microRNA pathway. FEBS Lett. 2012; 586:1226–1230. [DOI] [PubMed] [Google Scholar]
Associated Data
This section collects any data citations, data availability statements, or supplementary materials included in this article.
Supplementary Materials
Data Availability Statement
All sequencing data have been deposited in the Sequence Read Archive with the accession SRP162759.