

Abstract
We report a patient relapsing 9 months after CD19-targeted CAR T cell (CTL019) infusion with CD19- leukemia that aberrantly expressed the anti-CD19 CAR. The CAR gene was unintentionally introduced into a single leukemic B cell during T cell manufacturing, and its product bound in cis to the CD19 epitope on the surface of leukemic cells, masking it from recognition by and conferring resistance to CTL019.
Reporting Summary.
Further information on research design is available in the Nature Research Reporting Summary linked to this article.
The anti-CD19 chimeric antigen receptor (CAR) T cell product CTL019 (tisagenlecleucel, Kymriah, Novartis) for pediatric relapsed/refractory B cell acute lymphoblastic leukemia (B-ALL) was the first Food and Drug Administration (FDA)-approved gene-modified cell therapy in any indication1,2. Despite the remarkable clinical outcome of CTL019 in B-ALL, the high rate of complete responses is partially offset by a substantial number of relapses, often with undetectable CD19 on the leukemic cells, involving several different mechanisms (Supplementary Table 1)3–6.
Here we report a 20-year-old male patient with B-ALL (Patient #107) in his third relapse after chemotherapy and a cord blood transplant who enrolled in our phase 1 trial (NCT01626495) to evaluate the safety, feasibility, and engraftment of CTL019 in pediatric and young adult B-ALL. Following lymphodepletion, the patient was infused over 2 d with 2 × 10⁹ total T cells (2.79 × 10⁷ CD3 cells per kg body weight), comprising 4.28 ×10⁸ CTL019 cells. The infused CTL019 cells displayed the typical pattern of in vivo engraftment and expansion by CAR19-specific flow cytometry, followed by decline to an undetectable level in the peripheral blood1,7 (Fig. 1a). The expansion and contraction phases and long-term persistence of CAR T cells were confirmed via qPCR using CAR-specific primers (Fig. 1a).
Fig. 1|. Detection and characterization of B cell lymphoblastic leukemia expressing CAR19 in a patient treated with CTL019 therapy.
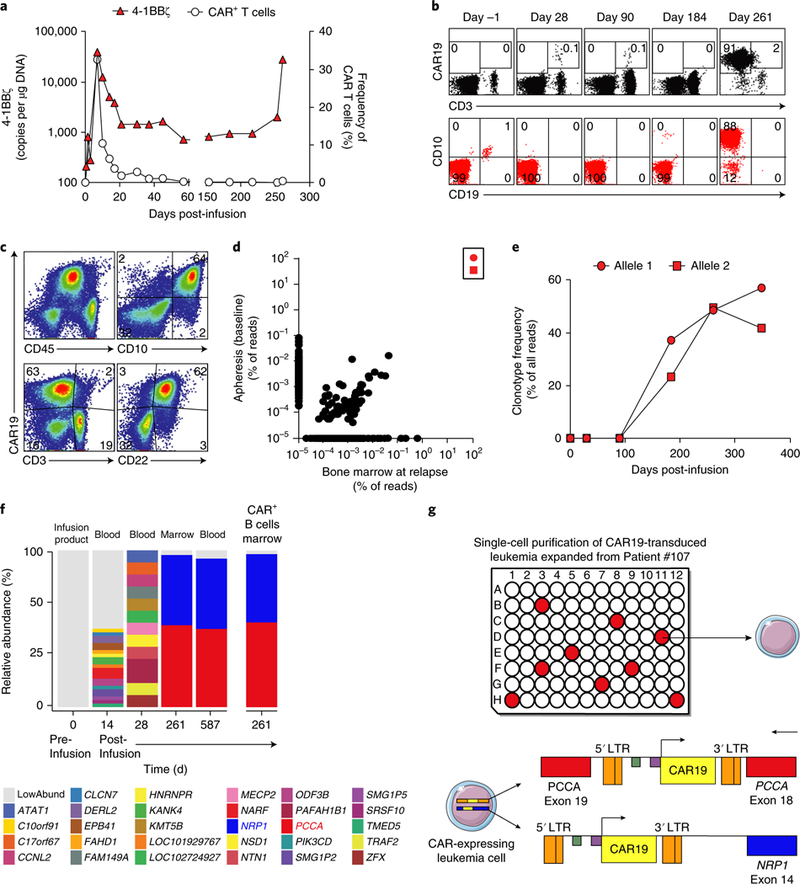
a, Dynamics of CTL019 T cells detected by flow cytometry and of CAR19 4–1BBζ transcripts in peripheral blood over time. b, Serial flow cytometry analysis of CAR19+ cells (either CD3+ or CD3–) (top) compared to leukemic cells (gated on CD45dim and showing CD10 and CD19) (bottom) in the bone marrow (BM). c, Flow cytometry phenotyping of the CAR19-expressing leukemic blasts (identified as the CD3–CD10+CD22+CD45dim population) at relapse. d, Results from IgH-seq of apheresis material and bone marrow at relapse. Allele 1 and allele 2 are depicted as in e and are boxed. e, Serial monitoring of IgH clonotypes over time in the bone marrow. f, Lentiviral integration site (LVIS) analysis of pre- and postinfusion samples from Patient #107; horizontal bars indicate abundance and location of LVIS, annotated by the nearest gene. g, Schematic of single-cell analysis of five genes in 71 relapsed leukemia cells. Nine cells showed the simultaneous presence of the integrations in both NRP1 and PCCA. The genomic locations and orientations of the two main integration sites observed in single leukemia cells at relapse are shown beneath the graph. For a–f, results are representative of two independent experiments.
The patient was in complete remission at day 28 post-CTL019 infusion (Fig. 1b, day 28 panels). However, qPCR for routine monitoring of peripheral blood for CAR-specific sequences identified the emergence of a second expansion phase of CAR cells starting at day 252, which did not correlate with re-expansion of CAR+ T cells by flow cytometry (Fig. 1a). At day 261, the patient experienced frank relapse, as noted by abundant infiltration (>90%) of CD10+CD19– leukemic cells in the bone marrow (Fig. 1b, day 261 panels) and the presence of circulating blasts. Further immunophenotyping of this population revealed that these CAR19-expressing cells were CD3–CD10+CD22+CD45dim, indicating that they were, in fact, CAR-transduced B cell leukemia (CARB) cells (Fig. 1c). Because of progressive disease, salvage therapy was attempted with vincristine, prednisone, mercaptopurine, and methotrexate, followed by nine cycles of moxetumomab (an anti-CD22 antibody) and then by CD22-directed CAR therapy at the National Cancer Institute. However, the patient’s CARB cells continued to expand, and the patient ultimately died of complications related to progressive leukemia.
To track the origin of the CARB cells, we analyzed the immunoglobulin heavy chain rearrangements of the relapsed CAR19+ disease via next-generation immunoglobin heavy-chain sequencing (IgH-seq). The cells contained one productively rearranged allele and a second nonproductively rearranged allele (Supplementary Table 2). These rearrangements were present in the pre-CTL019 infusion apheresis, confirming the clonal relatedness to the original leukemia (Fig. 1d). We therefore hypothesized that the CAR19+ leukemia relapse was generated via lentiviral transduction that occurred either in vivo via replication-competent lentivirus (RCL) or during the CTL019 manufacturing process. We did not detect any RCL in this patient upon testing peripheral blood sampled at months 3, 6, 9, 12, and 20 after CTL019 infusion8. IgH-seq analysis of the CAR19+ sorted cells from the CTL019 product identified the leukemic clonotypes, indicating that the CARB cells were a byproduct of a transduction event during CTL019 cell manufacturing (Supplementary Table 3). IgH-seq analysis of baseline and sequential bone marrow samples confirmed the absence of detectable levels of leukemia at 28 d after CTL019 infusion. However, the leukemia could be retrospectively detected by IgH-seq in the patient’s marrow about 3 months ahead of clinically evident relapse, and it progressively increased over time (Fig. 1e) until overt relapse was evident in the bone marrow and blood.
To understand the role of CAR transduction in leukemic cells, we analyzed the nature and dynamics of the lentiviral vector integration sites over time (Fig. 1f). Analysis of the CTL019 infusion product detected 2,924 unique integration sites, which at month 1 declined to 12 sites in blood. At relapse (month 9), two integration sites comprised 97% of all integration sites sampled, indicative of clonal expansion of the lentivirus-marked leukemic blasts (Supplementary Table 4). One site was in chromosome 13 in intron 18 of the pro-pionyl-CoA carboxylase-A (PCCA) gene9, and the second in chromosome 11, 62.5 kb downstream of the neuropilin-1 (NRP1) gene10 (Fig. 1g). These two integration sites were not detectable in the infusion product (Fig. 1f), potentially because the frequency was below the detection threshold. Though NRP1 is commonly overexpressed by B-ALL cells, genetic abnormalities of either gene have not been reported in ALL (www.cbioportal.org). qRT-PCR analysis of PCCA and NRP1 in purified leukemia cells and flow cytometry for NRP1 from the apheresis and relapsed cells showed that PCCA and NRP1 expression levels were similar (Supplementary Fig. 1a,b). Thus, available data do not support the hypothesis that insertional mutagenesis of NRP1 or PCCA contributed to the relapse.
To confirm that the leukemia relapse originated from a single clone, blast cells detected at month 9 were expanded in mice and sorted for single cells, which were analyzed for five genes, including PCCA and NRP1 (Fig. 1g and Supplementary Fig. 2). Of 71 cells analyzed, 9 cells were found for which all five assays were positive for both vector–host junctions by targeted PCR, confirming that the relapse cells originated from a single blast clone that was transduced with two copies of the CAR19 vector during the manufacturing process.
Patient #107 relapsed with CD19– leukemia associated with aberrant expression of CAR19. We therefore aimed to understand the causes for the lack of CD19 expression. We and others have reported that lack of surface expression of CD19 may be due to mutations3, alternative splicing in CD19 (exon 2 skipping)3, or mutations in the B cell receptor complex protein CD81 (refs 11,12). However, none of these were identified in Patient #107 (Supplementary Table 5). Although the CD19 protein was not detectable through flow cytometry, CD19 transcripts were identified in the baseline apheresis and at relapse, and the abundance of CD19 mRNA tracked with those of relapsed leukemic blasts (Supplementary Fig. 3). Moreover, immunohistochemical (IHC) staining of the bone marrow at relapse revealed CD19 protein expression (Fig. 2a). The OTI3B10 antibody used for IHC targets an intracellular domain of CD19. We therefore hypothesized that the lack of CD19 detection by flow cytometry was due to the CAR19 binding to CD19 and subsequent ‘masking’ of the CD19 epitope recognized by the flow cytometry antibodies. Competitive binding experiments demonstrated that all CD19 extracellular epitope–specific monoclonal antibodies tested by flow cytometry, including HIB19 (used for initial flow cytometry), were blocked by FMC63 (source of the CD19 CAR single-chain variable fragment (scFv)) (Supplementary Fig. 4a). We then confirmed via flow cytometry that leukemic cells in apheresis and relapse samples were recognized by intracellular-epitope monoclonal antibodies OTI3B10 (or a second, intracellular CD19 epitope-specific mAb EPR5906), whereas extracellular-epitope monoclonal antibody HIB19 only bound to leukemic cells in the baseline sample (Fig. 2b and Supplementary Fig. 4b). We concluded that CD19 protein was, in fact, expressed in relapsed leukemic blasts, but it was not recognized by monoclonal antibodies against extracellular CD19 epitopes, including the monoclonal antibody from which the CAR was derived. To assess whether CD19 was expressed on cell surface or only intracellularly, we used confocal microscopy that demonstrated colocalization of CAR19 and CD19 on the cell surface of the relapsed leukemia (Fig. 2c and Supplementary Fig. 4b).
Fig. 2|. Ectopic CAR19 expression on B-ALL cells masks CD19 and creates CTL019-resistant leukemia.

a, Immunohistochemistry analysis of CD19 (OTI3B10 antibody clone, which binds to the cytoplasmic domain of CD19) in bone marrow biopsies before CTL019 treatment and at relapse. The black arrows point to CD19+ B cells. Scale bars, 200 μm. b, Flow cytometry analysis of CAR19+ Patient #107 leukemia cells at baseline and relapse using two anti-CD19 antibodies (0TI3B10, intracellular; HIB19, extracellular). c, Confocal imaging of Patient #107 leukemic blasts at baseline and relapse using Dylight488-conjugated 0TI3B10 anti-CD19 antibody (green), Alexa647-conjugated anti-CAR19 idiotype antibody (red), and DAPI (blue). Scale bars,2 μm. In (a–c), representative data from two independent experiments are shown. d, Expression of CD19 and CAR19 on wild-type, CD19-knockout, and CAR19-transduced NALM-6 cells analyzed by flow cytometry (representative of 5 experiments). e, CD19 mRNA expression is maintained in CAR19+ NALM-6 as compared to wild-type NALM-6 cells, as determined by qPCR (ΔΔCt normalized to wild-type, shown as wild-type). K562 cells were used as controls (pooled data from three independent experiments). ***P< 0.0001 as determined using a two-sided unpaired Student’s t-test. f, Confocal imaging demonstrates the coexpression of the CAR19–mCherry and CD19–GFP fusion proteins on the surface of NALM-6 leukemic cells. CD19– (CRISPR–Cas9 knocked-out) NALM-6 cells were cotransduced with CD19–GFP (green) and CAR19–mCherry (red) fusion constructs. DAPI was used to stain cell nuclei (representative of four independent experiments with similar results). g, Upon doxycycline treatment, CD19 surface expression (mCherry) was no longer detected in Tet-inducible CAR–transduced NALM-6 cells by anti-CD19 flow antibody (clone: HIB19; representative of four independent experiments). h, Wild-type NALM-6 cells but not CAR19+ NALM-6 cells are highly resistant to CAR19+ T cell killing in a murine xenograft model. Targeting the CD22 protein with CAR T cells prevents leukemia progression in both wild-type and CAR19+ NALM-6 cells (n = 5 mice per group; symbols depict the mean; error bars represent s.e.m.). i, CAR22+ T cells but not CAR19+ T cells are able to eradicate tumor cells in NOD–SCID gamma chain-deficient (NSG) mice engrafted with CAR19+ leukemia (derived from Patient #107 at relapse) (n = 5 mice per group; each symbol represents the mean; error bars depict s.e.m.). For h and i, results are representative of two independent experiments.
Thus, CD19 protein was present on the surface of leukemia cells but could not be detected by the reagents binding the extracellular domain. Therefore, we speculated that the lack of detection of CD19 by flow cytometry was due to CAR19 binding in cis to CD19 on the surface of leukemic blasts, thus masking the epitope from detection by standard flow cytometry (Supplementary Fig. 5). We successfully modeled this ‘epitope-masking’ phenomenon in a B-ALL cell line (CD19+ NALM-6) transduced with CAR19 and showed dramatic loss of CD19 expression by standard flow cytometry (Fig. 2d). Interestingly, CD19 transcripts were preserved (Fig. 2e), and colocalization of both CD19 and the CD19-specific CAR protein was observed (Fig. 2f), matching our observations of the relapsed CAR19+ leukemic cells from Patient #107. CAR19 expression directly mediated loss of CD19, as CD19 detection was lost when CAR expression was induced in a doxycycline-conditional model of CAR19 expression (Fig. 2g).
In in vivo xenograft models, CAR19+, but not wild-type, NALM6 leukemic cells were resistant to CTL019-mediated killing, but not to anti-CD22 CAR T cells (Fig. 2h). We also engrafted Patient #107 relapse (CAR19+) cells and then used healthy donor CTL019 or CART22 cells for treatment; we found that only CART22 cells were able to induce remission, indicating that the reason for relapse in Patient #107 was likely not due to impaired function of the patient-derived CTL019 but rather to an intrinsic leukemia resistance mechanism consequent to CAR19 expression (Fig. 2i).
In order to understand whether the ‘epitope masking’ relapse mechanism could also apply to other CAR T cell targets, we tested CARs recognizing CD22 (refs 13,14). CD22-expressing NALM-6 cells were transduced either with HA22- or m971-based anti-CD22 CARs15–17 recognizing CD22 membrane-distal and membraneproximal epitopes, respectively. In this model, CD22 expression by flow cytometry was lost only when the NALM6 was transduced with the CAR targeting the same epitope as the flow cytometry antibody (Supplementary Fig. 6a). Of note, CAR22+ NaLm6 (either HA22 or m971 CARs) cells were resistant only to CAR T cells expressing the same CAR22 scFv (Supplementary Fig. 6b). These results demonstrate that in cis epitope masking can mediate resistance to CART22, as observed with CTL019 (Supplementary Fig. 7).
To define variables that might predispose to unintended leukemic cell transduction during manufacturing, we analyzed the frequency of leukemic B cells (and T cells) in the apheresis products that were used to manufacture CTL019 in 116 patients (Supplementary Fig. 8a,b). Although Patient #107 had one of the highest CD19+ cell contents in the apheretic product (62.78%), several other patients who did not develop CAR+ leukemia had higher leukemic B cell frequencies. We next analyzed the presence of leukemic cells in unfractionated and CAR19-sorted infusion products from 17 patients with leukemia using IgH rearrangement sequencing. Presence of the rare leukemic blasts in the infusion product (found in 6 out of 17 patients) did not seem to correlate with relapse rate, time to relapse, and antigen-loss relapse (Supplementary Table 3). However, a higher frequency of leukemic B cell content in the initial apheresis was associated with higher presence of leukemia in the final product (Supplementary Fig. 9).
We then aimed at evaluating the frequency of CD19 epitope masking in patients treated with CTL019. We retrospectively analyzed relapsed samples from patients enrolled in our CTL019 trials for possible CAR expression in CD3– cells (data not shown), and we did not find additional patients relapsing with leukemic cells expressing CAR19. However, one patient (Patient #101), whom we previously reported as a CD19– relapse18, also had CAR19 expression on a minor subset (<0.1%) of relapsing leukemic cells (Supplementary Fig. 10). Nevertheless, it is unclear whether the minor subset of relapsing leukemic cells expressing CAR19 carried mutations and/or an aberrant CD19 splicing pattern3 and, based on the relatively small frequency, it is unlikely to be the driver of the relapse in Patient #101.
In summary, we have demonstrated that the transduction of a single leukemic cell with an anti-CD19 CAR lentivirus during CTL019 manufacturing is sufficient to mediate resistance through masking of the CD19 epitope. This is a rare event, as this is the only case out of 369 patients reported worldwide at the time of publication (Supplementary Table 1). We excluded other possible causes of CD19-negativity, including CD19 mutations, CD19 splicing variants, and structural alterations of the B cell receptor complex. Using a panel of non-cross-reactive monoclonal antibodies as well as confocal microscopy, we found that expression of the CAR in cis on B-ALL blasts leads to masking of the CAR target epitope. Given that transduction of leukemia cells with a CD22 CAR leads to specific resistance to CD22 and not to CD19 CARs, it is likely that this could be a general mechanism to render any tumor or normal cell specifically resistant to a CAR T cell. Finally, our results provide a direct confirmation of the cancer stem cell hypothesis in humans, given that clonal analysis indicated that the relapse and subsequent death of the patient were attributed to the progeny of a single leukemic blast cell with extensive replicative capacity, both in culture and in vivo. These findings illustrate the need for improved manufacturing technologies that can purge residual contaminating tumor cells from engineered T cells.
Methods
Patient and healthy donor samples.
The trial in which this patient participated was conducted at the Children’s Hospital of Philadelphia and the Hospital of the University of Pennsylvania and has been reported previously (NCT01626495)19,20. Clinical samples (peripheral blood and bone marrow) were obtained at the clinical practices of the University of Pennsylvania and the Children’s Hospital of Philadelphia under an Institutional Review Board (IRB)-approved protocol (Product Development and Correlative Sciences Laboratory at the University of Pennsylvania). Deidentified normal donor peripheral blood specimens or CD4+ and CD8+ peripheral T cells were obtained from the Human Immunology Core of the University of Pennsylvania. All subjects provided written informed consent according to the Declaration of Helsinki and the International Conference on Harmonization Guidelines for Good Clinical Practice. All ethical regulations were followed. The clinical manufacturing of CTL019 cells was done as previously described19. Production of CAR-expressing T cells for the research experiments was performed as previously described6,21. Primary leukemia cells at baseline and relapse after CTL019 were expanded in NSG mice.
Lentiviral constructs.
The murine anti-CD19 chimeric antigen receptor (CD8 hinge, 4–1BB co-stimulatory domain and CD3 zeta signaling domain) was generated as previously described20. This is the same construct used to manufacture CTL019. We generated anti-CD22 CAR constructs using the published m971 and HA22 scFv clones14,17 via cloning into the same backbone as CAR19 (CD8 hinge, CD8 transmembrane, 4–1BB costimulatory and CD3ζ, signaling domains). We generated the pTRPE CD19.BBz.mCherry fusion construct by amplifying mCherry from a commercially available mCherry vector (Clontech) and cloning the PCR product into the pTRPE lentiviral vector. The CD19–GFP fusion construct was synthesized (GeneArt, Thermo Fisher) on the basis of relevant sequence literature22,23, amplified by PCR, and cloned into the pTRPE lentiviral vector.
Cell lines.
The NALM6 well line was originally obtained from DSMZ (Braunschweig, Germany). The cell line was tested for the presence of mycoplasma contamination (MycoAlert Mycoplasma Detection Kit, LT07–318, Lonza, Basel, Switzerland). For luciferase-based cytotoxicity assays and in vivo mouse models, NALM6 was lentivirally transduced to constitutively express click-beetle-green luciferase and then sorted to obtain a > 99% positive population. In the NALM-6 CD19– line, endogenous CD19 was knocked-out using CRISPR–Cas9 as described3. Ectopic expression of CAR or antigen was delivered via pTRPE or pELPS lentiviral vectors. Daughter cell lines were then sorted on the basis of transgene expression, which was periodically checked by flow cytometry during passaging and always confirmed immediately before experimental assays. All cell lines were maintained in RPMI-1640 medium supplemented with 10% FBS (Sigma).
Inducible CAR expression model.
NALM-6 pLVX CAR19BBz-mCherry.
Parental NALM-6 (CD19+) cells were transduced with pLVX.CD19BBz.mCherry lentivirus, treated with 1 μg/ml doxycycline (Takara Bio USA, 631311), and sorted 48 h following doxycycline treatment on the basis of mCherry expression (>99% purity)24. This cell line was maintained in RPMI-1640 medium supplemented with tetracycline-free FBS (Takara Bio USA, 631101). All experiments involving this cell line were performed 48 h following doxycycline treatment (1 μg/ml).
Polychromatic flow cytometry.
Flow cytometry was performed as previously described6. In the terminology used in this manuscript, CART19 refers to all CAR T cell products directed against CD19, CTL019 refers to the Penn/Novartis-developed murine CART19 product, and CAR19 refers to the chimeric antigen receptor itself. CD19 protein expression was studied by flow cytometry and confocal microscopy using the following CD19-specific monoclonal antibodies: 0TI3B10 (Origene no. TA506236), HIB19, SJ25-C1, BU12, CB19, J3–119 and EPR5906 (AbCam no. ab134114). An Alexa Fluor-647-conjugated anti-idiotype monoclonal antibody (kindly provided by B. Jena and L. Cooper)25 and unconjugated anti-idiotype mAb (kindly provided by Novartis) followed by Alexa-Fluor-647-conjugated goat-anti-human IgG Fcγ (Jackson ImmunoResearch no. 109–606-170) were used in flow cytometry assays. Detection of CAR22 was performed using CD22-Fc/His (Sino Biologicals no. 11958-H08H) and anti-His-APC (R&D no. IC050A) or phycoerythrin (PE; AbCam no. ab72467) or CD22 protein conjugated directly to PE. HA22 CARs were detected by staining cells with biotinylated α-murine F(ab)2 (Jackson ImmunoResearch no. 115–065-072) followed by staining with streptavidin-PE (BD Pharmingen no. 554061). The following monoclonal antibodies were used for antigen detection: anti-CD3-APC-H7 (SK7, BD Pharmingen no. 641406), anti-CD4–BV785 (0KT4, BioLegend no. 317442), anti-CD8a–PE–Cy5.5 (RPA-T8, Thermo Fisher Scientific no. 15–0088-42), anti-CD10–PE–Cy7 (eBioCB-CALLA, Thermo Fisher Scientific no. 25–0106-42), anti-CD14–V500 (M5E2, BD Horizon no. 561391), anti-CD19–BV510 (HIB19, BioLegend no. 302242), anti-CD19–Pac Blue (SJ25-C1, Thermo Fisher Scientific no. MHCD1928), anti-CD19–FITC (BU12, LifeSpan Biosciences no. LS-C134319–120), anti-CD19–PE (CB19, Abcam no. ab1255), anti-CD19–PerCP–eF710 (J3–129, Thermo Fisher Scientific no. 46–0197-42), anti-CD19–APC (J3–119, Beckman Coulter no. IM2470), anti-CD19–BV785 (HIB19, BioLegend no. 302240), anti-CD22-PE–Cy7 (HIB22, BioLegend no. 302514) anti-CD22–PE (HIB22, BioLegend no. 302506), anti-CD22–PE (SHL-1, BioLegend no. 363504), anti-CD22–PE (RFB-4, Thermo Fisher Scientific no. MHCD2205), anti-CD45–BV421 (HI30 BioLegend no. 304032), anti-CD56–PE (CMSSB, Thermo Fisher Scientific no. 50–104-26), and anti-NRP1–BV421 (12C2, BioLegend no. 354514). Alexa 488–conjugated goat anti–rabbit IgG (Abcam no. ab150077) was used as secondary antibody. In all analyses, the population of interest was gated on the basis of forward versus side scatter characteristics followed by singlet gating, and live cells were gated using LIVE/DEAD Fixable Aqua (Invitrogen); time gating was included for quality control (Supplementary Fig. 11). Flow cytometry was performed on an LSRII or a four-laser Fortessa-LSR II cytometer (Becton-Dickinson) or a 4-color Becton Dickinson (BD) Accuri flow cytometer or a 4-color FACSCalibur (BD). Flow cytometry standard (FCS) files were analyzed with FlowJo X 10.0.7r2 (FlowJoLLC) or the Accuri C6 software (BD). Cell lines were sorted on a BD Influx Cell Sorter (BD Biosciences). All stains were performed in PBS supplemented with 3% FCS (Sigma) and incubated for 30 min at 4 °C. Cells were washed 2 or 3 times between stains. The Cytofix/Cytoperm kit (BD) was used for intracellular staining.
Quantitative real-time PCR.
RNA was isolated from cell line pellets using an RNAeasy isolation kit (Qiagen) or Ambion RiboPureTM- Blood Kit (Thermo Fisher). Total RNA was converted to cDNA with a SuperScript III First-Strand Synthesis System (Thermo Fisher) or iScript Reverse Transcription Supermix for quantitative real-time PCR (qPCR; Bio-Rad). qPCR was performed in triplicate wells with TaqMan Gene Expression Master Mix on a ViiA 7 Real-Time PCR System or on a 7500Fast Real-Time PCR System (Applied Biosystems), per the manufacturer’s instructions. CD19 expression was normalized to GAPDH expression levels in the same wells by use of gene-specific probes labeled with compatible reporter dyes (FAM and VIC). The following TaqMan assays were used (all from ABI): Hs01047410_g1 (CD19 exons 1–2), Hs01047409_g1 (CD19 exons 14–15), Hs00826128_m1 (NRP1), Hs01120557_m1, PCCA (exons 16–17), Hs00165407_m1, PCCA (exons 20–21), Hs99999908_m1, (GUSB), and Hs00168719_m1 (PPIB). CD19 expression was normalized to GUSB and PPIB expression levels. All probes used are commercially available (Applied Biosystems). For the clinical trial, in vivo kinetics of CAR-modified cells was assessed as described7,19 using validated PCR primers specific to the 4–1BB and CD3ζ fusion gene. Replication-competent lentivirus was analyzed using a primerprobe set specific for vesicular stomatitis virus G protein (VSV-G) in a validated assay, as described8.
Lentiviral integration site analysis.
The frequency and location of CAR19 integration into genomic loci were assessed and analyzed using established methodologies26. Briefly, genomic DNA specimens were prepared for Illumina sequencing by linker-mediated PCR (LM–PCR). This process begins by randomly shearing the DNA, followed by end-repair and linker ligation. The ligation product is separated into at least four replicates and amplified through a nested LM–PCR, adding replicate-specific 12-bp Golay barcodes and Illumina adapter sequences. Undesired amplification products arising from vector LTR regions are inhibited by the use of a non-natural vector-specific blocking oligonucleotide. Amplified products were pooled equivalently across samples for library construction, and template concentration was assessed by Kapa library quantification qPCR. Paired-end sequencing was performed on the Illumina MiSeq, and Fastq output files were subsequently used as input for INSPIIRED, a full computational pipeline to determine the location and abundances of vector integration sites. During processing, genomic sequences are aligned to the human genome by BLAT (hg38, version 35, > 95% identity match score). The abundance of cell clones identified from integration site data was determined using the SonicAbundance method27. A detailed Standard Operating Procedure can be found in ref. 26. The following abbreviations are used to denote sample cell type: INP or IP, Infusion product; PBL, peripheral blood lymphocytes; and BM, bone marrow. Clones were binned as ‘Low Abundance’ if below 0.04% (INP), 0.1% (PBL), and 0.07% bone marrow cutoff. Symbols next to gene names mean the following: ‘*’ indicates that the integration site is within a transcriptional unit, ‘~’ indicates that the integration site is within 50 kb of a cancer-related gene, and ‘!’ indicates that the gene is associated with human lymphoma. The numbers of inferred cells identified for each sample in the analysis and the total number of unique sites identified are tabulated toward the top of the plot. In addition, PCR primer sets were designed to confirm the relapse-associated integration sites using qPCR. Samples for detection included bulk genomic DNA samples and single-cell genome-amplified DNA samples. Primers targeted genomic DNA by amplifying from the vector-LTR to flanking genomic sequence as well as exon-intron boundaries for control genes (actB and gapDH). Primer sequences are displayed in the Supplementary Table 6. Reactions were formulated with KAPA qPCR SYBR master mix, 1 × Qiagen Q-solution (betaine containing solution), 500 nM primers (final concentration for each), and approximately 15 ng of host DNA (~2,300 genomes). PCR conditions were as follows: 1 min initial DNA melt and 40 cycles of 30 s at 95 °C, 30 s at 65 °C, and 45 s at 72 °C. Standards for each template were generated as gBlock fragments from Integrated DNA Technologies (IDT, Coralville, IA) and were run alongside the patient samples in triplicate at concentrations ranging from 0.01 fM to 0.1 pM. Reaction efficiencies were determined at 92%, 84%, 76%, and 82% for NRP1, PCCA, ACTB, and GAPDH, respectively.
In single-cell analysis experiments, relapse cells were sorted into single-cell reactors using the Fluidigm C1 and assayed using five PCR assays, which detected the NRP1–host junction, PCCA–host junction, the B-actin gene, the GAPDH gene, and the CAR19 vector. Multiple-strand displacement amplification was used to amplify the genome of each cell individually. Approximately 20 μL of sample was recovered and used in subsequent PCR reactions. Analysis of wells visually confirmed to contain single cells (n = 71) showed nine cases for which all five assays were positive (Supplementary Fig. 2). Thus, we concluded that the two integration sites are found together in clonal decedents of a single cell. In other wells (n = 20), single cells were positive for subsets of the five assays. For cases for which a single integration site junction was positive (n = 17), we interpreted the result to be due to inefficient detection by PCR of the other integration site. This was not surprising, given the inherent challenges associated with whole-genome amplification from single cells28.
Next-generation immunoglobulin heavy chain sequencing.
Deep sequencing was performed on genomic DNA purified from bone marrow samples, apheresis products, and bulk cellular infusion products (Adaptive Biotechnologies). CAR-expressing cells from the cellular infusion products were also FACS-sorted and subjected to the same analysis. Furthermore, CD10+CD19+CD45dim leukemic cells were sorted from pre-CTL019 manufacturing aphereses of patients, pooled, and diluted in log dilutions into a normal donor CTL019 product immediately before DNA isolation. DNA was then subjected to IgH-seq analysis. All sequencing data were analyzed using the ImmunoSeq Analyzer (Adaptive Biotechnologies).
Integrated RNA and DNA sequencing for mutation detection.
sDNA was extracted according to manufacturer’s instructions (Promega). DNA was checked for quantity (Picogreen), fragment length (Agilent TapeStation), and SNPType (Fluidigm panel). Normalized aliquots of tumor tissue DNA were captured using Agilent Sureselect for whole-exome enrichment and sequenced on the Illumina HiSeq 2500 to a target coverage of 100×. Quality-control metrics were assessed as described above. Quality-control metrics were assessed to ensure high-quality data were obtained, including data quality and GC content on per-base and per-sequence levels, sequence length distribution and duplication levels, and insert size distribution. Reads were aligned to the reference human genome (build hg19) using the Burrows–Wheeler Aligner (BWA–MEM)29. Initial BAM files were cleaned with Picard to mark PCR duplicates (http://picard.sourceforge.net). Then, Genome Analysis ToolKit (Broad Institute) was used for local realignment and recalibration of base-quality score30,31. After processing, a number of quality-control metrics were assessed to ensure high-quality data were obtained, including the percentage of reads aligning, the percentage of on-target reads, and mean bait coverage.
Total RNA was extracted according to the manufacturer’s instructions (Qiagen). Integrity was checked on the Agilent TapeStation (RIN), followed by preparation for sequencing using the TruSeq RNA v2 prep (Illumina). High-throughput sequencing was performed on an Illumina HiSeq 2500 platform to a target depth of 50 million paired-end reads. FASTQ files were processed for data quality control, read mapping, transcript assembly, and transcript abundance estimation. Quality control metrics assessment and read alignment were performed as described above.
For both RNA and DNA data, single nucleotide variants (SNVs) were identified with MUTECT19, and indels were called using Pindel. Annotation and filtering of observed SNVs and indels were performed using the Single Nucleotide Polymorphism database (dbSNP)32 and Catalogue of Somatic Mutations in Cancer (COSMIC)33 databases. RNA-seq data were also used to look for alternative splicing and exon skipping.
Confocal microscopy.
Patient #107 leukemic cells from baseline and relapse were treated with cell adhesion solution (Crystalgen) according to the manufacturer’s instructions and applied on the No. 1.5 glass slides. Then cells were fixed with 2% paraformaldehyde for 20 min and permeabilized with 0.1% Triton X-100 (Roche) for 15 min at room temperature, stained with Dylight488-conjugated mouse antihuman CD19 (Clone: 0TI3B10, Origene) or rabbit anti–human CD19 (EPR5906, Abcam) for 1 h followed by secondary antibody Alx488-conjugated goat anti–rabbit IgG (Abcam) for 30 min, and then stained with the primary antibody for FMC63 scFv idiotype for 1 h and secondary antibody goat anti–human IgG Fcγ-Alexa Fluor 647 for 30 min at room temperature. Finally, the cells were counterstained with DAPI and used for confocal images, using a 63 × oil immersion lens on a Leica TCS SP8 Laser Scanning confocal microscope (Leica Microsystems) at the University of Pennsylvania Electron Microscopy Resource Laboratory. Images were later analyzed with Fiji software (ImageJ). Fluorescently tagged CAR19-BB-ζ and CD19 lentiviral constructs were generated by introducing in-frame fusions of mCherry and GFP, respectively, using standard molecular cloning. T cells were cocultured with Cell Trace Violet+ NALM6 at a 1:1 effector:target ratio for 2 h on poly-D-lysine-coated glass coverslips. Cells were washed, fixed with 4% paraformaldehyde, and mounted onto slides with ProLong Diamond Antifade Mountant (ThermoFisher).
CAR T cell functional assays.
In vitro cytotoxicity assays and cytokine measurements were performed as previously described6,34.
Animal studies.
In vivo experiments were performed as previously described21. NSG mice originally obtained from Jackson Laboratories were purchased and maintained by the Stem Cell and Xenograft Core of the University of Pennsylvania and by the Children’s Hospital of Philadelphia Animal Facility. Cells (leukemia cell lines or T cells) were injected in 100–200 μl of PBS at the indicated concentration into the tail veins of mice. The establishment and maintenance of primary B-ALL in mice was previously described35,36. Bioluminescent imaging was performed using a Xenogen IVIS-200 Spectrum camera and analyzed with LivingImage software v. 4.3.1 (Caliper LifeSciences). Animals were euthanized at the end of each experiment or when they met prespecified endpoints according to the Institutional Animal Care and Use Committee (ACUC) protocols. Animal experiments were performed according to a protocol (no. 803230), approved by the IACUC at the University of Pennsylvania and Children’s Hospital of Philadelphia, that adheres to the NIH Guide for the Care and Use of Laboratory Animals.
Statistical analysis.
All statistics were performed using GraphPad Prism 6.05 (GraphPad Software, Inc.). A Student’s t-test was used to compare two groups; in the analyses in which multiple groups were compared, one-way ANOVA was performed with Holm–Sidak correction for multiple comparisons. When multiple groups at multiple time points or ratios were compared, the Student’s t- test or ANOVA for each time point or ratio was used. Survival curves were compared using the log-rank test. Asterisks are used in each figure to represent P values (*P <0.05, ** P<0.01, ***P<0.001, ****P< 0.0001), and n.s. indicates not significant (P > 0.05).
Supplementary Material
Acknowledgements
The authors would like to thank the staff in the Product Development and Correlative Sciences laboratory for helpful discussions and analytical support, staff in Clinical Cell and Vaccine Production Facility for manufacturing and analytical support, and staff in the Stem Cell and Xenograft Facility for animal support (University of Pennsylvania, Philadelphia, PA). The authors would like to thank E. Sotillo and A. Thomas-Tikhonenko (Children’s Hospital of Philadelphia, PA) for providing the CD19 CRISPR-Cas9 knock-out NALM-6 cells and B. Jena and L. Cooper (MD Anderson Cancer Center, Houston, TX) for providing the Alexa-Fluor-647-conjugated anti-idiotype antibody. The chimeric antigen receptor used in this study was obtained under a Material transfer agreement (MTA) from Campana and Imai at St. Jude Children’s Research Hospital and was subsequently modified by cloning into a lentiviral vector and expressed with a eukaryotic promoter. This work was supported by grants from the University of Pennsylvania–Novartis Alliance (principal investigator (PI), C.H.J), National Institutes of Health (NIH) 5R01CA120409 (PI, C.H.J), the EMD–Serono Cancer Immunotherapy Clinical Fellowship by the Society for Immunotherapy of Cancer (SITC) (PI, M.R.), the Bristol–Myers Squibb Oncology Fellowship in Clinical Cancer Research by the American Association for Cancer Research (AACR) (PI, M.R.), the Gabrielle’s Angel Foundation (PI, M.R.; PI, D.M.B.; and PI, J.A.F.), the SIES–AIL fellowship by the Italian Society for Experimental Hematology and the Italian Leukemia Association (PI, M.R.), the ASH-Scholar Award (PI., M.R.), NIH NCI 1K99CA212302–01A1 (PI, M.R.), NIH NCI P01CA214278–01 (PI, C.H.J.) the St. Baldrick’s Foundation Scholar Award (PI, D.M.B.) and NCI T32CA009140 (J.A.F).
Footnotes
Competing interests
C.H.J., J.J.M., M.R., J.S., J.A.F., R.M.Y., and S.I.G. work under a research collaboration involving the University of Pennsylvania and the Novartis Institutes of Biomedical Research, Inc. and are inventors of intellectual property (IP) licensed by the University of Pennsylvania to Novartis. C.L.N. has IP in a CART-related patent. B.L.L. is a consultant for CRC Oncology, Cure Genetics, Novartis and a member of the Scientific Advisory Board for Brammer Bio, Incysus, Avectas. B.L.L. is the founder of and has equity in Tmunity Therapeutics and receives Research Funding from Novartis and Tmunity.
S.F.L. receives Novartis, Tmunity and Parker Institute for Cancer immunotherapy research funding and has CART-related IP. S.A.G. discloses Novartis research funding and consultancy. E.O. and H.B. are employed by Novartis. All the other authors have no competing interests.
Data availability
All requests for raw and analyzed data and materials are promptly reviewed by the University of Pennsylvania Center for Innovation to see whether the request is subject to any intellectual property or confidentiality obligations. Patient-related data not included in the paper were generated as part of clinical trials and may be subject to patient confidentiality. Any data and materials that can be shared will be released via a Material Transfer Agreement. All raw and analyzed sequencing data can be found at the NCBI Sequence Read Archive (accession number: SRP155722; analyses of lentiviral integration sites, RNA sequencing and DNA sequencing of genes potentially associated with CD19– relapse) and Adaptive Biotechnologies’ immuneACCESS database (http://clients.adaptivebiotech.com/pub/Ruella-2018-naturemedicine).
Additional information
Supplementary information is available for this paper at https://doi.org/10.1038/s41591–018-0201–9.
Reprints and permissions information is available at www.nature.com/reprints.
Publisher’s note: Springer Nature remains neutral with regard to jurisdictional claims in published maps and institutional affiliations.
Online content
Any methods, additional references, Nature Research reporting summaries, source data, statements of data availability and associated accession codes are available at https://doi.org/10.1038/s41591–018-0201–9.
References
- 1.Maude SL et al. N. Engl. J. Med. 378, 439–448 (2018). [DOI] [PMC free article] [PubMed] [Google Scholar]
- 2.June CH & Sadelain MN Engl. J. Med. 379, 64–73 (2018). [DOI] [PMC free article] [PubMed] [Google Scholar]
- 3.Sotillo E et al. Cancer Discov. 5, 1282–1295 (2015). [DOI] [PMC free article] [PubMed] [Google Scholar]
- 4.Gardner R et al. Blood 10.1182/blood-2015-08-665547 (2016). [DOI]
- 5.Ruella M & Maus MV Comput. Struct. Biotechnol. J. 14, 357–362 (2016). [DOI] [PMC free article] [PubMed] [Google Scholar]
- 6.Ruella M et al. J. Clin. Invest. 126, 3814–3826 (2016). [DOI] [PMC free article] [PubMed] [Google Scholar]
- 7.Mueller KT et al. Blood 128, 220 (2016). [Google Scholar]
- 8.Marcucci KT et al. Mol. Ther. 26, 269–279 (2018). [DOI] [PMC free article] [PubMed] [Google Scholar]
- 9.Meyerson HJ et al. Am. J. Clin. Pathol. 137, 39–50 (2012). [DOI] [PubMed] [Google Scholar]
- 10.Soker S, Takashima S, Miao HQ, Neufeld G & Klagsbrun M Cell 92, 735–745 (1998). [DOI] [PubMed] [Google Scholar]
- 11.van Zelm MC et al. J. Clin. Invest. 120, 1265–1274 (2010). [DOI] [PMC free article] [PubMed] [Google Scholar]
- 12.Friederike Braig A. B. Blood 10.1182/blood-2016-05-718395 (2016). [DOI]
- 13.Fry TJ et al. Nat. Med. 24, 20 (2018). [DOI] [PMC free article] [PubMed] [Google Scholar]
- 14.Ruella M et al. Blood 130, 807 (2017). [Google Scholar]
- 15.Salvatore G, Beers R, Margulies I, Kreitman RJ & Pastan I Clin. Cancer Res. 8, 995–1002 (2002). [PubMed] [Google Scholar]
- 16.Xiao X, Ho M, Zhu Z, Pastan I & Dimitrov DS mAbs 1, 297–303 (2009). [DOI] [PMC free article] [PubMed] [Google Scholar]
- 17.Haso W et al. Blood 121, 1165–1174 (2013). [DOI] [PMC free article] [PubMed] [Google Scholar]
- 18.Grupp SA et al. N. Engl. J. Med. 368, 1509–1518 (2013). [DOI] [PMC free article] [PubMed] [Google Scholar]
- 19.Maude SL et al. N. Engl. J. Med. 371, 1507–1517 (2014). [DOI] [PMC free article] [PubMed] [Google Scholar]
- 20.Milone MC et al. Mol. Ther. 17, 1453–1464 (2009). [DOI] [PMC free article] [PubMed] [Google Scholar]
- 21.Ruella M et al. Clin. Cancer Res. 22, 2684–2696 (2016). [DOI] [PubMed] [Google Scholar]
- 22.Zhang G, Gurtu V & Kain SR Biochem. Biophys. Res. Commun. 227, 707–711 (1996). [DOI] [PubMed] [Google Scholar]
- 23.Tedder TF & Isaacs CM J. Immunol. 143, 712–717 (1989). [PubMed] [Google Scholar]
- 24.Heinz N et al. Hum. Gene Ther. 22, 166–176 (2011). [DOI] [PubMed] [Google Scholar]
- 25.Jena B et al. PLoS ONE 8, e57838 (2013). [DOI] [PMC free article] [PubMed] [Google Scholar]
- 26.Sherman E et al. Mol. Ther. Methods Clin. Dev. 4, 39–49 (2016). [DOI] [PMC free article] [PubMed] [Google Scholar]
- 27.Berry CC et al. Bioinformatics 28, 755–762 (2012). [DOI] [PMC free article] [PubMed] [Google Scholar]
- 28.Swennenhuis JF, Reumers J, Thys K, Aerssens J & Terstappen LW Genome Med. 5, 106 (2013). [DOI] [PMC free article] [PubMed] [Google Scholar]
- 29.Li H & Durbin R Bioinformatics 25, 1754–1760 (2009). [DOI] [PMC free article] [PubMed] [Google Scholar]
- 30.McKenna A et al. Genome Res. 20, 1297–1303 (2010). [DOI] [PMC free article] [PubMed] [Google Scholar]
- 31.DePristo MA et al. Nat. Genet. 43, 491–498 (2011). [DOI] [PMC free article] [PubMed] [Google Scholar]
- 32.Sherry ST et al. Nucleic Acids Res. 29, 308–311 (2001). [DOI] [PMC free article] [PubMed] [Google Scholar]
- 33.Forbes SA et al. Nucleic Acids Res. 43, D805–D811 (2015). [DOI] [PMC free article] [PubMed] [Google Scholar]
- 34.Kalos M et al. Sci. Transl. Med 3, 95ra73 (2011). [DOI] [PMC free article] [PubMed] [Google Scholar]
- 35.Barrett DM et al. Blood 118, e112–e117 (2011). [DOI] [PMC free article] [PubMed] [Google Scholar]
- 36.Imai C et al. Leukemia 18, 676–684 (2004). [DOI] [PubMed] [Google Scholar]
Associated Data
This section collects any data citations, data availability statements, or supplementary materials included in this article.