Abstract
The Reference Phantom Method for computing the acoustic attenuation and backscatter has become widespread. However, clinical application of these methods has been limited due to the need to acquire reference phantom data. We demonstrate that the data acquired from 11 transducers of the same model, and five clinical ultrasound systems of the same model produce equivalent estimates of reference phantom power spectra. We show that the contribution to power spectral density variance among systems and transducers equals that from speckle variance with 59 uncorrelated echo signals. Thus, when the number of uncorrelated lines of data is small, speckle variance will dominate the PSD estimate variance introduced by different systems and transducers. These results suggest that, at least for this particular transducer and imaging system combination, one set of reference phantom calibration data is highly representative of the average among equivalent transducers and systems that are in good working order.
Keywords: Reference Phantom Method, Tissue Characterization
Introduction
The Reference Phantom Method (RPM) is a simple approach to compute quantitative ultrasound backscatter parameters such as attenuation and the backscatter coefficient (BSC) (Yao et al., 1990). The RPM has been used for over 20 years in the laboratory and clinic (Hall et al., 1996; Nam et al., 2012, 2013) and has been shown to provide system independent estimates of attenuation and the BSC (Nam et al., 2012). The list of potential clinical applications is vast (Insana et al., 1989; Insana and Hall, 1990; Lin et al., 2015; McFarlin et al., 2015; Mottley et al., 1984; Holland et al., 2004; Gibson et al., 2009; Feleppa et al., 2004; Mamou et al., 2011; Ghoshal et al., 2014; Yuan and Shung, 1988). Clinical implementation of the RPM has been slow, hindered by the need to scan a well calibrated reference phantom with the same clinical equipment and settings used to acquire data from the patient (Oelze and Mamou, 2016).
In a recent review of QUS backscatter parameters, Oelze and Mamou suggested that it may be possible to remove the need for a physical reference phantom through “… an extra step … to collect data from reference phantoms and save it into the system so that it could readily be used for QUS calibration with the same system” (Oelze and Mamou, 2016). The process of collecting reference phantom calibration data for a single transducer is non-trivial. One needs to ensure that the speed of sound of the reference phantom is close to that of the tissue (Nam et al., 2011) as well as ensuring consistent system settings between tissue and reference phantom data acquisition (Yao et al., 1990).
Each user calibrating their own individual system and transducer is clearly possible, but it would be immensely more efficient to have a set of reference power spectra loaded into the system by the manufacturer to be used for a specific combination of systems of a specific model, transducer, and specific system configuration. But a limited set of configurations could be defined — much as they are now for performing shear wave elasticity imaging.
This manuscript compares the power spectra obtained from a commercial ultrasound phantom using a set of equivalent (same manufacturer and model number) ultrasound systems and transducers to determine the variability among them. The results demonstrate that among this set of systems and transducers, there was minimal variability in power spectra. To explore the implications of using representative power spectra, we derived the theoretical variance of the attenuation and backscatter coefficient estimates taking into account components of variance among systems and transducers of the same model. We found that the relative contribution of system and transducer variance depended upon the number of uncorrelated echo signals used in power spectral averaging, and that, for typical clinical scanning conditions, components of power spectrum estimate variance from systems and transducers are negligible compared to the variance from echo signal variation caused by the underlying scattering stochastic process. These results suggest that an “average power spectrum” could be obtained from a small set of equivalent systems and transducers, and that the average power spectrum could be used in Reference Phantom Method calculations without the need to scan a reference phantom with each study, with negligible increase in QUS parameter estimate variance. The methods described here can be replicated with other systems and/or transducers to validate and extend the findings.
Methods
This study was designed to determine whether variability in clinical ultrasound system or transducer performance was significant in power spectra estimated from a commercial ultrasound phantom. Power spectral estimation using pulse-echo ultrasound, under ideal conditions, is a sampling process whose distribution is determined by the number of independent acoustic A-lines used in power spectral estimation (Lizzi et al., 2006). The differential performance of systems and transducers is assumed to result in a distribution of power spectral estimates that may be modeled, to a first approximation, as a zero-mean normal distribution with unknown variance. The unknown variance represents the impact of small differences in manufacturing of systems and transducers on their performance. Identifying the impact of system and transducer performance variability on power spectral estimate variability can be reduced to comparing the estimated distribution of power spectral estimates among systems and transducers to the distribution of power spectral estimates predicted by theory for the random scattering process.
Radio Frequency Echo Signal Data Acquisition
Eleven Siemens 6C1 curved linear array transducers (Siemens Medical Solutions USA, Inc., Malvern, PA, USA) and five Siemens Acuson S3000 systems (all running the same version of system software) were used to collect radiofrequency (RF) echo data from a Gammex Sono403™ Multi-Purpose phantom (Gammex/RMI, Middleton, WI, USA). The Gammex Sono403 phantom consists of small (compared to the ultrasound wavelength) spherical scatterers (Madsen and Frank, 1997) suspended in gelatin with “wire” and cylindrical targets at various intervals and depths. The phantoms have a specific attenuation of 0.5 dB·cm−1MHz−1 in the 2–18 MHz frequency range. A region in the background medium, well away from imaging targets in the phantom, was chosen to obtain “reference phantom data.” The transducer and system serial numbers and approximate time in service are shown in Table 1.
Table 1:
The serial numbers (S/N) and respective time in service for the transducers and imaging systems used in this study. Dashes represent transducers whose time in service was unknown.
| 6C1 | |
|---|---|
| S/N | Time in Service (Years) |
| 003E0102 | - |
| 11500100 | - |
| 12000107 | - |
| 12000121 | - |
| 12400137 | - |
| 12500152 | - |
| 22290006 | 5 |
| 33430019 | - |
| 44138037 | - |
| 44541015 | 3 |
| 51613052 | 2 |
| S3000 | |
| S/N | Time in Service (Years) |
| 200206 | 9 |
| 200215 | 8 |
| 200009 | 5 |
| 202558 | 4 |
| 211188 | 2 |
Transducers were secured in a holder attached to a translation stage. The apex of the curved transducer face was aligned perpendicularly to the phantom scanning window. Acoustic coupling was achieved using room temperature saline. RF echo signal data was collected using the Axius Direct Ultrasound Research Interface (Brunke et al., 2007). All RF echo signal data was sampled at 40 MHz. System and transducer settings were the same for all RF data acquisitions. The elevational focus of the 6C1 was at 6 cm depth. The transducer’s electronic focus was set to 7 cm, and the transducer was excited with a single-cycle 2.5 MHz pulse.
Thirty frames of RF echo signal data were collected for each transducer or system tested. Each RF echo frame consisted of a curved-linear RF echo acquisition with 6323 axial time samples and 336 equally (angular) spaced A-lines with a depth of 12 cm. Care was taken, using the locations of the wire and cylindrical targets in the Gammex Sono403 phantom, to ensure that the RF echo data acquired for each transducer or system had similar spatial location. RF echo frames were separated by an elevational distance of 1.5 mm, a distance greater than the elevational beam width, to assure independent realizations of speckle. An example B-mode image of the Gammex Sono403 phantom is shown in Figure 1.
Figure 1.
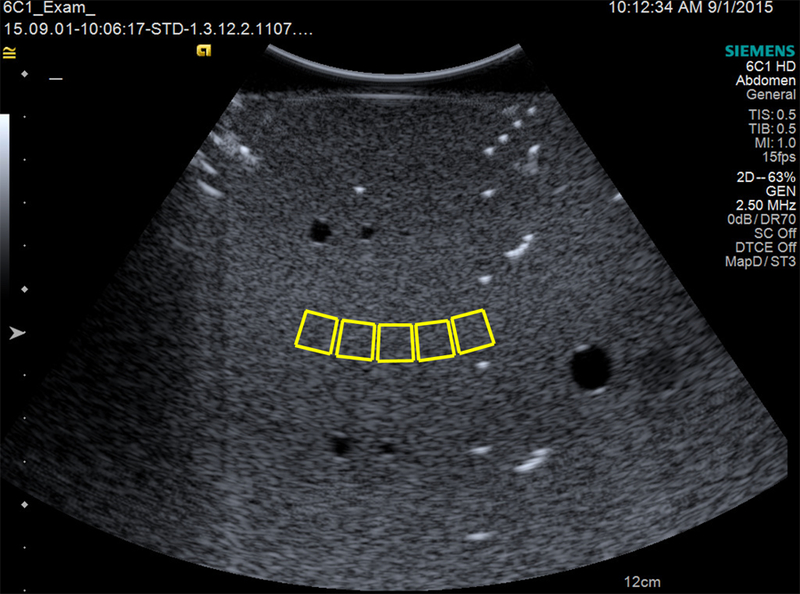
A B-Mode image of the Gammex Sono403™ phantom using the 6C1 transducer. The approximate regions of interest for our analysis are shown by the solid boxes.
Power Spectral Estimation
Power spectrum bias and variance depends on the axial and lateral size of the power spectral estimation region as well as the choice of power spectral estimation method (Thomson, 1982). The size of the power spectral estimation region (PSER) was chosen by measuring the axial and lateral pulse echo correlation lengths using the methods of Thijssen (Thijssen, 2003). The estimated axial and lateral pulse echo correlation lengths were 471 µm and 1134 µm, respectively. Power spectra were estimated using a 6 mm×6 mm power spectral estimation region and a zeroth order discrete prolate spheroidal sequence taper (Thomson, 1982). Each PSER contained 12 (axial) × 5 (lateral) independent samples (correlation cells), numbers sufficient to provide unbiased estimates of power spectra (Rosado-Mendez et al., 2013). Power spectral estimates from either one or five PSERs in each of 30 independent RF frames were averaged into a single power spectral estimate for each transducer and system.
Usable Bandwidth
Estimating QUS parameters, such as attenuation and backscatter coefficients, requires selection of a usable frequency bandwidth that contains significant power above an estimate of the noise floor. The usable bandwidth varies with the operating frequency of the transducer and the depth of the QUS parameter estimation region. Frequency bandwidths are often chosen to be the frequency range that is 10 dB above the noise floor. Power spectra estimated at the regions of interest exhibited frequency-dependent noise (see Figure 2), therefore the noise floor was estimated by a linear fit of the power spectral values in the combined 0.25–1.0 MHz and 7–20 MHz frequency ranges. For the 6C1 transducer at 7 cm depth into the Gammex Sono403 phantom, the +10 dB bandwidth (10 dB above the linear fit to the noise floor) spans the frequency range 1.5–4.9 MHz.
Figure 2.
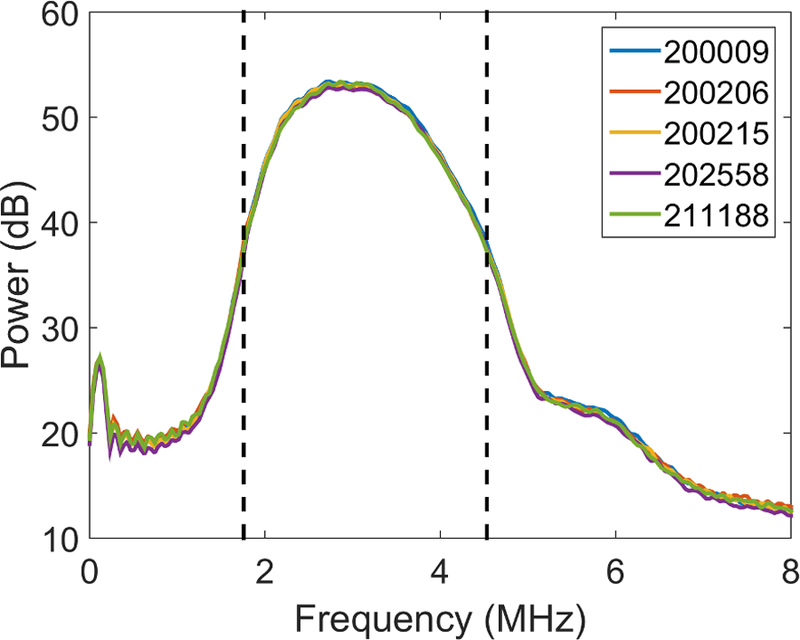
The power spectrum estimates for a 6C1 transducer (S/N: 12500152) and each of five Acuson S3000 systems using 750 uncorrelated A-lines. The dashed vertical lines represent the analysis bandwidth that is +10 dB above the noise floor (1.5–4.9 MHz).
Expected Distribution for Power Spectra Estimated from a Reference Phantom
Ultrasound backscatter from diffuse Rayleigh scatterers is a stochastic process that depends on the relative phase of the echo signal from each discrete scattering source in the pulse volume (Wagner et al., 1987). Since the scattering sources are randomly distributed in the volume of the phantom, the received echo signal will vary with subtle differences in transducer position. Therefore, power spectral estimation for characterizing the phantom, or accounting for system dependencies in the Reference Phantom Method, requires obtaining several independent observations of the echo signal (“speckle”) and averaging their power spectra, to approximate the expected power spectrum.
The distribution of power spectral density estimates depends on the number of independent acoustic A-lines (N) used in estimation (Lizzi et al., 2006). When N ≫ 1, the estimated power spectra are normalized to their ‘expected value’, and the logarithm is computed, the distribution for power spectral density estimates is a zero-mean normal distribution whose bias and variance depend on N (Lizzi et al., 2006). The distribution for power spectral density estimates may be written (assuming N ≫ 1):
| (1) |
where DD is the power spectral density distribution, PSi is the normalized average power spectrum (among all uncorrelated RF echo signal A-lines) from system or transducer i, the symbol ∼ means ‘is distributed as,’ refers to a normal distribution with mean µ and variance σ2, µ(f) is the expected power spectral value at frequency f, and N is the number of independent acoustic A-lines used to estimate the power spectrum. Using the estimated lateral correlation length (1134 µm, stated above), N =150 for one power spectral estimation region (PSER; 5 independent A-lines per PSER, 30 independent RF frames) and N =750 for five PSER (5 independent A-lines per PSER, 5 PSER per frame, 30 independent RF frames).
Statistical Framework
The power spectral density distribution (DD) for one system s and one transducer t from a collection of systems, S, and collection of transducers, T, at frequency f may be written as:
| (2) |
where NS(f) and NT(f) are random variables representing the noise contributions from system and transducers, respectively. We assume NS(f) and NT(f) are zero mean with standard deviations of σS and σT for systems and transducers, respectively.
We make the assumption that speckle, system, and transducer distributions are independent of each other (there is no covariance) therefore the mean and variance of DDs,t(f) are:
| (3) |
| (4) |
where is the expectation value (approximated by the mean) and is the variance. The subscript S,T indicates that the expectation and variance are computed from a set of systems, S, and transducers, T.
We estimated σS and σT separately, restricting the analysis of systems to only one transducer and the analysis of transducers to only one system, thereby eliminating the other source of variance. We write the observed variance among systems and transducers as:
| (5) |
| (6) |
where the subscripts now indicate that variance is computed using a set of systems S and a single transducer t or a single system s and set of transducers T. Both estimated variances among systems and transducers are corrupted by the speckle variance; reducing speckle variance, by increasing the number of acoustic A-lines, suppresses that component and allows improved estimation of the system and transducer components of variance. (Note that these equations are in terms of nepers and therefore lack the factor of 4.34 found in Lizzi, et al. (2006)).
Accounting for System and Transducer Variance Using the RPM Ratio of Sample to Reference Power Spectra
We wish to analyze the effects of using a set of systems and transducers as the reference phantom calibration set when using the Reference Phantom Method for attenuation and backscatter coefficient estimation. The Reference Phantom Method assumes that the speed of sound in the sample and reference phantom are similar, diffuse scattering dominates, there is negligible multiple scattering, attenuation is locally homogeneous, and the power spectral estimation depth, z, is at least one aperture distance from the transducer (Yao et al., 1990). Under these assumptions,
| (7) |
where DD(f, z) is the power spectral density distribution at frequency f and axial distance z, the superscript and subscript refers to reference phantom (ref) power spectral density distribution (an equivalent equation can be formed for the sample). G represents the signal transduction and processing in the system. D represents the diffraction pattern of the acoustic beam. Under the conditions listed above Eq. 7, G and D are equivalent (individually) in the reference phantom and the sample. BSC is the backscatter coefficient and α is the attenuation coefficient in the medium.
We want to quantify the bias and variance of QUS parameters estimated using a pre-collected mean reference phantom power spectrum acquired from a set of systems S and transducers T, compared to individual (system- and transducer-specific) reference phantom power spectra. Imagine that a single system s and transducer t are used to estimate QUS parameters using the Reference Phantom Method. We can write the ratio of the sample to reference phantom power spectra as:
| (8) |
| (9) |
where refers to a single system and transducer pair s,t interrogating sample media and is the reference phantom calibration set calculated using the average power spectra from a set of systems S and transducers T. The average power spectral density distribution from a set of systems S and transducers T is the average of a set of normal distributions therefore the mean and variance are as follows:
| (10) |
| (11) |
where L is the number of independent acoustic A-lines which are used in power spectral estimation for the reference phantom power spectra. Note that the variance is now reduced by the number of independent systems S and transducers T that are used to estimate the average power spectra.
The distribution and resulting mean and variance for the ratio of sample to reference power spectra have been derived by multiple investigators for both the ratio and logarithm of the ratio of power spectra (Samimi and Varghese, 2017; Guerrero et al., 2017; Gerig et al., 2003; Lizzi et al., 2006). In Appendix A, we derive the variance of the logarithm of the ratio of sample to reference power spectra (Eq. 8).
Effects of System and Transducer Variance on QUS Parameter Estimate Variance
The expected variance of QUS parameters estimated with the Reference Phantom Method was previously investigated when the same transducer and system pair were used for both sample and reference phantom power spectra (Samimi and Varghese, 2017; Gerig et al., 2003; Yao et al., 1991). Yao et al. 1991 derived the expected variance of attenuation and the BSC, Gerig et al. 2003 provided the expected variance of the BSC and ESD, and Samimi and Varghese 2017 provided the Cramer-Rao lower bound for variance in estimates of attenuation and attenuation slope. Each of these studies found that the variance of the resultant QUS parameter estimate was proportional the variance of the ratio of sample to reference phantom power spectral estimates (Samimi and Varghese, 2017; Gerig et al., 2003; Yao et al., 1991). In Appendix B and C, we derive the theoretical variance of attenuation and the BSC respectively with respect to speckle and system and transducer variance.
The final forms for the theoretical variance of attenuation, , and the backscatter coefficient, , estimates are given in Appendix B Eq B.9 and Appendix C Eq C.11, respectively, and are as follows:
| (12) |
| (13) |
Results
System-to-System Variability
Figure 2 shows plots of the average power spectral estimates obtained with each of five S3000 systems using one 6C1 transducer (S/N: 12500152). The corresponding variance among power spectral estimates for the five systems are shown by the dash-dot line in Figure 3.
Figure 3.
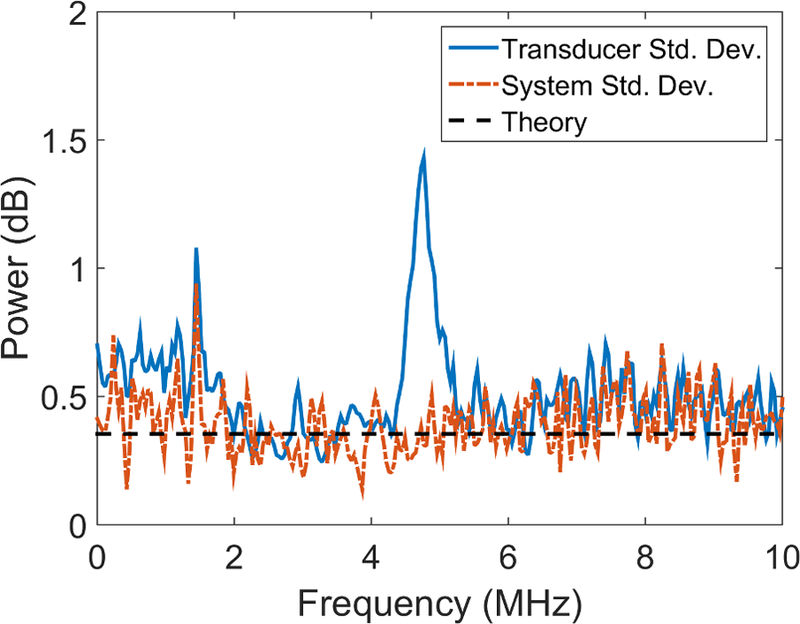
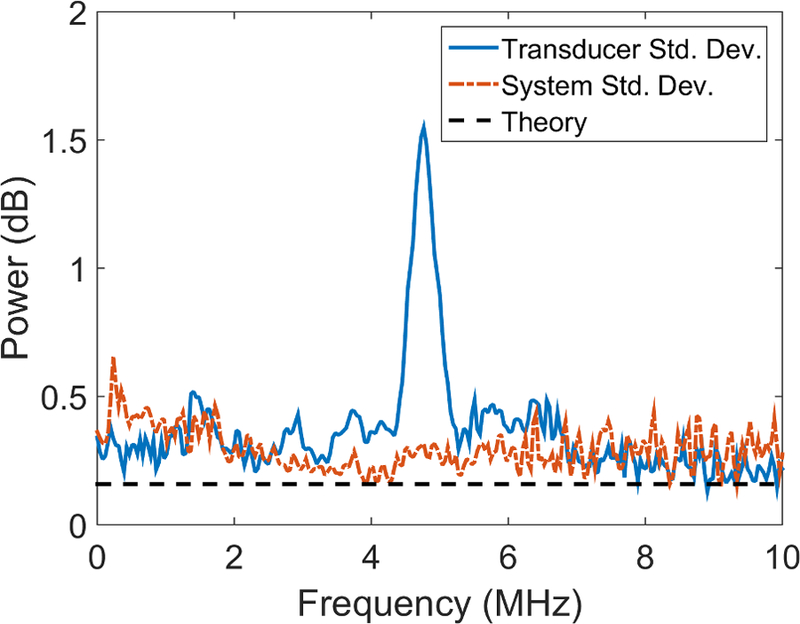
Variance of power spectrum estimates among eleven 6C1 transducers (solid line; Eq. (6)), five Acuson S3000 systems (dash-dot line; Eq. (5)), and the theoretical speckle variance (horizontal dashed line; ) obtained with (a) 150 uncorrelated A-lines and (b) 750 uncorrelated A-lines. The peaks cut off near 5 MHz reach a height of: (a) 2.05 dB2 and (b) 2.40 dB2 respectively. The peak cut off near 1.4 MHz reaches a height of: (a) 1.16 dB2.
Transducer-to-Transducer Variability
Shown in Figure 4 are plots of power spectral estimates obtained with eleven 6C1 curved-linear array transducers using one S3000 system (S/N: 211188). The corresponding variance among power spectral estimates for the eleven transducers are shown by the solid line in Figure 3.
Figure 4.
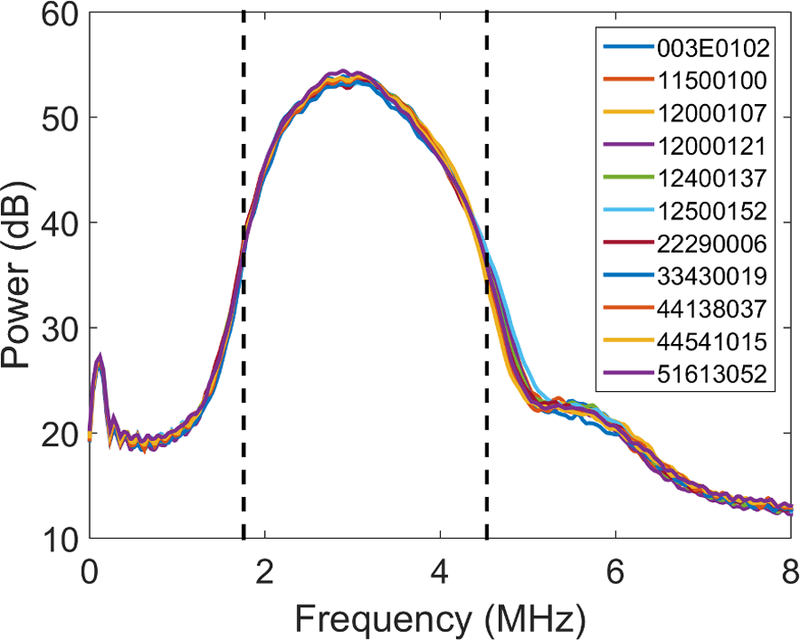
Power spectral estimates of eleven 6C1 transducers on Acuson S3000 system (S/N: 211188) using 750 uncorrelated A-lines. The legend identifies eleven different transducers according to serial number. The dashed vertical lines represent the analysis bandwidth that is +10 dB above the noise floor (1.5–4.9 MHz).
System and Transducer Variance
In the +10 dB analysis bandwidth (1.5–4.9 MHz), at the electronic focus, slightly below the elevational focus, using five power spectrum estimation regions (PSERs) (N = 750), the average power spectral density (PSD) variance (standard deviation) among systems and transducers were and , respectively, the sum of variances being 0.32 dB2 (0.57 dB). Using only one PSER (N=150), the estimated bandwidth-averaged PSD estimate variance among systems and transducers was and , respectively.
Effects of System and Transducer Variance on QUS Parameter Variance
Figure 5 shows the theoretical standard deviation of attenuation estimates (Eq. 12) as a function of the number of uncorrelated acoustic A-lines N used for power spectral estimation. The parameters of the theoretical attenuation variance estimates are as follows: N = 5, ∆z = 0.6 cm, M = 3 (see Appendix B). The sum of system and transducer variance was set as 0.32 dB2 (the average experimental system and transducer variance found in the +10 dB bandwidth for N = 750).
Figure 5.
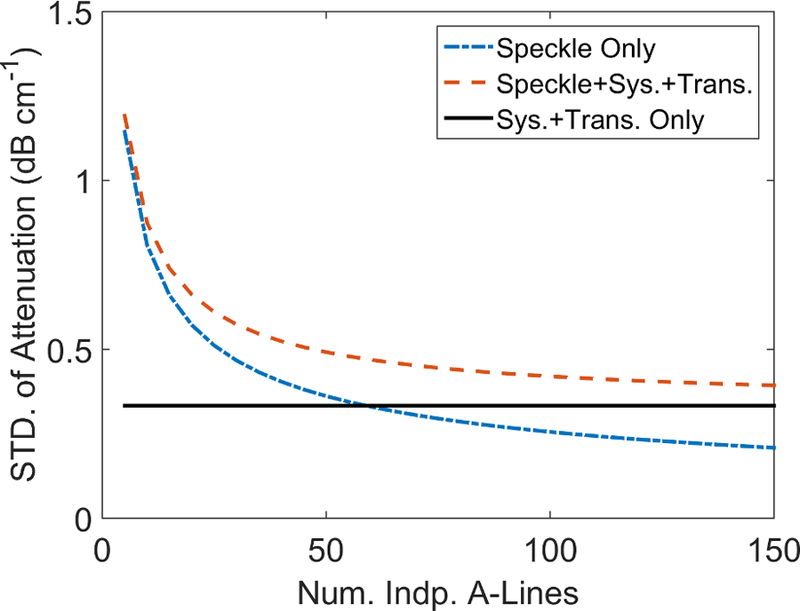
The predicted standard deviation of the attenuation coefficient estimates (Eq. 12) plotted as a function of the number of independent acoustic A-lines (N) used for power spectral estimation. The dash-dot line represents speckle variance only, the dashed line represents speckle + system + transducer variance, while the solid black horizontal line represents system + transducer variance only. The system + transducer variance was set as 0.32 dB2.
Figure 6 shows the theoretical standard deviation of the BSC given in Eq. 13 as a function of the number of independent acoustic A-lines N used for power spectral estimation. The parameters of the theoretical backscatter coefficient variance estimates are as follows: N = 5, ∆z = 0.6 cm, M = 3, z = 7 cm, and BSCsp = 0.0021 cm−1sr−1. The sum of system and transducer variance was set as 0.32 dB2 (the average experimental system and transducer variance found in the +10 dB bandwidth for N = 750).
Figure 6.
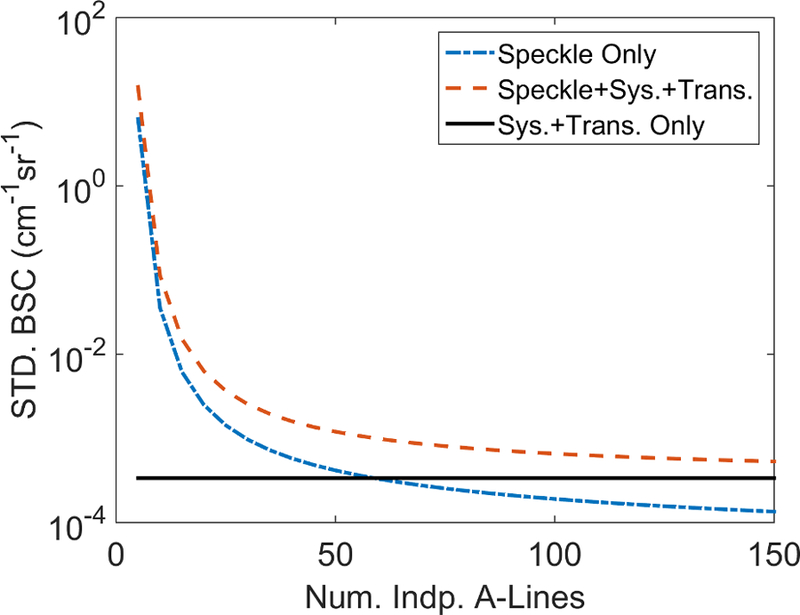
The predicted standard deviation of the backscatter coefficient (Eq. 13) plotted as a function of the number of independent acoustic A-lines (N) used for power spectral estimation. Dash-dot line represents speckle variance only, the dashed line represents speckle + system + transducer variance, while the solid black horizontal line represents system + transducer variance only. The system + transducer variance was set as 0.32 dB2.
Discussion
Impact of System and Transducer Variability On Power Spectral Estimates
The objective of this study was to determine if system-to-system or transducer-to-transducer variability introduced significant differences among echo signal power spectra estimated from an ultrasound phantom. The average power spectrum shape (frequency dependence) and noise characteristics (see Figure 2 and Figure 4) among systems and transducers appeared to be similar throughout most of the +10 dB bandwidth. The plots in Figures 3(a) and 3(b) demonstrate a large increase in PSD variance near 5 MHz among the eleven 6C1 transducers (2.05 dB2 vs 2.40 dB2 for one PSER and five PSERs respectively). With a single PSER (N=150; Figure 3(a)), an increase in PSD variance near 1.5 MHz was observed for both systems and transducers. The +10 dB analysis bandwidth includes part of the 5 MHz variance spike, causing an increase in the estimate of the average transducer variance. One may reduce estimates of average system and transducer variance by using a more restrictive bandwidth. In a 2–4 MHz analysis bandwidth, using five PSERs (N=750), the average PSD variance (standard deviation) among systems and transducers were and , respectively; the sum of variances being 0.12 dB2 (0.35 dB).
PSD estimates were performed at the electronic and elevational focus where differences in acoustic power (due to differences in focal properties) were expected to be the largest. Differences in system or transducer electronics leading to PSD variance were expected to be equivalent at any depth beyond the elevation focus (where the largest transmit and receive apertures are likely found). At shallower depths, electronics might introduce some differences in PSD estimates as the aperture changes with dynamic focus on receive, however, investigating this was beyond the scope of the present study.
Estimates of system and transducer contributions to average PSD estimate variance ( and ) using one PSER were smaller and appeared noisier than estimates using five PSERs. Using one PSER, the speckle variance is about the same magnitude as transducer and system variances estimated using five PSERs ( and ). From these variance component estimates, when N=59. This result implies that, in situations where the number of independent A-lines is small (N≪59), the speckle variance will dominate the combined contribution to PSD estimate variance introduced by different systems and transducers. For perspective, if (N=5) the combined system and transducer variance is 4.5% of the total PSD variance; if (N=50) the combined system and transducer variance is 45% of the total PSD variance. Using the more restricted 2–4 MHz bandwidth results in when N=157.
Ramifications of Using a Pre-Collected Calibration Data Set for RPM QUS Parameter Estimation
Using the average power spectrum of many 6C1 transducers and S3000 systems (a pre-collected reference phantom calibration set) will contribute a small, but non-zero, variance to power spectral estimates. We found that the effects of system and transducer variance on the predicted variance of attenuation and backscatter coefficient estimates were highly dependent on the number of independent acoustic A-lines used in power spectral estimation. The expected power spectrum variance among S3000 systems and 6C1 transducers measured in this paper (0.32 dB2; measured using a +10 dB bandwidth) resulted in a minimum predicted attenuation standard deviation of ±0.33 dB·cm−1 and a minimum theoretical BSC standard deviation of ±0.0003 cm−1sr−1. Reaching these standard deviations without system or transducer variance would require N>59 independent A-lines in power spectral estimation. Using the average system and transducer variance found in the 2–4 MHz bandwidth would result in even lower theoretical variances for both attenuation and backscatter coefficients.
Most investigators report the specific attenuation coefficient (linear least-squares fit to attenuation versus frequency) or the average BSC (mean of the BSC in the usable bandwidth), as these parameters benefit from variance reductions from frequency averaging or fitting. The reduction in parameter variance of the specific attenuation coefficient and average BSC will depend on the number of independent frequency bins used in their estimation (Samimi and Varghese, 2017; Gerig et al., 2003). Even with a very modest assumption of a variance reduction of a factor of 5, the resulting minimum theoretical standard deviation for the specific attenuation coefficient is ±0.14 dB·cm−1MHz−1 and the minimum theoretical average BSC standard deviation is ±0.0001 cm−1sr−1. For clinical comparison, Lin et al. found that BSCs larger than 0.0038 cm−1sr−1 accurately predict steatosis (Lin et al., 2015). Our minimum theoretical standard deviation of the BSC using the average system and transducer variance of the +10 dB bandwidth is nearly an order of magnitude below this cut-off (±0.0003 cm−1sr−1). In general, the use of a pre-collected reference phantom data will not significantly effect QUS parameter estimates.
Limitations
We assumed that the five ultrasound systems used in this study were representative of all S3000 systems in good working order; their performance (ignoring system software updates) has been stable over time, and each system provides a sampling of system performance for relatively new (2 yrs in service) and relatively old (9 yrs in service) system.
We restricted our analysis to the 6C1 transducer and S3000 system. Our results are not directly applicable to any other transducer or system. If one wished to extend these results to other transducers and systems, one will need to repeat this study with that specific configuration.
The 6C1 transducers used in this study were all original equipment from Siemens. It is important to highlight that the consistency of transducer and systems found in this study will not be valid for any transducer or system that has become damaged. Periodic inspection of transducers and systems will need to confirm that the reference phantom calibration set is still valid. Any transducer damage and repair could significantly influence the power spectrum compared to original equipment.
Conclusions
We show that Siemens 6C1 curved-linear array transducers and Acuson S3000 systems have small measurable differences in estimates of power spectra from a commercial clinical phantom. The average additional variance among power spectrum estimates caused by differences among system and transducer performance was estimated to be 0.32 dB2 in the +10 dB band-width. Its contribution to the overall variance among power spectrum estimates will depend on the number of independent acoustic A-lines included. The effect of system and transducer variance on QUS parameter estimates is also dependent on the number of independent acoustic A-lines included in the estimate. This work suggests that it is feasible to use a pre-collected set of reference phantom calibration data to estimate QUS parameters from clinical systems.
Acknowledgment
The research reported here was supported by National Institutes of Health Grants T32CA009206 from the National Cancer Institute and R01HD072077 from the Eunice Kennedy Shriver National Institute of Child Health and Human Development. The content is solely the responsibility of the authors and does not necessarily represent the views of the National Institutes of Health.
Appendix A. Variance of the Ratio of Sample to Reference Phantom Power Spectra
The statistical properties of power spectra estimated for diffuse scattering have been reported (Wagner et al., 1987; Lizzi et al., 2006). Assuming there is a large number of scatterers in the pulse-echo volume, no multiple scattering, and no coherent scattering, power spectral estimates from independent acoustic lines are given by an exponential distribution at each frequency bin f (Lizzi et al., 2006). The ensemble average of power spectra estimated from independent A-lines is then gamma-distributed at each frequency (Lizzi et al., 2006; Samimi and Varghese, 2017). Averaging a sufficiently large number of independent power spectral estimates (usually greater than 10), the power spectral distribution at each frequency may be approximated by a normal distribution (Lizzi et al., 2006; Samimi and Varghese, 2017). Using the above assumptions, the power spectral density distributions of the sample and reference phantom power spectra are normally distributed, and the mean and variance of the ratio of sample to reference phantom power spectra may be approximated using a first order Taylor series expansion. The mean and variance of that ratio (Eq. 8) are then:
| (A.1) |
| (A.2) |
where N and L are the number of uncorrelated A-lines in the sample and reference phantom, respectively. Using a first-order Taylor series expansion for the log of the power spectrum ratio, the mean and variance become:
| (A.3) |
| (A.4) |
Eqs. A.2–A.4 can be simplified by assuming S, T, and L are sufficiently large such that
| (A.5) |
| (A.6) |
| (A.7) |
Appendix B. Variance of Attenuation
Attenuation coefficient estimation, using the Reference Phantom Method, is performed using a linear least-squares fit to the logarithm of the ratio of sample to reference phantom power spectral density value as a function of (incremental) depth into the media (Yao et al., 1990). The variance of the attenuation coefficient is related to the size of the individual power spectral estimation regions, the power spectral density estimation method, and the length of the attenuation parameter estimation region (the total depth range used for the attenuation estimate) (Rosado-Mendez et al., 2013; Samimi and Varghese, 2017; Yao et al., 1991). A straightforward way to compute the variance of the attenuation estimates is to rely on the equation for the variance of the slope of a linear fit: (Bevington and Robinson, 2002)
| (B.1) |
| (B.2) |
where , is the linear least-squares estimate of the slope, b is the linear least-squares estimate of the intercept, is the variance of the data under linear regression, z is the separation between equally-spaced power spectrum estimate positions, and M is the total number of power spectrum estimates.
Given that the Reference Phantom Methods accounts for system and diffraction effects, (Yao et al., 1990; Nam et al., 2011) the logarithm of the ratio of sample to reference phantom power spectra is then the log ratio of BSCs in the sample and reference media and difference in attenuation written as follows:
| (B.3) |
The attenuation coefficient (at a single frequency) of the sample media is estimated by the following equation:
| (B.4) |
where is the linear least-squares fit of the logarithm of the ratio of sample to reference power spectra versus depth at frequency f. The variance of the estimated attenuation coefficient of the sample media can be found with Eq. B.2 and Eq. B.4 and is as follows:
| (B.5) |
where is the variance of the logarithm of the ratio of power spectra, zm is the relative position of individual PSD estimates within the parameter estimation region (PER), is the depth of the center of the PER, M is the total number of independent power spectral ratio estimates in an attenuation parameter estimation region. To simplify Eq. B.5 one can define z in terms of the index of the power spectral ratio estimates m:
| (B.6) |
where m is the index of the power spectral ratio estimate and is the distance between independent power spectral ratios. One may then write the sum in Eq. B.5 as:
| (B.7) |
Inserting Eq. B.7 into Eq. B.5 results in
| (B.8) |
If the sample and reference phantom power spectra are estimated using the same system and transducer pair then will include only the speckle variance. Using the variance of the logarithm of the ratio of sample to reference phantom power spectra derived in Eq. A.7 of Appendix A and inserting it into Eq. 8 results in:
| (B.9) |
Eq. B.9 is the variance of attenuation using a reference phantom calibration set that is the average power spectral estimate from a set of independent systems and transducers.
Appendix C. Variance of the Backscatter Coefficient
The BSC of sample media is most often estimated by multiplying the ratio of sample to reference phantom power spectra by the BSC of the reference phantom and the exponential raised to the difference between sample and reference phantom attenuation (Yao et al., 1990; Gerig et al., 2003). Estimation of a sample BSC may be written as (Gerig et al., 2003):
| (C.1) |
where is the estimate of the BSC of the sample, is the known BSC of the reference phantom, is the difference in attenuation between the sample and reference phantom, and z is the axial distance. The variance of Eq. C.1 is:
| (C.2) |
BSCref is deterministic (commonly estimated using the planar reflector method), (Insana et al., 1990) therefore we may write Eq. C.2 as:
| (C.3) |
Both Rs,t(f, z) and are random variables, therefore the variance of is the variance of the product of two random variables — the estimated attenuation coefficient and the ratio of sample and reference phantom power spectra. These are correlated random variables, and the variance of their product is modeled as follows (Ross, 2009):
| (C.4) |
where we have defined and for notational convenience. Since attenuation estimation requires a sequence (in depth) of several power spectral ratio estimates, we assume each of them is uncorrelated with the others, and the contribution of any one of them (used for backscatter coefficient estimation at a particular depth) to the covariance for attenuation coefficient estimation is small. To a first approximation, we assume their covariance for backscatter coefficient estimation is zero ( and ). With that approximation, we write Eq. C.4 as:
| (C.5) |
Substituting and into Eq. C.5:
| (C.6) |
where the deterministic value has been removed for notational convenience. The mean and variance of Rs,t were derived in Appendix A, therefore we only need the mean and variance of . The variance of attenuation was derived in Appendix B above. The estimate of the slope using a linear least-squares fit to normally distributed data is itself normally distributed, (Bevington and Robinson, 2002) thus the distribution for is:
| (C.7) |
The exponential raised to a normally distributed random variable results in a lognormally distributed random variable with mean and variance as follows (Johnson et al., 1994):
| (C.8) |
| (C.9) |
| (C.10) |
Substituting Eqs. A.1-A.2 and C.9-C.10 into Eq. C.6, and bringing back , results in the following equation for the variance of BSC estimates:
| (C.11) |
The variance of the estimated BSC depends on both the BSC of the sample and the mean and variance of the lognormal attenuation. Note that cancels out.
Appendix D. Experimental Consistency of Theoretical Variances
To test the accuracy of Eqs. A.7, B.9, and C.11 we estimated the variance of the ratio of sample to reference phantom power spectra, attenuation, and backscatter coefficients using a single transducer and system pair. Using a Siemens 18L6 linear array transducer operated on a Siemens Acuson S3000 ultrasound system we collected independent frames (3×5.6 cm; axial×lateral) of raw RF echo signal data from a set of reference phantoms using the Axius Direct Ultrasound Research Interface (Brunke et al., 2007). The excitation frequency of the 18L6 transducer was set to 10 MHz, the electronic focus was set to 2 cm, and RF echo signals were sampled at 40 MHz. The usable bandwidth was 4–9 MHz for this data. Echo signal data was collected and processed offline using Matlab (Mathworks, Natick, MA, USA).
Verification of the predicted variances of the ratio of sample to reference power spectra, attenuation coefficient estimates, and BSC estimates required the use of 3 phantoms which had independently estimated attenuation and backscatter coefficients. The three phantoms were referred to as the ‘1540 m/s’ phantom, the ‘75–90 micron’ phantom, and the ‘125–150 micron’ phantom. The ‘1540 m/s’ phantom was homogeneously composed of a water-based gel mixed with graphite powder (51 g/L; 9039 Desulco, Superior Graphite, Chicago, IL) and glass beads (6 g/L, 3000E beads, ∼5–20 µm; Potter’s Industries, Malvern, PA). The ‘75–90 micron’ phantom was homogeneously composed of a water-based gel mixed with graphite powder (50 g/L; 9039 Desulco, Superior Graphite, Chicago, IL) and glass beads (6 g/L, 2900 beads sieved to 75–90 µm; Potter’s Industries, Malvern, PA). The ‘125–150 micron’ phantom was homogeneously composed of a water-based gel mixed with graphite powder (50 g/L; 9039 Desulco, Superior Graphite, Chicago, IL) and glass beads (8 g/L, 2024 beads sieved to 125–150 µm; Potter’s Industries, Malvern, PA). Speed of sound and attenuation coefficients were measured for each phantom using through-transmission experiments, (Madsen et al., 1999) and backscatter coefficients were measured in single-element transducer pulse-echo experiments (Insana et al., 1990) and are reported in Table 2. All phantoms were housed in acrylic blocks which had a 25 µm thick polyvinylidene chloride (Dow Chemical, Midland, MI) scanning window.
Table 2:
Table of the properties of the three phantoms used in Appendix D. Attenuation slope values are the results of a linear fit of attenuation versus frequency using through-transmission estimates of attenuation from 2.5–10 MHz. BSC values were measured using a single element transducer via the planar reflector approach of BSC estimation (Insana et al., 1990). BSC values are reported at the middle of the 4–9 MHz bandwidth chosen for analysis.
| Speed of Sound | Attenuation Slope | BSC (@ 6.5 MHz) | |
|---|---|---|---|
| ‘1540 m/s’ | 1539 m/s | 0.67 dB·cm−1MHz−1 | 0.0038 cm−1sr−1 |
| ‘75–90 micron’ | 1533 m/s | 0.78 dB·cm−1MHz−1 | 0.0098 cm−1sr−1 |
| ‘125–150 micron’ | 1533 m/s | 0.94 dB·cm−1MHz−1 | 0.0161 cm−1sr−1 |
The variance of the logarithm of the ratio of sample to reference phantom power spectra was estimated using 20 independent RF echo signal frames of the ‘1540 m/s’ phantom as ‘sample media’ and 60 independent RF echo frames of the same ‘1540 m/s’ phantom as the ‘reference phantom’. The number of independent A-lines used in power spectral estimation were varied by choice of the size of the power spectral estimation region (PSER). Using the methods detailed in the Power Spectral Estimation subsection, we measured the pulse-echo correlation size to be 210 µm axially × 295 µm laterally. Using these pulse-echo correlation sizes, power spectral estimation regions of 2×2 mm (N=7), 4×4 mm (N=14), 6×6 mm (N=21), and 8×8 mm (N=28) were chosen to verify the variance of the ratio of power spectra for different values of N. (Note that changing the length of the PSER doesn’t change the number of uncorrelated lines of echo data in the window, but it does change the spectral resolution in power spectral estimate. Rectangular PSER regions are common in quantitative ultrasound implementations.) Figure 7 shows the standard deviation of the logarithm of the ratio of sample to reference phantom power spectra as a function of N versus values predicted using Eq. A.7 in Appendix A. For the remainder of Appendix D we use a 4×4 mm power spectral estimation region.
Figure 7.
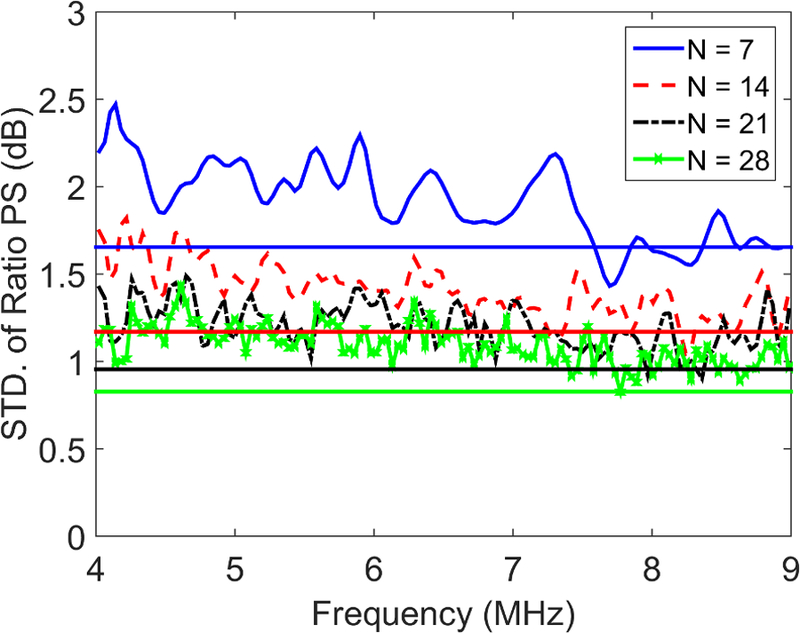
Estimated versus predicted values of the standard deviation of the logarithm of the ratio of sample to reference phantom power spectra as a function of frequency for N=7–28 independent acoustic lines used in power spectral estimation. Solid horizontal lines represent values predicted using Eq. A.7 in Appendix A.
The variance of attenuation was estimated using 20 independent RF echo signal frames of the ‘1540 m/s’ phantom as ‘sample media’ and 60 independent RF echo frames of the same ‘1540 m/s’ phantom as the ‘reference phantom.’ The length of the attenuation parameter estimation region was varied from 8 mm (M=2) to 20 mm (M=5) in steps of 4 mm and the variance of attenuation estimates were calculated from the 20 independent RF echo signal frames for each PER length. We used a 4×4 mm power spectral estimation region (N = 14) and ∆z=4 mm for all tests of attenuation coefficient estimate variance. Figure 8 shows the estimated attenuation coefficient variance from the four parameter estimation region sizes as well as the variances predicted using Eq. B.9.
Figure 8.
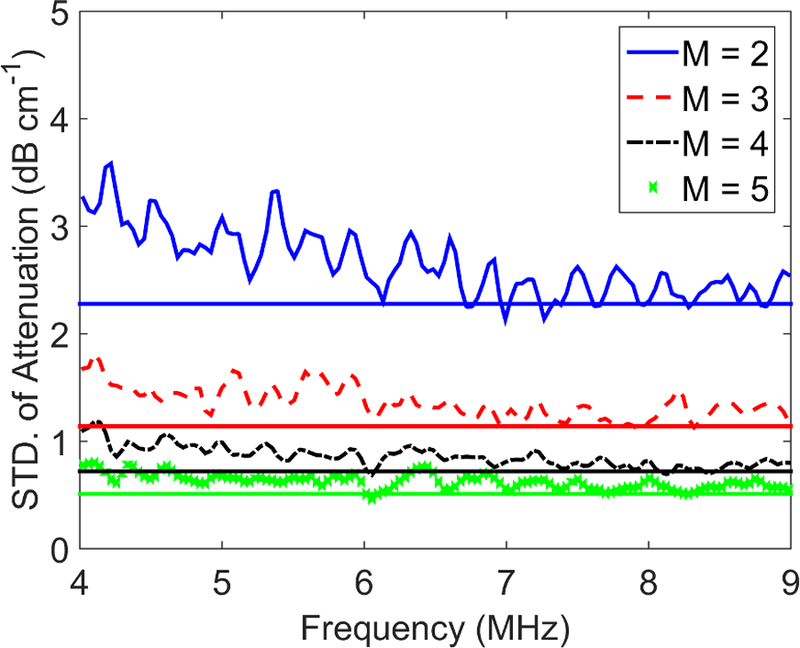
Estimated versus predicted values of the standard deviation of attenuation coefficient estimates as a function of frequency for M=2–5 independent ratios of sample to reference phantom power spectra used in attenuation coefficient estimation. Solid horizontal lines represent values predicted using Eq. B.9 in Appendix B.
Since the variance of the estimated BSC depends on and BSCsp, we needed to use phantoms that have different attenuation and backscatter coefficients. Therefore, the predicted variance of the BSC estimates was verified using 20 independent RF frames from three phantoms (the ‘1540 m/s’ phantom, the ‘75–90 micron’ phantom, and the ‘125–150 micron’ phantom) as ‘sample media’ and 60 independent RF echo signal frames of the ‘1540 m/s’ phantom as the ‘reference phantom. A 4×4 mm PSER (N = 14), an attenuation parameter estimation region of 12 mm (M=3), , and the axial distance into the sample z=20 mm was selected for all tests of BSC variance. Figure 9 show the estimated standard deviation in BSC estimates and those values predicted using Eq. C.11 for the ‘1540 m/s,’ ‘75–90 micron,’ and ‘125–150 micron’ phantoms.
Figure 9.
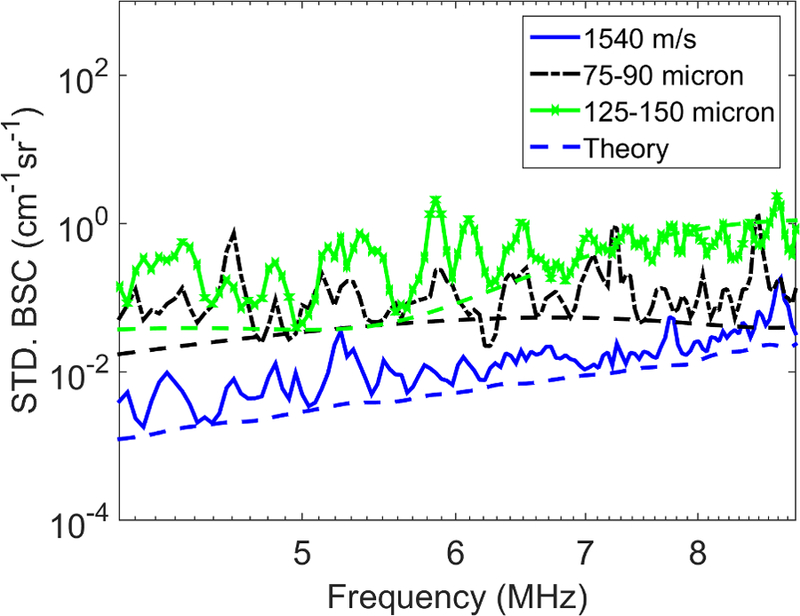
Estimated versus predicted standard deviation of the BSC as a function of frequency for the ‘1540 m/s’ (solid line), ‘75–90 micron’ (dash-dot line), and ‘125–150 micron’ (dash-cross line) phantoms. All dashed lines represent values predicted using Eq. C.11 in Appendix C.
References
- Bevington P, Robinson DK. Data Reduction and Error Analysis for the Physical Sciences, 3rd Edition. McGraw-Hill Education, 2002. [Google Scholar]
- Brunke SS, Insana MF, Dahl JJ, Hansen C, Ashfaq M, Ermert H. An ultrasound research interface for a clinical system. IEEE Trans Ultrason Ferroelectr Freq Control, 2007;54:198–210. [DOI] [PubMed] [Google Scholar]
- Feleppa EJ, Porter CR, Ketterling J, Lee P, Dasgupta S, Urban S, Kalisz A. Recent developments in tissue-type imaging (TTI) for planning and monitoring treatment of prostate cancer. Ultrason Imaging, 2004;26:163–172. [DOI] [PMC free article] [PubMed] [Google Scholar]
- Gerig A, Zagzebski J, Varghese T. Statistics of ultrasonic scatterer size estimation with a reference phantom. The Journal of the Acoustical Society of America, 2003;113:3430–3437. [DOI] [PubMed] [Google Scholar]
- Ghoshal G, Kemmerer JP, Karunakaran C, Abuhabsah R, Miller RJ, Sarwate S, Oelze ML. Quantitative ultrasound imaging for monitoring in situ high-intensity focused ultrasound exposure. Ultrason Imaging, 2014;36:239–255. [DOI] [PMC free article] [PubMed] [Google Scholar]
- Gibson AA, Schaffer JE, Peterson LR, Bilhorn KR, Robert KM, Haider TA, Farmer MS, Holland MR, Miller JG. Quantitative analysis of the magnitude and time delay of cyclic variation of myocardial backscatter from asymptomatic type 2 diabetes mellitus subjects. Ultrasound Med Biol, 2009;35:1458–1467. [DOI] [PMC free article] [PubMed] [Google Scholar]
- Guerrero QW, Rosado-Mendez IM, Drehfal LC, Feltovich H, Hall TJ. Quantifying Backscatter Anisotropy Using the Reference Phantom Method. IEEE Trans Ultrason Ferroelectr Freq Control, 2017;64:1063–1077. [DOI] [PMC free article] [PubMed] [Google Scholar]
- Hall TJ, Insana MF, Harrison LA, Cox GG. Ultrasonic measurement of glomerular diameters in normal adult humans. Ultrasound Med Biol, 1996;22. [DOI] [PubMed] [Google Scholar]
- Holland MR, Wallace KD, Miller JG. Potential relationships among myocardial stiffness, the measured level of myocardial backscatter (”image brightness”), and the magnitude of the systematic variation of backscatter (cyclic variation) over the heart cycle. J Am Soc Echocardiogr, 2004;17:1131–1137. [DOI] [PubMed] [Google Scholar]
- Insana M, Garra B, Rosenthal S, Hall T. Quantitative Ultrasonography. Medical Progress Through Technology, 1989;15:141–153. [PubMed] [Google Scholar]
- Insana M, Hall T. Characterizing The Microstructure Of Random-Media Using Ultrasound. Physics In Medicine And Biology, 1990;35:1373–1386. [DOI] [PubMed] [Google Scholar]
- Insana MF, Wagner RF, Brown DG, Hall TJ. Describing small-scale structure in random media using pulse-echo ultrasound. J. Acoust. Soc. Am, 1990;87:179–192. [DOI] [PMC free article] [PubMed] [Google Scholar]
- Johnson NL, Kotz S, Balakrishnan N. Continuous Univariate Distributions, Vol. 1 (Wiley Series in Probability and Statistics) Wiley-Interscience, 1994. [Google Scholar]
- Lin SC, Heba E, Wolfson T, Ang B, Gamst A, Han A, Erdman JW, O’Brien WD, Andre MP, Sirlin CB, Loomba R. Noninvasive Diagnosis of Non-alcoholic Fatty Liver Disease and Quantification of Liver Fat Using a New Quantitative Ultrasound Technique. Clin. Gastroenterol. Hepatol, 2015;13:1337–1345. [DOI] [PMC free article] [PubMed] [Google Scholar]
- Lizzi FL, Alam SK, Mikaelian S, Lee P, Feleppa EJ. On the statistics of ultrasonic spectral parameters. Ultrasound Med Biol, 2006;32:1671–1685. [DOI] [PubMed] [Google Scholar]
- Madsen EL, Dong F, Frank GR, Garra BS, Wear KA, Wilson T, Zagzebski JA, Miller HL, Shung KK, Wang SH, Feleppa EJ, Liu T, O’Brien WD, Topp KA, Sanghvi NT, Zaitsev AV, Hall TJ, Fowlkes JB, Kripfgans OD, Miller JG. Interlaboratory comparison of ultrasonic backscatter, attenuation, and speed measurements. J Ultrasound Med, 1999;18:615–31. [DOI] [PubMed] [Google Scholar]
- Madsen EL, Frank GR. Very low scatter liquid and solid tissue mimicking material for ultrasound phantoms and method of making the same, 1997. US Patent 5,625,137. [Google Scholar]
- Mamou J, Coron A, Oelze ML, Saegusa-Beecroft E, Hata M, Lee P, Machi J, Yanagihara E, Laugier P, Feleppa EJ. Three-dimensional high-frequency backscatter and envelope quantification of cancerous human lymph nodes. Ultrasound Med Biol, 2011;37:345–357. [DOI] [PMC free article] [PubMed] [Google Scholar]
- McFarlin BL, Balash J, Kumar V, Bigelow TA, Pombar X, Abramowicz JS, O’Brien WD. Development of an ultrasonic method to detect cervical remodeling in vivo in full-term pregnant women. Ultrasound Med Biol, 2015;41:2533–9. [DOI] [PMC free article] [PubMed] [Google Scholar]
- Mottley JG, Glueck RM, Perez JE, Sobel BE, Miller JG. Regional differences in the cyclic variation of myocardial backscatter that parallel regional differences in contractile performance. J. Acoust. Soc. Am, 1984;76:1617–1623. [DOI] [PubMed] [Google Scholar]
- Nam K, Rosado-Mendez IM, Rubert NC, Madsen EL, Zagzebski JA, Hall TJ. Ultrasound attenuation measurements using a reference phantom with sound speed mismatch. Ultrason Imaging, 2011;33:251–63. [DOI] [PMC free article] [PubMed] [Google Scholar]
- Nam K, Rosado-Mendez IM, Wirtzfeld LA, Ghoshal G, Pawlicki AD, Madsen EL, Lavarello RJ, Oelze ML, Zagzebski JA, O’Brien WD, Hall TJ. Comparison of ultrasound attenuation and backscatter estimates in layered tissue-mimicking phantoms among three clinical scanners. Ultrason Imaging, 2012;34:209–21. [DOI] [PMC free article] [PubMed] [Google Scholar]
- Nam K, Zagzebski JA, Hall TJ. Quantitative assessment of in vivo breast masses using ultrasound attenuation and backscatter. Ultrason Imaging, 2013;35:146–61. [DOI] [PMC free article] [PubMed] [Google Scholar]
- Oelze ML, Mamou J. Review of Quantitative Ultrasound: Envelope Statistics and Backscatter Coefficient Imaging and Contributions to Diagnostic Ultrasound. IEEE Trans Ultrason Ferroelectr Freq Control, 2016;63:336–351. [DOI] [PMC free article] [PubMed] [Google Scholar]
- Rosado-Mendez IM, Nam K, Hall TJ, Zagzebski JA. Task-oriented comparison of power spectral density estimation methods for quantifying acoustic attenuation in diagnostic ultrasound using a reference phantom method. Ultrason Imaging, 2013;35:214–34. [DOI] [PMC free article] [PubMed] [Google Scholar]
- Ross SM. Introduction to Probability and Statistics for Engineers and Scientists, Fourth Edition. Academic Press, 2009. [Google Scholar]
- Samimi K, Varghese T. Lower bound on estimation variance of the ultrasonic attenuation coefficient using the spectral-difference reference-phantom method. Ultrasonic Imaging, 2017;39:151–171. [DOI] [PMC free article] [PubMed] [Google Scholar]
- Thijssen JM. Ultrasonic speckle formation, analysis and processing applied to tissue characterization. Pattern Recognition Letters, 2003;24:659–675. [Google Scholar]
- Thomson DJ. Spectrum estimation and harmonic analysis. Proceedings of the IEEE, 1982;70:1055–1096. [Google Scholar]
- Wagner RF, Insana MF, Brown DG. Statistical properties of radio-frequency and envelope-detected signals with applications to medical ultrasound. J Opt Soc Am, 1987;4:910–922. [DOI] [PMC free article] [PubMed] [Google Scholar]
- Yao LX, Zagzebski JA, Madsen EL. Backscatter coefficient measurements using a reference phantom to extract depth-dependent instrumentation factors. Ultrason Imaging, 1990;12:58–70. [DOI] [PubMed] [Google Scholar]
- Yao LX, Zagzebski JA, Madsen EL. Statistical uncertainty in ultrasonic backscatter and attenuation coefficients determined with a reference phantom. Ultrasound Med Biol, 1991;17:187–194. [DOI] [PubMed] [Google Scholar]
- Yuan YW, Shung KK. Ultrasonic backscatter from flowing whole blood. II: Dependence on frequency and fibrinogen concentration. J. Acoust. Soc. Am, 1988;84:1195–1200. [DOI] [PubMed] [Google Scholar]


