Abstract
The aim of this study is to design GoogLeNet deep neural network architecture by expanding the kernel size of the inception layer and combining the convolution layers to classify the electrocardiogram (ECG) beats into a normal sinus rhythm, premature ventricular contraction, atrial premature contraction, and right/left bundle branch block arrhythmia. Based on testing MIT-BIH arrhythmia benchmark databases, the scope of training/test ECG data was configured by covering at least three and seven R-peak features, and the proposed extended-GoogLeNet architecture can classify five distinct heartbeats; normal sinus rhythm (NSR), premature ventricular contraction (PVC), atrial premature contraction (APC), right bundle branch block (RBBB), and left bundle brunch block(LBBB), with an accuracy of 95.94%, an error rate of 4.06%, a maximum sensitivity of 96.9%, and a maximum positive predictive value of 95.7% for judging a normal or an abnormal beat with considering three ECG segments; an accuracy of 98.31%, a sensitivity of 88.75%, a specificity of 99.4%, and a positive predictive value of 94.4% for classifying APC from NSR, PVC, APC beats, whereas the error rate for misclassifying APC beat was relative low at 6.32%, compared with previous research efforts.
1. Introduction
Heart disease progresses because of insufficient blood supply to the heart when coronary artery disease develops or arrhythmias are severe and long-lasting [1]. According to statistics from the Centers for Disease Control and Prevention (CDC), heart disease is the world's leading cause of death. Consequently, early diagnosis of cardiovascular disease is important for reducing the devastating impact and increasing quality of life. The primary screening tool for heart disease, the electrocardiogram (ECG), provides diagnostic features that determine the existence of irregular heartbeats by measuring and recording the electrical activity of the heart [2].
Common heart-monitoring devices for cardiac arrhythmias include Holter equipment, which continuously collects 24 hours ECG data [3, 4]. Various ECG arrhythmia classification algorithms have been developed [5–8]. Artificial neural network models with backpropagation algorithms have also been proposed to classify ECG data into normal and abnormal patterns [9–11] by training and testing the PhysioNet MIT-BIH Arrhythmia benchmark database [12].
Recently, deep learning models trained on image data have been applied to interpret ECG data for automatic classification of arrhythmias [13–15]. Deep learning is a subfield of machine learning, and it aims to learn features from three or more hierarchical layers to solve the complex tasks that were difficult for shallow neural network models [16, 17].
Concerning patient-specific ECG heartbeat classification via a deep learning approach, Kiranyaz et al. [18] implemented a 1-dimensional convolutional neural network (CNN) classifier with training and testing MIT-BIH arrhythmia records acquired from 44 patients. This proposed CNN architecture achieved a classification performance detecting ventricular ectopic beats (VEBs) and supraventricular ectopic beats (SVEBs) with an accuracy of 99% and 97.6%, respectively. Zhang et al. [19] claimed a higher accuracy of detecting VEB and SVEB beats (99.7% and 99.3%, respectively) by proposing a patient-specific ECG classifier based on recurrent neural networks and a clustering technique. However, deep learning models for classifying ECG beats might encounter difficulties in overtraining caused by quasi-periodic behaviour of ECG data. Therefore, it is necessary to exploit the number of samples contained in an ECG segment for representing input variables to avoid overtraining. Thus, we first propose a way of determining the optimal number of ECG segments used to encode the input variables. Then, we build a modified deep neural network based on GoogLeNet deep learning architecture [20, 21] with modifying inception modules to classify ECG beats into premature ventricular contraction (PVC), atrial premature contraction (APC), right bundle branch block (RBBB), and left bundle brunch block (LBBB). For the experimental tests for ECG classification, the annotated information and raw data of the MIT-BIH database from 44 patients were evaluated by our proposed GoogLeNet deep neural architecture for expanding the kernel size of the inception structure.
2. Representations of ECG Segments
2.1. Determination of ECG Intervals for Encoding Input Data
To determine the number of ECG samples for supplying input data, we define R-peak features of ECG data as follows:
Rn: reference beat in which the nthR-peak occurs in the training and test dataset
Rn−k: time position in which the (n − k)thR-peak occurs with respect to the reference beat
Rn+k: time position in which the (n+k)thR-peak occurs with respect to the reference beat
Rn−k·Rn+k: time interval between the time locations of Rn−k-peak and Rn+k-peak.
In our study, the range of training/test data, [Xnfirst, Xnend], ECG interval was configured to include Rn-reference peaks by covering at least three and seven R-peaks prior and posterior to Rn-peak by forming
| (1) |
Because the number of samples contained in the ECG interval was different depending on a patient's type of arrhythmia, a normalization process was necessary to unify the number of samples for training and testing input data. Kiranyaz et al. [18] and Zhang et al. [19] defined an ECG segment for the input data by including three R–R intervals. In our study, the test/training ECG data were acquired by performing the normalization process with multiplying the number of (R–R intervals-1) by 100 samples to avoid an aliasing problem. Figure 1 shows an example of defining the data interval with four ECG segments and the number of normalized samples.
Figure 1.
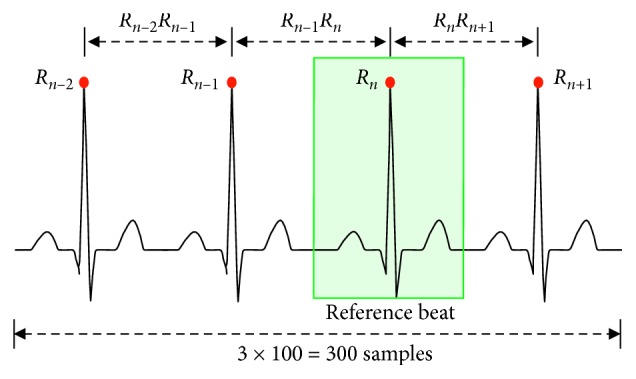
ECG segments normalization process for supplying input data.
2.2. Training and Testing Set
To classify the ECG rhythm using our proposed deep learning architecture, the rhythm of arrhythmia was classified into normal sinus rhythm (NSR), APC, PVC, RBBB, and LBBB as input data for training and testing [22–24]. In the considered segment of the MIT-BIH arrhythmia database, various arrhythmias are present, and the classification is determined with a reference beat.
All 48 patients from the MIT-BIH arrhythmia data were randomly selected, excluding four with pacemakers. Table 1 shows the total number of rhythms from the MIT-BIH arrhythmia data and the number of data used for training and testing the GoogLeNet deep learning model.
Table 1.
Number of rhythms from MIT-BIH arrhythmia data used in our experiment.
| Total beats | Training beats | Test beats | |
|---|---|---|---|
| NSR | 71,446 | 10,000 | 5,000 |
| LBBB | 8,025 | 6,025 | 2,000 |
| RBBB | 7,128 | 5,728 | 1,400 |
| APC | 2,470 | 1,870 | 600 |
| PVC | 6,128 | 4,928 | 1,200 |
3. GoogLeNet Deep Learning Structure
The existing depth learning model can achieve high accuracy by deepening the layers to increase the performance of the neural network. A major drawback of this model is that the computational complexity increases exponentially as the layer becomes deeper. Google introduced the inception structure at 2014 ImageNet Large-Scale Visual Recognition Challenge (ILSVRC14), being the best-performing model and is called GoogLeNet [20]. At the core of this structure, the inner layer of the neural network was extended to output various correlation distributions based on the idea that the neural network output of each layer has optimal efficiency if various probability distributions with high correlations with the input data are obtained. In the basic inception v1 module, where input data are fed into four independent layers (1 × 1, 3 × 3, 5 × 5 convolution layers and 3 × 3 max-pooling layer), the outputs are combined into a single data set. Inside, the convolutional layers derive various spatial information of the input data, and the maximum pooling layer plays the role of extracting distinct features by reducing the channel and size of the input data. Therefore, the inception module is a method of extracting more information into a smaller layer by widening the layer of the neuron network, which is only composed of the existing depth.
3.1. Designing GoogLeNet Deep Learning Model for Arrhythmia Detection
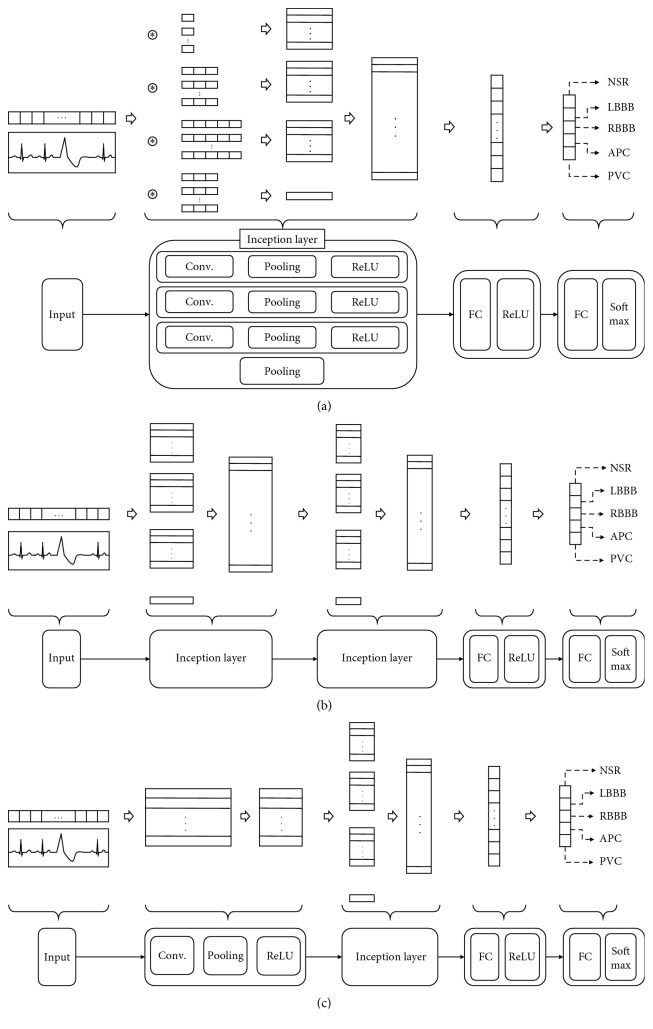
Currently, the inception structure has been updated to v4. The shape of v1 is slightly extended. In this research, we use the v1 model as a basis to construct three CNN layers, an activation layer, and a maximum pooling layer. Figure 2(a) shows a Design I model using a single inception module, consisting of a complete connection layer and an output layer, and Figure 2(b) represents a Design II model using two inception modules. In Figure 2(c), Szegedy et al. [20] claimed that the use of the incoherence structure was efficient after using the convolution layer. Table 2 summarizes the composite specifications of the constructed incessant model and the detailed parameters for the pooling layer.
Figure 2.
Modified GoogLeNet neural network architectures. (a) Design I: one inception layer. (b) Design II: two inception layers. (c) Design III: CNN layer + one inception layer.
Table 2.
Components of the deep learning model using GoogLeNet inception architecture.
| Deep learning list | Parameters |
|---|---|
| Input size | 200∼600 |
| CNN layer | Number of filters: 15 |
| Kernel size: 5 | |
| Stride: 1 | |
| Padding: 0 | |
| Max-pooling layer | Pooling size: 2 |
| Stride: 2 | |
| Padding: 0 | |
| Inception layer | Number of filters: 3∼15 |
| Kernel size: 1, 3, 5 | |
| Pooling size: 3 × 3 | |
| Stride: 1 | |
| Padding: 0 | |
| FC layer | 2 layers, [100, 50] neurons |
| Output size | 5 classes |
| Iteration | 10 |
| Weight optimization function | Adam |
| Optimization parameters | Learning rate: 0.001, beta1: 0.9, beta2: 0.999 |
| Batch size | 100 |
| Batch normalization | Not used |
| Dropout | Not used |
3.2. Optimization Parameters of the GoogLeNet Deep Learning Model
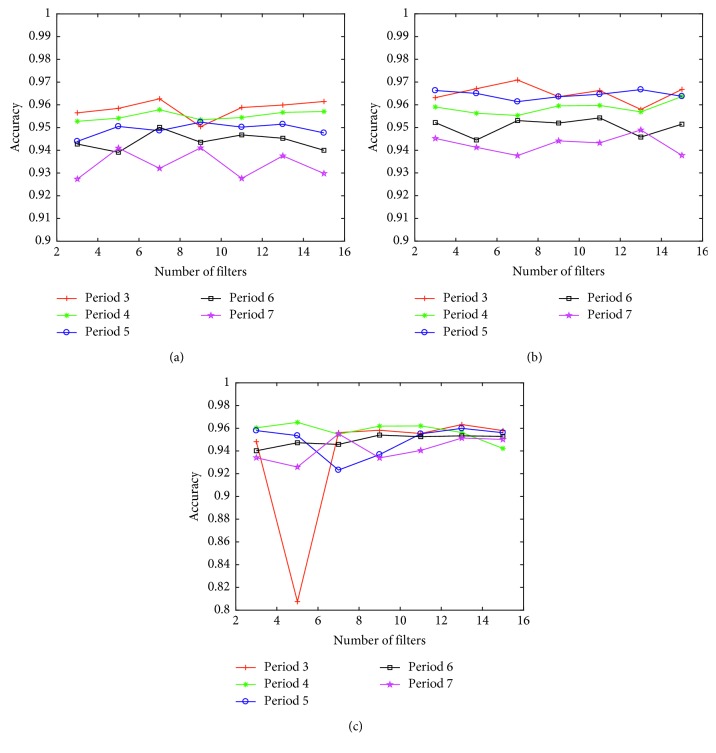
The proposed deep learning model was implemented by MATLAB codes using a desktop PC that comprised AMD FX-8350 CPU and 12 GB memory for matrix computational loads under the Windows 10 operating system. As the number of convolution filters inside the inception increases, the number of filters on the second floor increases by fixing the number of filters on the first floor of the reception to 15, when only the inception layer is used to confirm the change in the arrhythmia classification accuracy. We also evaluated the inception model using the convolution layer together. Even if the number of filters in an inception layer increases, as shown in Figure 3, the accuracy is not significantly enhanced. In fact, the accuracy of the model combined with the convolution layer, and inception layer is reduced by the difference in precision because of the ECG interval representation.
Figure 3.
Accuracy of arrhythmia detection with varying the number of filters changed in the inception model. (a) Design I: one inception layer. (b) Design II: two inception layers. (c) Design III: CNN layer + one inception layer.
To ascertain the influence of the ECG segment on classification accuracy of the arrhythmia in our constructed inception model, the classification accuracy with the highest number of filters on each floor is summarized in Table 3. The combination model of the inception layer with the convolution layer reveals no clear difference from the model of the first floor of the reception, and the difference in accuracy of the ECG segment section decreased from 2.2% to 0.8%. The input data achieved by the inception layer was higher by about 1% in 2-layer inception models. The highest accuracy was achieved with three ECG segments.
Table 3.
Mean accuracy of arrhythmia using the inception model.
| ECG segments (%) | Mean accuracy (%) | |||||
|---|---|---|---|---|---|---|
| 3 | 4 | 5 | 6 | 7 | ||
| Design I | 96.3 | 95.8 | 95.2 | 95 | 94.1 | 95.3 |
| Design II | 97.1 | 96.4 | 96.8 | 95.5 | 95.1 | 96.2 |
| Design III | 96.3 | 96.5 | 96 | 95.4 | 95.5 | 95.9 |
| Mean accuracy (%) | 96.6 | 96.2 | 96 | 95.3 | 94.9 | |
3.3. Expansion of Kernel Size in the GoogLeNet Deep Neural Network Model
The conception filter of the basic inception module seems to be suitable for extracting the feature information of the normalized ECG with a kernel size of 1, 3, and 5, but may not be suitable for deriving information between R–R intervals. Therefore, by increasing the kernel size to 10, 50, and 100, time information included in the ECG such as the R–R interval of the ECG signal could be obtained. To apply this inception model, it can only be used in the first layer directly computed with ECG input data. The arrhythmia classification accuracy is summarized in Figure 4 and Table 4, showing the increasing number of internal convolution filters by 2 steps in the range from 1 to 19 of the inception layer. Thus, the number of filters increases, and the accuracy rises little by little, but the accuracy gets converged to a constant value from nine layers, and the maximum accuracy is achieved when it is comprised of three segments of ECG signals.
Figure 4.
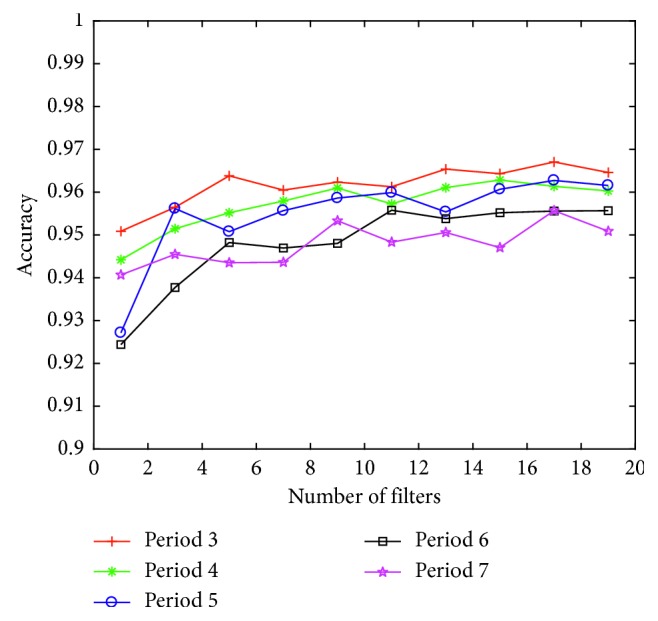
Accuracy of arrhythmia classification of as number of filters in expanded kernel model.
Table 4.
Accuracy of arrhythmia classification by the expanded kernel model with increasing number of filters.
| Number of filters | ECG segments (%) | Mean accuracy (%) | ||||
|---|---|---|---|---|---|---|
| 3 | 4 | 5 | 6 | 7 | ||
| 1 | 95.1 | 94.4 | 92.7 | 92.4 | 94.1 | 93.7 |
| 3 | 95.6 | 95.1 | 95.6 | 93.8 | 94.5 | 94.9 |
| 5 | 96.4 | 95.5 | 95.1 | 94.8 | 94.4 | 95.2 |
| 7 | 96 | 95.8 | 95.6 | 94.7 | 94.4 | 95.3 |
| 9 | 96.2 | 96.1 | 95.9 | 94.8 | 95.3 | 95.7 |
| 11 | 96.1 | 95.7 | 96 | 95.6 | 94.8 | 95.7 |
| 13 | 96.5 | 96.1 | 95.5 | 95.4 | 95.1 | 95.7 |
| 15 | 96.4 | 96.3 | 96.1 | 95.5 | 94.7 | 95.8 |
| 17 | 96.7 | 96.1 | 96.3 | 95.6 | 95.6 | 96.0 |
| 19 | 96.5 | 96 | 96.2 | 95.6 | 95.1 | 95.9 |
| Mean accuracy (%) | 96.2 | 95.7 | 95.5 | 94.8 | 94.8 | |
4. Results
4.1. Evaluation of Arrhythmia of Whole ECG Data
4.1.1. Performance of Basic Inception Module
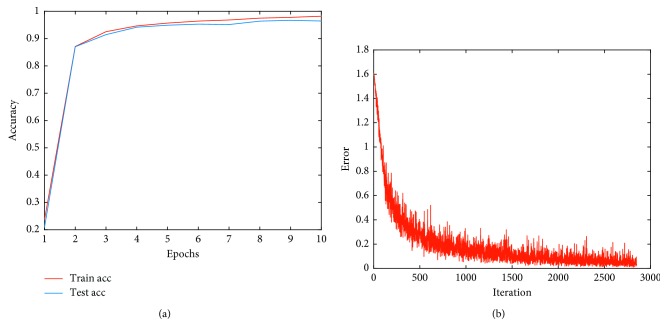
The highest classification performance was achieved by considering three ECG segments. Figure 5 shows the changes in accuracy and errors, and the arrhythmia classification index of the ECG signal is listed in Table 5. APC has the highest error rate of 13.99% of the percentage, and it costs a half portion of the total error at the rate judged to be an error of each arrhythmia rhythm. Therefore, we need to focus on reducing errors in APC.
Figure 5.
Training and testing result by basic inception module. (a) Accuracy. (b) Error.
Table 5.
Arrhythmia classification using the basic inception module.
| Ground truth | Classification result | ||||
|---|---|---|---|---|---|
| NSR | LBBB | RBBB | APC | PVC | |
| NSR | 4,788 | 51 | 39 | 66 | 56 |
| LBBB | 19 | 1,973 | 3 | 3 | 2 |
| RBBB | 21 | 2 | 1,371 | 5 | 1 |
| APC | 41 | 3 | 6 | 541 | 9 |
| PVC | 10 | 6 | 1 | 14 | 1169 |
| Misclassification error (%) | 1.87 | 3.05 | 3.45 | 13.99 | 5.5 |
4.1.2. Expanded Inception Module
The highest accuracy parameter is obtained in the model in which the kernel size was expanded to the nine inception modules, and the number of input data and the number of filters in the ECG three segments are nine. When evaluating the ECG arrhythmia as shown in Figure 6, a change in accuracy and error appears as listed in Table 6, which shows the arrhythmia classification index. From the results of this model, the overall arrhythmia error increased; however, the error rate of APC decreased to 6.78%. Therefore, when using only the first filter on the first floor of inception and nine filters, we can be sure that it effectively responds to APC detection.
Figure 6.
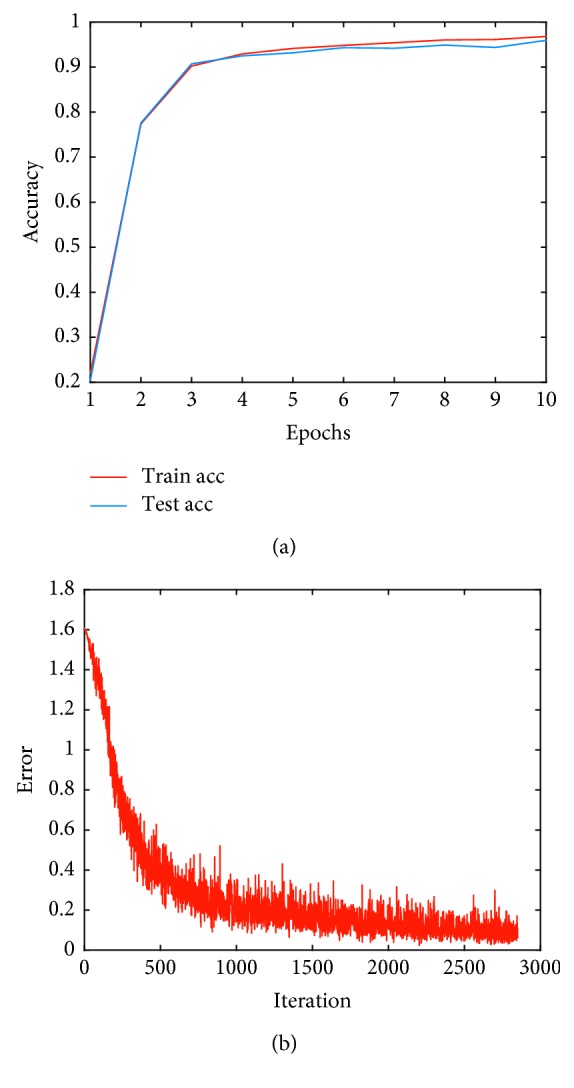
Training and testing of an inception module with expanding kernel size. (a) Sensitivity. (b) Error.
Table 6.
Arrhythmia classification results of the inception module with increased kernel size.
| Ground truth | Classification result | ||||
|---|---|---|---|---|---|
| NSR | LBBB | RBBB | APC | PVC | |
| NSR | 4794 | 81 | 33 | 29 | 63 |
| LBBB | 26 | 1968 | 2 | 0 | 4 |
| RBBB | 25 | 3 | 1363 | 5 | 4 |
| APC | 62 | 14 | 15 | 489 | 20 |
| PVC | 19 | 4 | 1 | 4 | 1172 |
| Misclassification error (%) | 2.68 | 4.93 | 3.61 | 7.21 | 7.2 |
4.2. Evaluation of Patient-Specific Arrhythmia
The ECG signal can vary depending on the patient. The waveform of the cardiovascular symptoms such as the rhythm changes in shape depending on individual differences and the applied measurement device or method. In addition, when analyzing the rhythm of the MIT-BIH arrhythmia data, although two specialists aided in the evaluation, there were cases where the opinions were classified into rhythms that differ from each other. This is the reason why the type of arrhythmia differed for a given pattern. As a result of evaluating the MIT-BIH arrhythmia data with a deep learning model with five arrhythmia rhythms, the arrhythmia classification accuracy did not exceed 97%.
Therefore, we applied the deep learning model, which the evaluation rather presented the important rhythm of the individual custom heart, and classified the input data into the normal and the abnormal rhythm. Given that MIT-BIH 109, 111, 118, 124, 207, 214, and 232 NSR rhythm does not exist and only LBBB and RBBB rhythm exists, LBBB and RBBB can be regarded as normal rhythms. Furthermore, MIT-BIH arrhythmia data are about 2000 pieces for each number. The normal rhythms occupy a considerable part, the basic rhythms are about 20% of the verification data, and the abnormal rhythm is the number in total. Approximately 100 rhythms were sorted out, and the results were derived.
In our experimental simulations, the performance of accuracy, sensitivity, specificity, and positive predictive value (PPV) was evaluated, while varying the size of input data in our deep learning model during the training and test stage true positives (TPs) and true negatives (TNs) were used as metrics to detect abnormal heartbeats. TP refers to the judgements of arrhythmia rhythm, and TN defines the case of detecting NSR beats. Additionally, false positive (FP) refers to the decision of abnormal heart beat on NSR, and false negative (FN) defines the case of classifying NSR beats on the irregular heartbeats.
| (2) |
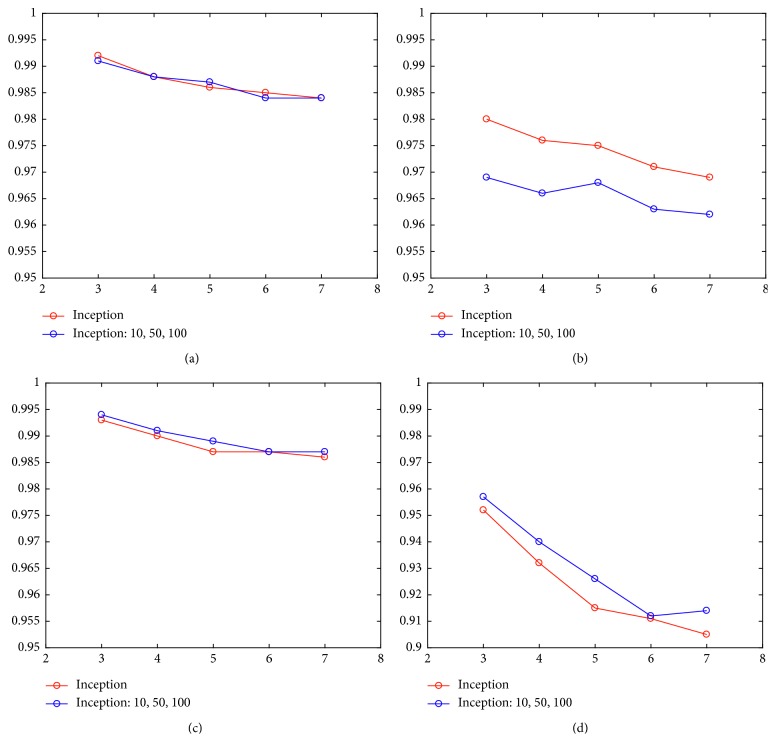
Tables 7 and 8 list the accuracy, sensitivity, specificity, and PPV of all the considered data. Figure 7 shows the comparison of results.
Table 7.
Result of abnormal rhythm detection using the inception model.
| Segment | Acc (%) | Se (%) | Sp (%) | Pp (%) |
|---|---|---|---|---|
| 3 | 99.2 | 98 | 99.3 | 95.2 |
| 4 | 98.8 | 97.6 | 99 | 93.2 |
| 5 | 98.6 | 97.5 | 98.7 | 91.5 |
| 6 | 98.5 | 97.1 | 98.7 | 91.1 |
| 7 | 98.4 | 96.9 | 98.6 | 90.5 |
Table 8.
Result of abnormal rhythm detection using the inception model with expanding kernel size.
| Segment | Acc (%) | Se (%) | Sp (%) | Pp (%) |
|---|---|---|---|---|
| 3 | 99.1 | 96.9 | 99.4 | 95.7 |
| 4 | 98.8 | 96.6 | 99.1 | 94.0 |
| 5 | 98.7 | 96.8 | 98.9 | 92.6 |
| 6 | 98.4 | 96.3 | 98.7 | 91.2 |
| 7 | 98.4 | 96.2 | 98.7 | 91.4 |
Figure 7.
Performance index of patient-specific inception module. (a) Accuracy. (b) Sensitivity. (c) Specificity. (d) PPV.
With regard to the accuracy and specificity with the four indicators, given that the NSR rhythms have more beats than the abnormal waveform in MIT-BIH database, a higher accuracy for the classification of NSR beats was obtained for all cases. Therefore, sensitivity and positive predictive value in the NSR classification must be judged more thoroughly. The sensitivity obtained by using an inception model with convolution filter sizes of [1, 3, 5] was between 96.2 and 96.9% accuracy, which is slightly higher than the expanded inception model. In contrast, in terms of positive prediction, the inception model with convolutional kernel size of [10, 50, 100] was somewhat higher with an accuracy ranging between 91.4 and 95.7%.
5. Conclusions
In this study, we explored the influence of detailed parameters by presenting a model suitable for the evaluation of ECG rhythm via various deep learning models. To accomplish this objective, the MIT-BIH ECG arrhythmia database was used to evaluate arrhythmia classification with varying of the inception structure to classify LBBB, RBBB, PVC, and APC rhythm. Based on Figure 4 and Table 4, the number of filters in the inception module should be at least 5 to detect arrhythmia beat. For the comparison with the previous state-of-the-art concerning the classification of heartbeats, we illustrated Table 9 to show the misclassification error rate of classifying NSR, APC, and PVC beats with the additional specifying accuracy, sensitivity, specificity, and positive predictive value in Table 10.
Table 9.
Classification results compared to the state-of-the-art NSR, APC, and PVC heartbeats classification (%).
| Truth | Classification result | ||||||||
|---|---|---|---|---|---|---|---|---|---|
| Kiranyaz et al. [18] | Luo et al. [25] | Proposed | |||||||
| NSR | APC | PVC | NSR | APC | PVC | NSR | APC | PVC | |
| NSR | 73539 | 824 | 368 | 41873 | 300 | 947 | 4794 | 29 | 63 |
| APC | 837 | 1568 | 178 | 1520 | 282 | 9 | 62 | 489 | 20 |
| PVC | 230 | 72 | 5277 | 1240 | 13 | 1943 | 19 | 4 | 1172 |
| Misclassification error (%) | 1.43 | 36.36 | 9.38 | 6.18 | 52.61 | 32.98 | 1.66 | 6.32 | 6.61 |
Table 10.
Classification results compared with the state-of-the-art PVC and APC heartbeats in terms of Acc, Se, Sp, and Pp (percentage, %).
| Method | PVC | APC | ||||||
|---|---|---|---|---|---|---|---|---|
| Acc | Se | Sp | Pp | Acc | Se | Sp | Pp | |
| Ince et al. [26] | 98.3 | 84.6 | 98.7 | 87.4 | 97.4 | 63.5 | 99 | 53.7 |
| Kiranyaz et al. [18] | 99 | 93.9 | 98.9 | 90.6 | 97.6 | 60.3 | 99.2 | 63.5 |
| Zhang et al. [19] | 99.7 | 97.1 | 99.9 | 98.1 | 99.3 | 85.9 | 99.7 | 88.7 |
| Luo et al. [25] | 95.5 | 60.4 | 97.9 | 66.8 | 96.2 | 15.4 | 99.3 | 47.3 |
| Proposed | 98.64 | 98.40 | 98.70 | 94.90 | 98.31 | 88.75 | 99.40 | 94.40 |
For the case of extended inception deep learning model used in our research, the misclassification error rate of APC was 7.2% for classifying NSR, LBBB, RBBB, APC, and PVC beats, whereas the error rate was 6.32% for classifying only NSR, APC, and PVC beats, which is relatively low compared with the previous research studies. Thus, we can conclude that the extension of the inception deep learning model can detect five distinct ECG rhythms with the highest accuracy of classification for the detection of APC beats.
Acknowledgments
This research was supported by the Basic Science Research Program through the National Research Foundation of Korea (NRF) funded by the Ministry of Education (No. 2018R1A6A3A01011941).
Data Availability
We tested PhysioNet MIT-BIH arrhythmia benchmark databases which are open public data available at http://www.physionet.org.
Conflicts of Interest
The authors declare that there are no conflicts of interests regarding the publication of this article.
References
- 1. Cardiac Arrest Infographic: An Important Public Health Issue, https://www.cdc.gov/dhdsp/docs/cardiac-arrest-infographic.pdf.
- 2.Abedin Z. ECG Interpretation: The Self-Assessment Approach. Hoboken, NJ, USA: Blackwell Future; 2008. [Google Scholar]
- 3.Adamec J., Adamec R. ECG Holter: Guide to Electrocardiographic Interpretation. Berlin, Germany: Springer; 2018. [Google Scholar]
- 4.Xiao R., Xu Y., Pelter M. M., Mortara D. W., Hu X. A deep learning approach to examine ischemic ST changes in ambulatory ECG recordings. AMIA Summits on Translational Science Proceedings. 2018;2017:256–262. [PMC free article] [PubMed] [Google Scholar]
- 5.Malik G. K., Kumar Y., Panda M. Cardiac arrhythmia detection in ECG signals by feature extraction and support vector machine. Proceedings of the Second International Conference on Research in Intelligent and Computing in Engineering, ACSIS; June 2017; Gospeshwar, Uttrakhand, India. pp. 241–244. [Google Scholar]
- 6.Luz E. J. d. S., Schwartz W. R., Cámara-Chávez G., Menotti D. ECG-based heartbeat classification for arrhythmia detection: a survey. Computer Methods and Programs in Biomedicine. 2016;127:144–164. doi: 10.1016/j.cmpb.2015.12.008. [DOI] [PubMed] [Google Scholar]
- 7.Ge D., Srinivasan N., Krishnan S. M. Cardiac arrhythmia classification using autoregressive modeling. Biomedical Engineering Online. 2002;1(5):1–12. doi: 10.1186/1475-925X-1-5. [DOI] [PMC free article] [PubMed] [Google Scholar]
- 8.Gutiérrez-Gnecchi J. A., Morfin-Magaña R., Lorias-Espinoza D., et al. DSP-based arrhythmia classification using wavelet transform and probabilistic neural network. Biomedical Signal Processing and Control. 2017;32:44–56. doi: 10.1016/j.bspc.2016.10.005. [DOI] [Google Scholar]
- 9.Saini I., Saini B. S. Cardiac arrhythmia classification using error back propagation method. International Journal of Computer Theory and Engineering. 2012;14(3):462–464. doi: 10.7763/ijcte.2012.v4.508. [DOI] [Google Scholar]
- 10.Kumari L. V. R., Padma Sai Y., Balaji N., Gowrisree R. Comparison of artificial neural networks for cardiac arrhythmia classification. International Journal of Advance Engineering and Research Development. 2017;4(10):800–805. doi: 10.21090/ijaerd.23063. [DOI] [Google Scholar]
- 11.Mitra M., Samanta R. K. Cardiac arrhythmia classification using neural networks with selected features. Procedia Technology. 2013;10:76–84. doi: 10.1016/j.protcy.2013.12.339. [DOI] [Google Scholar]
- 12.Moody G. B., Mark R. G. The impact of the MIT-BIH arrhythmia database. IEEE Engineering in Medicine and Biology. 2001;20(3):45–50. doi: 10.1109/51.932724. [DOI] [PubMed] [Google Scholar]
- 13.Pyakillya B., Kazachenko N., Mikhailovsky N. Deep learning for ECG classification. Journal of Physics: Conference Series. 2017;913:1–5. doi: 10.1088/1742-6596/913/1/012004. [DOI] [Google Scholar]
- 14.Isin A., Ozdalili S. Cardiac arrhythmia detection using deep learning. Procedia Computer Science. 2017;120:268–275. doi: 10.1016/j.procs.2017.11.238. [DOI] [Google Scholar]
- 15.Rahhal M. M. A., Bazi Y., AlHichri H., Alajlan N., Melgani F., Yager R. R. Deep learning approach for active classification of electrocardiogram signals. Information Sciences. 2016;345:340–354. doi: 10.1016/j.ins.2016.01.082. [DOI] [Google Scholar]
- 16.Mhaskar H., Liao Q., Poggio T. When and why are deep networks better than shallow ones?. Proceedings of the Thirty-first AAAI Conference on Artificial Intelligence (AAAI-17); February 2017; San Francisco, CA, USA. pp. 2343–2349. [Google Scholar]
- 17.Reasat T., Shahnaz C. Detection of inferior myocardial infarction using shallow convolutional neural networks. Proceedings of the IEEE Region 10 Humanitarian Technology Conference (R10-HTC); December 2017; Dhaka, India. pp. 718–721. [Google Scholar]
- 18.Kiranyaz S., Ince T., Gabbouj M. Real-time patient-specific ECG classification by 1-D convolutional neural networks. IEEE Transactions on Biomedical Engineering. 2016;63(3):664–675. doi: 10.1109/tbme.2015.2468589. [DOI] [PubMed] [Google Scholar]
- 19.Zhang C., Wang G., Zhao J., Gao P., Lin J., Yang H. Patient-specific ECG classification based on recurrent neural networks and clustering technique. Proceedings of the LASTED International Conference; February 2017; Innsbruck, Austria. pp. 20–21. [Google Scholar]
- 20.Szegedy C., Liu W., Jia Y., et al. Going deeper with convolutions. Proceedings of the IEEE Conference on Computer Vision and Pattern Recognition (CVPR); June 2015; Las Vegas, NV, USA. pp. 1–9. [Google Scholar]
- 21.Szegedy C., Ioffe S., Vanhoucke V. T., Alem A. A. Inception-v4, inception-resnet and the impact of residual connections on learning. Proceedings of the Thirty-First AAI Conference on Artificial Intelligence (AAAI-17); February 2017; San Francisco, CA, USA. pp. 4278–4284. [Google Scholar]
- 22.He L., Hou W., Zhen X., Peng C. Recognition of ECG patterns using artificial neural network. Proceedings of the International Conference on Intelligent Systems Design and Applications; October 2006; Jinan, China. [Google Scholar]
- 23.Gutiérrez-Gnecchi J. A., Magana R. M., Espinoza D. L., et al. DSP-based arrhythmia classification using wavelet transform and probabilistic neural network. Biomedical Signal Processing and Control. 2017;32:44–56. doi: 10.1016/j.bspc.2016.10.005. [DOI] [Google Scholar]
- 24.Ingole M. D., Alaspure S. V., Ingole D. T. Electrocardiogram (ECG) signals feature extraction and classification using various signal analysis techniques. International Journal of Engineering Sciences & Research Technology. 2014;3(1):39–44. [Google Scholar]
- 25.Luo K., Li J., Wang Z., Cuschieri A. Patient-specific deep architectural model for ECG classification. Journal of Healthcare Engineering. 2017;2017:13. doi: 10.1155/2017/4108720.4108720 [DOI] [PMC free article] [PubMed] [Google Scholar]
- 26.Ince T., Kiranyaz S., Gabbouj M. A generic and robust system for automated patient-specific classification of ECG signals. IEEE Transactions on Biomedical Engineering. 2009;56(5):1415–1426. doi: 10.1109/tbme.2009.2013934. [DOI] [PubMed] [Google Scholar]
Associated Data
This section collects any data citations, data availability statements, or supplementary materials included in this article.
Data Availability Statement
We tested PhysioNet MIT-BIH arrhythmia benchmark databases which are open public data available at http://www.physionet.org.


