

Abstract
Background
Walnuts have beneficial effects on cardiovascular risk factors, but it is unclear whether these effects are attributable to the fatty acid (FA) content, including α‐linolenic acid (ALA), and/or bioactives.
Methods and Results
A randomized, controlled, 3‐period, crossover, feeding trial was conducted in individuals at risk for cardiovascular disease (n=45). Following a 2‐week standard Western diet run‐in (12% saturated FAs [SFA], 7% polyunsaturated FAs, 12% monounsaturated FAs), participants consumed 3 isocaloric weight‐maintenance diets for 6 weeks each: a walnut diet (WD; 7% SFA, 16% polyunsaturated FAs, 3% ALA, 9% monounsaturated FAs); a walnut FA‐matched diet; and an oleic acid–replaced‐ALA diet (7% SFA, 14% polyunsaturated FAs, 0.5% ALA, 12% monounsaturated FAs), which substituted the amount of ALA from walnuts in the WD with oleic acid. This design enabled evaluation of the effects of whole walnuts versus constituent components. The primary end point, central systolic blood pressure, was unchanged, and there were no significant changes in arterial stiffness. There was a treatment effect (P=0.04) for central diastolic blood pressure; there was a greater change following the WD versus the oleic acid–replaced‐ALA diet (−1.78±1.0 versus 0.15±0.7 mm Hg, P=0.04). There were no differences between the WD and the walnut fatty acid‐matched diet (−0.22±0.8 mm Hg, P=0.20) or the walnut FA‐matched and oleic acid–replaced‐ALA diets (P=0.74). The WD significantly lowered brachial and central mean arterial pressure. All diets lowered total cholesterol, LDL (low‐density lipoprotein) cholesterol, HDL (high‐density lipoprotein) cholesterol, and non‐HDL cholesterol.
Conclusions
Cardiovascular benefits occurred with all moderate‐fat, high‐unsaturated‐fat diets. As part of a low‐SFA diet, the greater improvement in central diastolic blood pressure following the WD versus the oleic acid–replaced‐ALA diet indicates benefits of walnuts as a whole‐food replacement for SFA.
Clinical Trial Registration
URL: https://www.clinicaltrials.gov. Unique identifier: NCT02210767.
Keywords: α‐linolenic acid, arterial stiffness, bioactives, nutrition, polyunsaturated fatty acids, pulse‐wave velocity, walnuts
Subject Categories: High Blood Pressure, Hypertension, Cardiovascular Disease, Diet and Nutrition, Obesity
Clinical Perspective
What Is New?
Replacing saturated fatty acids (FAs) with 57 to 99 g/d of walnuts for 6 weeks reduced central diastolic blood pressure compared with a diet similarly low in saturated FAs but with lower α‐linolenic acid content (α‐linolenic acid was replaced with oleic acid).
None of the 3 treatment diets, which replaced saturated FAs with unsaturated fats, altered markers of arterial stiffness after 6 weeks.
The effects observed in our study occurred in participants with overweight and obesity, without concomitant changes in body weight.
What Are the Clinical Implications?
This study represents a feasible food‐based approach for replacing saturated FAs with unsaturated FAs (including α‐linolenic acid) from walnuts and vegetable oils, demonstrating that relatively small dietary changes can reduce cardiovascular risk.
The reduction in central diastolic blood pressure in the absence of changes in central systolic blood pressure or arterial stiffness following a walnut‐rich diet warrants further investigation of α‐linolenic acid–rich foods, including walnuts.
Introduction
Deaths attributable to high blood pressure (BP), a major risk factor for atherosclerotic cardiovascular disease (CVD),1 rose by 37.5% from 2005 to 2015 in the United States.2 Normal BP is defined as less than 120/80 mm Hg3 and predicts lower risk of major adverse cardiovascular events.4 Central BP, also termed aortic pressure, more directly indicates risk of major adverse cardiovascular events compared with brachial BP and thus is also a target for reducing CVD risk.5, 6 A healthy diet is important for prevention and management of elevated BP, and simple and effective dietary recommendations are needed.
Walnuts are a rich source of polyunsaturated fatty acids (PUFA), including the n‐3 PUFA α‐linolenic acid (ALA) and the n‐6 PUFA linoleic acid, and contain a proportionally greater quantity of polyphenolic compounds compared with other tree nuts and vegetable oils.7, 8 Observational findings show an association between ALA intake and lower brachial BP, and clinical studies have demonstrated that ALA reduces brachial BP.9, 10, 11, 12 Because walnuts are rich in PUFA, particularly n‐3 PUFA, replacement of saturated fatty acids (SFA) with unsaturated fatty acids from walnuts is a potential strategy that aligns with current dietary guidelines and recommendations from authoritative organizations such as the American Heart Association, the National Lipid Association, and the American College of Cardiology to reduce CVD risk.13, 14, 15, 16
Walnut consumption has been shown to consistently lower LDL (low‐density lipoprotein) cholesterol (LDL‐C),17, 18, 19, 20, 21 but less is known about the effects on other CVD risk factors. A previous controlled feeding trial reported a reduction in brachial diastolic BP (bDBP) following 6 weeks of walnut consumption (37 g walnuts per day).18 However, it remains unclear how walnut consumption affects central BP and arterial stiffness. Furthermore, previous clinical trials have not investigated whether the significant cardioprotective effects of walnuts are attributable to the fatty acid profile, including ALA, and/or the bioactive compounds they contain, such as tocopherols and phenolics.
This controlled feeding study in adults with increased cardiovascular risk tested the effects of macronutrient‐matched diets designed to be lower in SFA (according to the 2015–2020 Dietary Guidelines for Americans15) and proportionately higher in unsaturated fatty acids derived from (1) 57 to 99 g (2–3.5 oz) whole walnuts, (2) vegetable oils providing a fatty acid profile identical to that of whole walnuts without walnut bioactives, and (3) monounsaturated fatty acids (MUFA) as oleic acid substituted for the ALA content of walnuts. We hypothesized that the diet containing whole walnuts would promote greater reductions in central BP and other CVD risk factors, given the combination of fatty acids and bioactives.
Methods
The authors declare that all supporting data are available in the article (and in the online supplementary files).
Study Design and Randomization
This study was a randomized, crossover, controlled‐feeding trial conducted to examine the effect of a diet containing whole walnuts (walnut Diet [WD]), a diet with the same fatty acid composition as the WD but devoid of walnuts (walnut fatty acid–matched diet [WFMD]), and a diet that replaced the amount of ALA contributed by walnuts with oleic acid (oleic acid replaces ALA diet [ORAD]). All other nuts were restricted during the run‐in and 3 diet periods. The study design is depicted in Figure 1. Eligible participants completed a 2‐week run‐in on a standard Western diet. After completion of the run‐in diet, baseline assessments were completed, and participants were randomized using a 6‐sequence randomization scheme (computer generated using Randomization.com [http://www.randomization.com/] in blocks of 6). In random order, participants consumed each of 3 diets for 6 weeks, with compliance breaks after the first and second diet periods (mean: 22.8 days; range: 1–164 days). Investigators and study personnel involved in data collection and analysis were blinded to treatment allocation. Only the Metabolic Diet Study Center (MDSC) manager was aware of the treatment allocation to assign participants to the correct menus.
Figure 1.
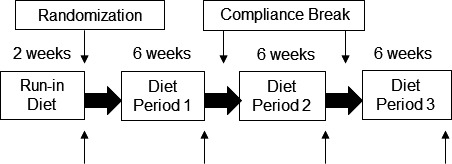
Study design for this randomized, 3‐period, crossover, controlled‐feeding trial. ↑ indicates end point testing (vascular assessment and fasting blood draw completed on the last 2 days of the run‐in diet and study diets). The average compliance break between diet periods was 23 days. All foods and caloric beverages were provided for all diet periods and the run‐in diet.
The primary end point for the study was central systolic BP (cSBP). Secondary end points included central diastolic BP (cDBP), central mean arterial pressure (cMAP) and brachial MAP (bMAP), brachial SBP (bSBP) and bDBP, central pulse pressure (PP) and brachial PP, augmentation pressure (AP), augmentation index (AIx), heart rate, pulse transit time (PTT), pulse‐wave velocity (PWV), total cholesterol (TC), LDL‐C, HDL (high‐density lipoprotein) cholesterol (HDL‐C), non–HDL‐C, TC:HDL‐C, triglycerides, glucose, insulin, and high‐sensitivity C‐reactive protein (CRP). All procedures involving human subjects were approved by the Institutional Review Board of the Pennsylvania State University (University Park, PA). Written informed consent was obtained from all participants before enrollment in the study. All study samples were collected and procedures were conducted at the Pennsylvania State University Clinical Research Center (CRC). This trial is registered as ClinicalTrials.gov identifier NCT02210767.
Participants
Men and women with overweight and obesity (body mass index [BMI; kg/m2], 25–40), aged 30 to 65 years, who had LDL‐C between the 50th and 90th percentiles from a nationally representative sample22 (128–177 mg/dL for men and 121–172 mg/dL for women) and/or elevated brachial BP (120–159/80–99 mm Hg for bSBP/bDBP) in central Pennsylvania were eligible for this study. Exclusion criteria included smoking; BP ≥160/100 mm Hg; and a history of myocardial infarction, stroke, diabetes mellitus, liver disease, kidney disease, thyroid disease (unless controlled with medication), gastrointestinal diseases, and inflammatory diseases. Individuals taking the following supplements or medications were excluded unless they were willing to discontinue use before enrolling in and for the duration of the study: nutritional supplements (eg, whey protein powder), herbs, vitamins or minerals, NSAIDs, BP‐lowering medications, cholesterol‐lowering medications or supplements (eg, psyllium, fish oil capsules, soy lecithin, niacin, fiber, flax, phytoestrogens), and stanol/sterol supplemented foods. Women who were lactating, pregnant, or planning to become pregnant were excluded from the study. Individuals who were following a vegetarian or vegan diet or had nut allergies were also excluded. Individuals who consumed >14 alcoholic drinks per week before screening or who were not willing to maintain their physical activity habits throughout the course of the study were excluded.
Participant Recruitment
Participants were recruited from October 2014 to September 2017 via flyers posted on university and community bulletin boards, local newspaper advertisements, radio advertisements, campus email lists, and a university research website. Potential participants emailed or called to indicate interest in participating in the study and were then given additional information about the study. If interested, individuals were asked a series of medical history and lifestyle questions via a telephone screening to obtain information about key inclusion and exclusion criteria and to determine eligibility. Following the telephone screening, an in‐person screening appointment was scheduled at the CRC to confirm eligibility. After a 12‐hour fast and avoidance of alcohol for 48 hours, individuals had their height, weight (without shoes and in light clothing), and resting BP measured (validated sphygmomanometer) by trained nurses. The mean of the last 2 of 3 BP readings was used to determine eligibility. A fasting blood sample was also collected for a blood chemistry measurement and analysis of lipids and lipoproteins.
Study Diets
Participants were fed isocaloric weight maintenance diets. Energy requirements were calculated using the Harris‐Benedict equation,23 and adjustments were made as needed throughout the course of the study. Diets were similar except for the fatty acid profile and the presence or absence of walnuts (Table 1). Differences in the nutrient profile of the diets are entirely due to the different fatty acids supplied through the study foods (Table 2). The run‐in diet consisted of a similar macronutrient profile as the test diets, but the amount of SFA provided was representative of typical SFA intake in the United States (12% of calories),24 and thus the diet was proportionally lower in PUFA and MUFA compared with the study diets. The WD included 18% of daily energy from walnuts delivered as a snack (57–99 g/d, containing 5–8.8 g/d ALA) and matched the macronutrient profile of the 2 other test diets. The WFMD provided the same amount of ALA and PUFA as the WD but was devoid of walnuts (and walnut bioactives). In the ORAD, 83% of ALA was replaced with oleic acid, which is the amount of ALA delivered from walnuts in the WD. The ORAD was also devoid of walnuts, and all other fatty acids were held constant.
Table 1.
Nutrient Composition of the Study Diets
| Nutrient | SWD (run‐in) | WD | WFMD | ORAD |
|---|---|---|---|---|
| Total fata | 34 | 35 | 35 | 35 |
| SFAa | 12 | 7 | 7 | 7 |
| MUFAa | 12 | 9 | 9 | 12 |
| PUFAa | 7 | 16 (ALA 2.7a) | 16 (ALA 2.6a) | 14 (ALA 0.4a) |
| Carbohydratea | 50 | 48 | 48 | 48 |
| Proteina | 16 | 17 | 17 | 17 |
| Fiber, g/d | 25 | 30 | 26 | 26 |
| Cholesterol, mg/d | 202 | 117 | 169 | 163 |
All diets used the same 6‐day cycle menu, developed using Food Processor SQL software v10.8 (ESHA Research). ALA indicates α‐linolenic acid; MUFA, monounsaturated fatty acids; ORAD, oleic acid–replaces–α‐linolenic acid diet; PUFA, polyunsaturated fatty acids; SFA, saturated fatty acids; SWD, standard Western diet; WD, walnut diet; WFMD, walnut fatty acid–matched diet.
Percentage of total calories based on a 2100‐cal diet.
Table 2.
Sample Menu From 1 Day of the 6‐Day Cycle Menu
| Run‐in Diet | WD | WFMD | ORAD |
|---|---|---|---|
| Breakfast | |||
| 2% milk | Nonfat milk | Nonfat milk | Nonfat milk |
| Granola | Wheat English muffin | Wheat English muffin | Wheat English muffin |
| Light yogurt | Egg beaters | Egg beaters | Egg beaters |
| Wheat bagel | Orange | Orange | Orange |
| Butter | Margarine | ||
| Lunch | |||
| Wheat bun | Wheat bun | Wheat bun | Wheat bun |
| Chicken breast | Veggie burger | Veggie burger | Veggie burger |
| Canola mayonnaise | American cheese | American cheese | American cheese |
| Chipotle spread | Lettuce | Lettuce | Lettuce |
| Fruit blend | Dijon mustard | Dijon mustard | Dijon mustard |
| Sun Chips | Graham crackers | Graham crackers | Graham crackers |
| Pear | Pear | Pear | |
| Italian dressing | |||
| Sunflower oil | |||
| Dinner | |||
| Vegetarian chili | Chicken breast | Chicken breast | Chicken breast |
| Cheddar cheese | Spaghetti | Spaghetti | Spaghetti |
| Lettuce | Thai noodles and veggies | Thai noodles and veggies | Thai noodles and veggies |
| Cherry tomatoes | Lettuce | Lettuce | Lettuce |
| Carrots | Carrots | Carrots | Carrots |
| Light Italian dressing | Cherry tomatoes | Cherry tomatoes | Cherry tomatoes |
| Cornbread muffin | Light Italian dressing | Light Italian dressing | Italian dressing |
| White dinner roll | Flaxseed oil | High oleic safflower oil | |
| High linoleic safflower oil | High linoleic safflower oil | ||
| Snack | |||
| M&M's | Sun Chips | Sun Chips | Sun Chips |
| Walnuts | |||
ORAD, oleic acid–replaces–α‐linolenic acid diet; WD, walnut diet; WFMD, walnut fatty acid–matched diet.
All diets used the same 6‐day‐cycle menu, developed using Food Processor SQL software v10.8 (ESHA Research) and prepared in the Pennsylvania State University MDSC. Participants picked up food daily Monday through Friday. On Fridays, participants were provided with a cooler containing Saturday and Sunday meals and snacks. Compliance was assessed using daily food logs that participants completed and monitoring participant daily body weight logs kept at the MDSC. Participants consumed noncaloric beverages ad libitum but were limited to <1184 mL/d caffeinated beverages (5 cups per day) and ≤2 alcoholic drinks per week.
Assessment of Outcome Measurements
Baseline and end point testing was conducted on the final 2 days of the run‐in diet and the study diets. All study procedures were conducted at the Pennsylvania State University CRC according to standardized procedures. Before testing, participants were instructed to fast for 12 hours, to take only preapproved medications, to avoid strenuous exercise, and to refrain from consuming caffeine‐containing products and alcohol for 48 hours. At each visit, vascular function testing was performed before blood sampling. Fasting blood samples were collected by trained nurses for analysis of lipids, lipoproteins, glucose, insulin, and markers of inflammation.
BP and Vascular Measures
The SphygmoCor XCEL system (AtCor Medical) was used to assess cSBP, cDBP, cMAP, bSBP, bDBP, bMAP, central and brachial PP, AP, AIx (adjusted to a heart rate of 75 beats/min), heart rate, PTT, and PWV. Before measurements, participants were fitted with the correct size BP cuff, and these cuffs were consistently used for the remainder of the study. All measurements were performed by trained research personnel in a quiet, temperature‐controlled room.
Pulse wave analysis
The SphygmoCor XCEL system uses a brachial cuff–based method to estimate central BP, AP, and AIx through a generalized transfer function that has been validated against the indwelling catheter method.25, 26 Following a 5‐minute seated rest, measurements were taken 3 times, following the guidelines of the Seventh Report of the Joint National Committee on Prevention, Detection, Evaluation, and Treatment of High Blood Pressure,27 with a 1‐minute rest period between each measurement. The last 2 results were averaged and used for analysis. If the brachial BP measurements were inconsistent (ie, >10 mm Hg difference for SBP or >5 mm Hg difference for DBP), a fourth reading was taken. The AIx was standardized to a heart rate of 75 beats/min to correct for the independent inverse effect of heart rate augmentation of the pulse wave form and is reported as AIx.
Pulse wave velocity
Carotid to femoral PWV was assessed noninvasively using the SphygmoCor XCEL system, the gold standard for noninvasive measurement of arterial stiffness.28 Briefly, carotid and femoral arterial pressure waveforms were simultaneously captured via applanation tonometry of the carotid artery and a femoral BP cuff according to the manufacturer's instructions. Three PWV measurements were obtained in the supine position, with the last 2 measures averaged for analysis.
Blood Sample Collection and Assay Methods
Blood was drawn into anticoagulated tubes containing lithium heparin or EDTA and immediately centrifuged for 15 minutes. Blood drawn into serum separator tubes was allowed to clot for 30 minutes at room temperature and then centrifuged for 15 minutes. Serum TC, triglycerides, and plasma glucose were directly measured using spectrophotometry at a certified commercial laboratory (Quest Diagnostics). Non–HDL‐C was calculated by subtracting HDL‐C from TC. LDL‐C was calculated using the Friedewald equation (LDL‐C=TC−[HDL‐C+triglycerides/5]); no participants had triglyceride values above the limit for this equation.29 Serum high‐sensitivity CRP was measured using nephelometry, and insulin (serum) was measured by immunoassay (Quest Diagnostics).
Statistical Analysis
All statistical analyses were performed with SAS (v9.4; SAS Institute). All randomized individuals were included in the data analyses for each outcome variable consistent with intent‐to‐treat principles. Outcome variables were checked for normality (PROC UNIVARIATE), and positively skewed variables (residuals skew >1; triglycerides and high‐sensitivity CRP) were logarithmically transformed. Individuals with acutely elevated CRP (ie, high‐sensitivity CRP ≥10 mg/L) values at the end of diet periods were excluded from all CRP analyses because such values are indicative of an acute infection. Differences between male and female participants at baseline were assessed by independent 2‐sample t tests (PROC TTEST). The change from baseline following each treatment, for each outcome measure, was calculated by subtracting baseline measurements after the run‐in diet from post–diet‐period values.
The mixed models procedure (PROC MIXED) was used to assess effects of the study diets on outcome measures at a predetermined α value of 0.05. The mixed models procedure does not perform listwise deletion and preserves the degrees of freedom, thus allowing for inclusion of participants with ≥1 missing data point in the analyses and permitting an intent‐to‐treat approach to be used to analyze data from participants who withdrew before completing all end point testing. The primary analyses investigated whether there was a difference in the change from baseline between the study diets for each outcome; within‐diet change from baseline was also determined. Secondary analyses were conducted for between‐diet mean values at the end of each diet period for all outcome variables. Selection of model covariance structures was based on optimizing fit statistics (evaluated as lowest Bayesian information criterion). Baseline values were included as a covariate for assessing differences between the mean values of outcome variables. The effects of sex, randomization sequence, and their interaction with diet were added to the model to determine whether carryover or sex effects were present. No carryover effects of the study diets were detected for any outcome. The only variable with a significant sex×diet interaction was PTT. Tukey–Kramer‐corrected P values were used to correct for multiple comparisons.
Unblinded exploratory analyses were conducted to identify potential predictors (ie, BMI) of participants’ responsiveness to the different study diets. The predictor of interest, BMI, was categorized into 3 classifications: overweight (25 to <30), obese I (30 to <35), and obese II (35 to <40). The categorized variable was added to the mixed model as a main effect, and the interaction with diet was also examined.
Power for this study was calculated based on the primary end point of cSBP. A sample size of 32 people was required to provide 90% power to detect a 3±5‐mm Hg difference between the study diets with a 2‐sided α=0.05.18
Results
Participants and Baseline Characteristics
A detailed diagram of the flow of participants through the study is provided in Figure 2. Briefly, 99 participants were consented and screened for eligibility, 45 were randomized, and 36 completed the trial. The overall dropout rate after randomization of eligible volunteers was 20%. Three participants dropped out during each of the 3 diet periods, resulting in 7 participants not completing the WD and WFMD and 4 participants not completing the ORAD. Daily compliance with the dietary protocol was 91% (median) among participants who were included in data analyses (Table S1). Noncompliance was considered to be any self‐reported deviation from the controlled‐feeding dietary protocol. No participants reported any challenges in consuming the amount of walnuts provided. Walnuts were given as an evening snack, but participants had the option of consuming them throughout the day. Baseline characteristics for participants who completed the trial were not statistically different from participants who did not complete the trial (Table S2). A similar number of men and women were randomized to the study (Table 3). There were no differences in baseline BMI, TC, LDL‐C, non–HDL‐C, glucose, insulin, brachial BP, or central BP between men and women. There were significant differences in age, HDL‐C, TC:HDL‐C, central PP, AP, AIx, and PTT between men and women at baseline. Participants had elevated BP (mean±SD: 121±11.2/77±7.8 mm Hg) and LDL‐C (119.2±30.7 mg/dL).
Figure 2.
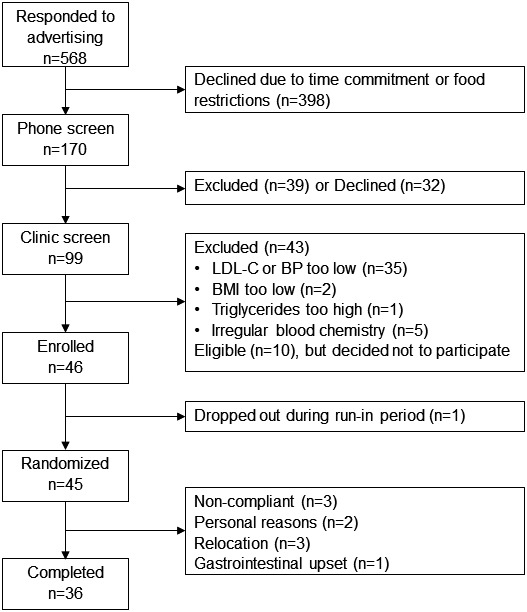
CONSORT diagram of participant flow through the study. BMI indicates body mass index; BP, blood pressure; CONSORT, Consolidated Standards of Reporting Trials; LDL‐C, low‐density lipoprotein cholesterol.
Table 3.
Baseline Characteristics of Participants Randomized to Study Diets
| Characteristica | Women | Men | Total | P valuea |
|---|---|---|---|---|
| n | 20 | 25 | 45 | 0.75 |
| Age, y | 47±9 | 40±11 | 43±10 | 0.04 |
| BMI, kg/m2 | 30.8±5.2 | 29.9±4.3 | 30.3±4.7 | 0.52 |
| TC, mg/dL | 187.5±28.9 | 190.9±36.4 | 189.4±33.0 | 0.74 |
| HDL‐C, mg/dL | 52.9±11.8 | 41.5±6.8 | 46.6±10.8 | 0.001 |
| LDL‐C, mg/dL | 114.8±27.0 | 122.6±33.6 | 119.1±30.7 | 0.40 |
| TC:HDL‐C ratio | 3.7±1.0 | 4.7±1.1 | 4.2±1.1 | 0.004 |
| Non–HDL‐C, mg/dL | 134.7±30.4 | 149.3±34.9 | 142.8±33.4 | 0.15 |
| TG, mg/dL | 98.4±31.4 | 133.2±64.1 | 117.7±54.5 | 0.03 |
| Glucose, mg/dL | 89.6±6.5 | 91.9±8.1 | 90.9±7.4 | 0.30 |
| Insulin, μIU/mL | 7.3±3.6 | 6.4±3.8 | 6.8±3.7 | 0.42 |
| bSBP, mm Hg | 121±11 | 121±12 | 121±11 | 0.92 |
| bDBP, mm Hg | 77±8 | 77±8 | 77±8 | 0.98 |
| cSBP, mm Hg | 113±9 | 110±10 | 111±10 | 0.33 |
| cDBP, mm Hg | 78±8 | 78±8 | 78±8 | 0.85 |
| AP, mm Hg | 12±5 | 6±4 | 8±5 | <0.0001 |
| AIx, % | 32±12 | 15±13 | 22.3±15 | <0.0001 |
| PTT, ms | 64±9 | 71±7 | 68±9 | 0.004 |
| PWV, m/s | 7.1±0.9 | 6.8±0.9 | 6.9±1.0 | 0.38 |
Data presented as mean±SD. Baseline measurements were taken on the last 2 days of run‐in diet. AIx indicates augmentation index; AP, augmentation pressure; bDBP, brachial diastolic blood pressure; BMI, body mass index; bSBP, brachial systolic blood pressure; cDBP, central diastolic blood pressure; cSBP, central systolic blood pressure; HDL‐C, high‐density lipoprotein cholesterol; LDL‐C, low‐density lipoprotein cholesterol; PTT, pulse transit time; PWV, pulse‐wave velocity; TC, total cholesterol; TG, triglycerides.
Differences between men and women were computed using a Student t test (α<0.05).
BP and Vascular Measurements
The WD, WFMD, and ORAD did not significantly change cSBP, the primary end point, from baseline, and there were no significant differences between diets for the magnitudes of change (Figure 3, Table S3) or mean values (Table 4). There was a main treatment effect of diet for cDBP (P=0.04) and a significant reduction from baseline following the WD (−1.8±1.0 mm Hg, P=0.02) only. Post hoc comparisons showed a greater change from baseline for cDBP following the WD compared with the ORAD (0.2±0.7 mm Hg, P=0.04), but the changes were not different between the WD and the WFMD (−0.2±0.8 mm Hg, P=0.2) or between the WFMD and the ORAD (P=0.7). Mean cDBP was lower after the WD (76.1±1.1 mm Hg) compared with the ORAD (78.3±1.1mm Hg, P=0.02), but there were no differences between the WD and the WFMD or between the WFMD and the ORAD. The WD lowered brachial MAP (−1.4±0.7 mm Hg, P=0.04) and cMAP (−1.7±0.8 mm Hg, P=0.02) compared with baseline, but there were no differences between the diets. There were no statistically significant changes from baseline, differences in magnitudes of change, or diet effects for brachial SBP, bDBP, brachial PP, central PP, AP, AI, heart rate, PTT, or PWV (Tables 4 and 5).
Figure 3.
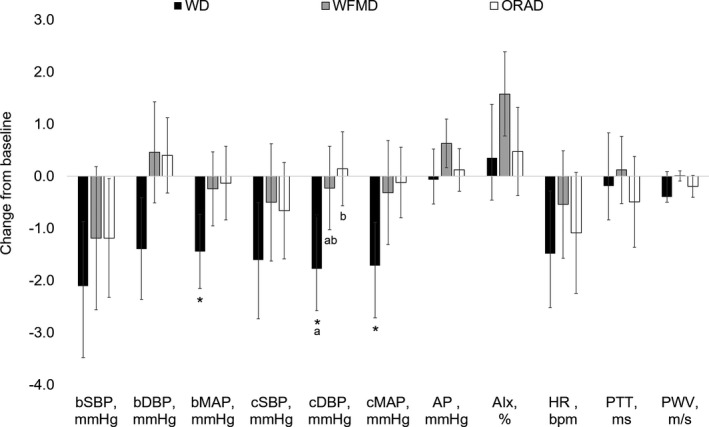
Mean changes from baseline for blood pressure and vascular measures following each of the three 6‐week study diets (n=45). Data are presented as unadjusted mean±SEM. Change scores were calculated by subtracting the values following the run‐in diet from values following each study diet and were compared using the MIXED procedure (SAS v9.4; SAS Institute). There was a significant reduction in bMAP, cDBP, and cMAP from baseline following the WD. Post hoc comparisons showed a significant difference in cDBP between the WD compared with the ORAD and no differences between the WD and the WFMD or the WFMD and the ORAD. Post hoc pairwise tests were adjusted for multiple comparisons using the Tukey–Kramer method; statistically significant between‐diet effects are denoted with differing letters (P<0.05). AIx indicates augmentation index; AP, augmentation pressure; bDBP, brachial diastolic blood pressure; bMAP, brachial mean arterial pressure; bSBP, brachial systolic blood pressure; cDBP, central DBP; cMAP, central MAP; cSBP, central systolic BP; HR, heart rate; ORAD, oleic acid–replaces–α‐linolenic acid diet; PTT, pulse transit time; PWV, pulse‐wave velocity; WD, walnut diet; WFMD, walnut fatty acid–matched diet.
Table 4.
Between‐Diet Comparisons of Vascular Measures
| Outcome Variablesa | SWD (Run‐in) | WD | WFMD | ORAD | Diet P‐Valuea |
|---|---|---|---|---|---|
| bSBP, mm Hg | 121±1.7 | 119±1.6 | 120±1.4 | 120±1.5 | 0.73 |
| bDBP, mm Hg | 77±1.2 | 76±1.1 | 77±1.0 | 78±1.1 | 0.051 |
| bPP, mm Hg | 44±1.0 | 44±1.0 | 42±1.1 | 43±0.9 | 0.24 |
| bMAP, mm Hg | 92±1.3 | 90±1.2 | 92±1.0 | 92±1.2 | 0.15 |
| cSBP, mm Hg | 111±1.5 | 110±1.4 | 111±1.3 | 110±1.3 | 0.71 |
| cDBP, mm Hg | 78±1.1 | 76±1.1a | 78±0.9ab | 78±1.1b | 0.04 |
| cPP, mm Hg | 33±0.7 | 33±0.9 | 33±0.8 | 32±0.8 | 0.24 |
| cMAP, mm Hg | 89±1.2 | 87±1.1 | 89±1.0 | 89±1.1 | 0.12 |
| AP, mm Hg | 8±0.8 | 9±0.8 | 9±0.9 | 8±0.7 | 0.80 |
| AIx, % | 22±2.2 | 22±2.2 | 23±2.3 | 22±2.1 | 0.59 |
| HR, beats/min | 66±1.5 | 64±1.7 | 64±1.4 | 64±1.6 | 0.76 |
| PTT, ms | 68±1.3 | 68±67.5 | 69±1.3 | 67±1.2 | 0.52 |
| PWV, m/s | 7±0.1 | 7±0.1 | 7±0.1 | 7±0.1 | 0.43 |
Data are presented as mean±SEM. AIx indicates augmentation index; AP, augmentation pressure; bDBP, brachial diastolic blood pressure; bDBP, brachial systolic blood pressure; bPP, brachial pulse pressure; cDBP, central diastolic blood pressure; cMAP, central mean arterial pressure; cPP, central pulse pressure; cSBP, central systolic blood pressure; HR, heart rate; ORAD, oleic acid–replaces–α‐linolenic acid diet; PTT, pulse transit time; PWV, pulse‐wave velocity; SWD, standard Western diet; WD, walnut diet; WFMD, walnut fatty acid–matched diet.
The MIXED procedure was used to determine the effect of diet on each outcome measure adjusted for the baseline value (SAS v9.4; SAS Institute). Post hoc tests were adjusted for multiple comparisons using the Tukey–Kramer method. Statistically significant between‐diet differences are denoted with differing letters (P<0.05).
Table 5.
Between‐Diet Differences in Blood Measures and Weight
| Outcome Variablesa | SWD (Run‐In) | WD | WFMD | ORAD | Diet P‐Valuea |
|---|---|---|---|---|---|
| TC, mg/dL | 189.4±4.9 | 176.1±5.0 | 176.6±4.7 | 181.1±4.2 | 0.11 |
| LDL‐C, mg/dL | 119.2±4.6 | 107.3±4.3 | 108.6±4.3 | 112.3±3.8 | 0.08 |
| HDL‐C, mg/dL | 46.6±1.6 | 45.4±1.8 | 44.8±1.8 | 45.3±1.7 | 0.41 |
| Non–HDL‐C, mg/dL | 142.8±4.9 | 130.7±4.9 | 131.9±4.8 | 135.0±4.21 | 0.41 |
| TC:HDL‐C ratio | 4.3±0.2 | 4.1±0.2 | 4.2±0.2 | 4.2±0.2 | 0.45 |
| TG, mg/dL | 117.7±8.1 | 116.5±8.5 | 117.4±8.1 | 118.1±8.3 | 0.70 |
| Glucose, mg/dL | 90.9±1.1 | 93.16±1.0 | 92.57±1.2 | 91.68±1.1 | 0.33 |
| Insulin, μIU/mL | 6.8±0.6 | 6.02±0.5 | 6.56±0.6 | 6.72±0.7 | 0.85 |
| CRP, mg/L | 2.1±0.3 | 2.4±0.4 | 2.40±0.5 | 2.22±0.4 | 0.18 |
| Weight, kg | 92.5±2.8 | 92.0±3.1 | 91.5±3.0 | 91.2±3.2 | 0.34 |
Data are presented as mean±SEM. CRP indicates C‐reactive protein; HDL‐C, high‐density lipoprotein cholesterol; LDL‐C, low‐density lipoprotein cholesterol; ORAD, oleic acid–replaces–α‐linolenic acid diet; SWD, standard Western diet; WD, walnut diet; WFMD, walnut fatty acid–matched diet; TC, total cholesterol; TG, triglycerides.
The MIXED procedure was used to determine the effect of diet on each outcome measure adjusted for the baseline value (SAS v9.4; SAS Institute). Post hoc tests were adjusted for multiple comparisons using the Tukey–Kramer method; there were no statistically significant between‐diet differences (P<0.05). TG and CRP were log transformed due to right skew.
Lipids and Lipoproteins
The WD (−15.8±3.2 mg/dL; P<0.0001), the WFMD (−14.6±2.9 mg/dL; P<0.0001), and the ORAD (−11.2±2.7 mg/dL; P<0.0001) all significantly decreased TC from baseline, but the magnitudes of change from baseline were not significantly different between groups (P=0.3; Figure 4, Table S4). Similarly, the WD (−13.4±2.9 mg/dL; P<0.0001), the WFMD (−11.1±2.3 mg/dL; P<0.0001), and the ORAD (−9.2±2.3 mg/dL, P<0.0001) all significantly improved LDL‐C from baseline, with no differences between study diets (P=0.5). The WD, WFMD, and ORAD also lowered HDL‐C from baseline (−1.8±0.8 mg/dL, P<0.0001; −2.1±0.9 mg/dL, P<0.0001; −1.1±0.7 mg/dL, P<0.0001, respectively), with no differences between study diets (P=0.4). Non–HDL‐C was reduced following the WD, WFMD, and ORAD (−14.0±2.9 mg/dL, P<0.006; −12.5±2.5 mg/dL, P<0.0009; −11.0±2.2, P<0.03, respectively; P=0.5 for differences between diets). The TC:HDL‐C decreased after the WD compared with baseline (P=0.03), but there was no main effect of diet (P=0.5). Triglycerides did not significantly change from baseline after any study diets. There were no significant differences between group means for the 3 study diets for TC, LDL‐C, HDL‐C, non–HDL‐C, TC:HDL‐C, or triglycerides (Table 5).
Figure 4.
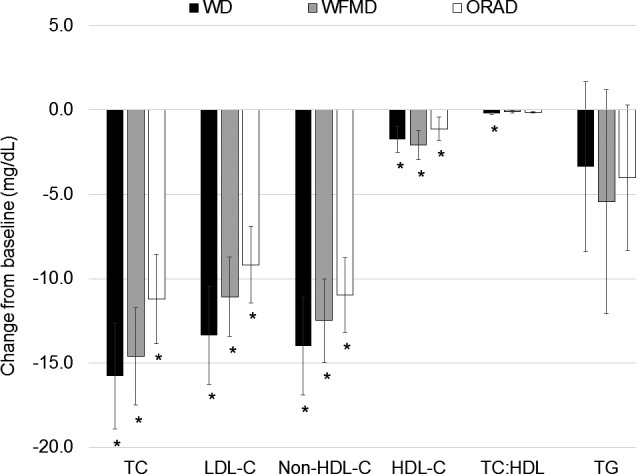
Mean changes from baseline for lipids and lipoproteins following each of the three 6‐week study diets (n=45). Change scores were calculated by subtracting the values following the run‐in diet from values following each study diet and were compared using the MIXED procedure (SAS v9.4; SAS Institute). There was a significant reduction in TC, LDL‐C, non–HDL‐C, and HDL‐C after all diets compared with baseline. *P<0.05 for the within‐diet change from baseline. LDL‐C indicates low‐density lipoprotein cholesterol; non–HDL‐C, non–high‐density lipoprotein cholesterol; TC, total cholesterol; TG, triglycerides.
Glucose, Insulin, CRP, and Weight
There were no significant changes in glucose or insulin from baseline or between diets for any of the 3 study diets. CRP was decreased from baseline (−0.95±0.5 mg/L, P=0.049) following the WFMD, but there were no significant differences between study diets as end‐of‐treatment means or magnitudes of change (Table 5, Table S4). Weight was decreased from baseline following the WD (−1.2±0.4 kg, P=0.003), the WFMD (−0.8±0.4 kg, P=0.04), and the ORAD (−1.1±0.4 kg, P=0.005), but there were no significant differences between study diets as end‐of‐treatment means (P=0.37) or magnitudes of change (P=0.33).
Exploratory BMI Subgroup Analysis of Response to Study Diets
There was an interaction between BMI category and cSBP (P=0.04) but no overall diet effect. Individuals with obesity (BMI 30 to <35; n=11) had a significant reduction in cSBP following the WD (−6±2 mm Hg; P=0.001) and the WFMD (−5±2 mm Hg; P=0.01) compared with baseline (Table 6). Furthermore, individuals with obesity had a greater response to the WD compared with individuals with morbid obesity (35 to <40; −6±2 versus 3±2; P=0.04; n=10). There were no differences in the effect on cSBP between individuals in the overweight (<30; n=24) or morbidly obese categories. Similarly, there was an interaction between BMI category and cMAP (P=0.01) but no overall diet effect. Individuals with obesity had a reduction in cMAP following the WD (−6±1 mm Hg; P<0.0001) and the WFMD (−3±1 mm Hg; P=0.04) compared with baseline, and individuals with obesity had a greater reduction in cMAP following the WD compared with individuals with morbid obesity (3±2; P=0.002). There were no differences in the effect on cMAP between the overweight or morbidly obese groups. No significant BMI subgroup differences were observed for any other outcome measures.
Table 6.
Comparisons Between Diets by BMI Classifications for cSBP and cMAP‡
| cSBP | cMAP | ||||
|---|---|---|---|---|---|
| Overweight | Obese | Morbidly Obese | Overweight | Obese | Morbidly Obese |
| WD | |||||
| −0.1±1ab | −6±2† a | 3±2b | −0.8±1ab | −6±2† a | 3±2b |
| WFMD | |||||
| −0.01±1 | −5±2† | 3±2 | −0.3±1 | −4±2† | 3±2 |
| ORAD | |||||
| −0.5±1 | −3±1.9 | 1±2 | −0.4±1 | −2±2 | 1±2 |
Data presented as least squared mean±SEM. BMI indicates body mass index; cMAP, central mean arterial pressure; cSBP, central systolic blood pressure; ORAD, oleic acid–replaces–α‐linolenic acid diet; WD, walnut diet; WFMD, walnut fatty acid–matched diet.
*The MIXED procedure was used to determine the effect of the interaction between diet and BMI classification on the change from baseline in cSBP and cMAP (SAS v9.4; SAS Institute). Post hoc tests were adjusted for multiple comparisons using the Tukey–Kramer method; statistically significant between‐BMI class differences are denoted with differing letters and †Significant from baseline (P<0.05).
‡There were significant DietxBMI Classficiation P‐values for cSBP (P=0.04) and cMAP (P=0.01).
Discussion
This study aimed to examine whether there were cardiovascular benefits of replacing SFA with walnuts beyond their fatty acid composition. Incorporation of 57–99 g/d (ie, 18% of energy) of walnuts as a snack into a healthy dietary pattern significantly lowered cDBP from baseline and to a significantly greater extent than the ORAD. However, there was no effect on cSBP, our primary end point. All 3 study diets improved lipids/lipoproteins including TC, LDL‐C, and non–HDL‐C to a similar extent. Consequently, in this study, favorable effects were observed for all 3 study diets, supporting the cardiovascular benefits of replacing SFA with unsaturated fats, which is consistent with the current evidence base.
To our knowledge, this study is the first to report that walnut intake reduced cDBP. The clinical implications of reducing cDBP are not completely understood, as this BP measurement is relatively novel and the prognostic value has not been assessed. However, bDBP, a target of the current BP guidelines,3 was nominally reduced (P=0.051) and mirrored the trends in cDBP. Our findings corroborate 2 previous studies that reported a reduction in bDBP with walnut consumption.18, 30 Although a recent meta‐analysis on walnuts and CVD risk factors did not report a significant effect of walnut consumption on BP, less than a third of the studies included reported results for brachial BP. The authors are only aware of 1 other study that has evaluated the effects of walnuts on central BP. In that study,31 there was no significant change in brachial or central BP in healthy male participants after 4 weeks of consuming 15 g/d walnuts under free‐living conditions.31 The dose of walnuts provided was substantially less than the 57 to 99 g/d we provided in our 6‐week controlled feeding study. Thus, dose, duration of walnut supplementation, and/or the participants studied (healthy versus metabolic dysfunction) may explain the discordance.
The significantly greater reduction in cDBP following the WD compared with the ORAD diet may have been due to the difference in fatty acid composition of the ORAD (lower PUFA and higher MUFA) versus WD, although no difference was detected between the WFMD and the ORAD, suggesting the fatty acid profile may not explain the full effect observed. The ORAD was also devoid of walnut bioactives. Thus, the effect of the WD on cDBP appears to be due to both the unique fatty acid profile and the bioactive profile of walnuts (eg, phenolic compounds). This result is consistent with evidence showing that PUFA is more effective than MUFA for lowering CVD risk, and clinical trials demonstrate that replacement of SFA with oleic acid lowers risk to a lesser extent.3, 14 This finding is of relevance because high‐oleic oils are being introduced into the food supply as a replacement for PUFA‐rich oils, and concerns have been raised that an adequate intake of linoleic acid and ALA will be difficult to obtain.32 Based on our results, providing walnuts is a strategy for obtaining not only essential fatty acids, which may become less abundant in the food supply with the growing number of high oleic (and lower ALA) fats and oils in the marketplace,32 but also walnut bioactives that may contribute to BP benefits. Walnuts are one of the richest plant sources of ALA33 and contain phenolic acids, stillbenes, tocopherols, flavonoids, and melatonin.34, 35, 36 These bioactives present in walnuts have in vitro antioxidant activity and have been reported to reduce oxidative damage and endothelial dysfunction.18, 37 Although we did not see an effect on arterial stiffness, we did observe reductions in cDBP and central and brachial MAP following the WD that may be due to different bioactive mechanisms including angiotensin‐converting enzyme inhibition, antioxidant, or other vasodilatory effects.38, 39
Recent evidence has demonstrated that the potential beneficial effects of walnut bioactives on BP may be related to changes in the gut microbiome.40, 41 The composition and diversity of the gut microbiome has been associated with various chronic diseases, including CVD.42, 43 Walnuts are not completely digested in the upper gastrointestinal tract, which provides substrate to the gut microbiota44, 45 and may promote the production of short‐chain fatty acids.40 Short‐chain fatty acids such as butyrate have been associated with maintenance of normal BP.46 Specific types of bacteria, such as Akkermansia munciniphila, have been reported to increase with butyrate supplementation47 and are associated with decreases in TNF‐α (tumor necrosis factor α) mRNA, systemic inflammation, and DBP. Microbial production of butyrate through fermentation in the gut also may elicit the beneficial effects observed with butyrate supplementation and, consequently, may have a BP‐lowering effect. However, further research is needed to investigate the interaction among walnut consumption, the gut microbiome, and BP.
There is extensive research on the effects of walnut consumption on lipids and lipoproteins. A recent meta‐analysis of 26 studies investigating the effects of walnut consumption on cardiovascular risk found a significant reduction in TC (3.25% greater reduction compared with controls), LDL‐C (3.73%), triglycerides (5.25%), and apolipoprotein B (−3.74 mg/dL compared with control Western diets) following walnut consumption (15–108 g/d for 4 weeks to 1 year).21 This result is consistent with our finding of significant reductions in TC, LDL‐C, non–HDL‐C, HDL‐C, and TC:HDL‐C following the WD versus the standard Western run‐in diet. The similarity in PUFA content of the 3 diets (16%, 16%, and 14% in WD, WMFA, and ORAD, respectively) may explain why we did not observe a significantly greater effect of the WD compared with the other 2 study diets, which also produced significant beneficial effects on TC, LDL‐C, non–HDL‐C, HDL‐C, and TC:HDL‐C compared with baseline. However, when we compared the observed lipid changes in the current study with the predicted changes calculated using the Mensink and Katan equation,48 we observed greater reductions in TC (observed versus expected: −15.8 versus −13.5 mg/dL) and LDL‐C (−13.4 versus −11.6 mg/dL) following the WD, whereas the observed reductions following the WFMD were closer to the predicted changes for TC (−14.6 versus −13.5 mg/dL) and LDL‐C (−11.1 versus −11.6 mg/dL). Differences in predicted versus observed LDL‐C–lowering effects are similar to other study findings reported for tree nuts49 and, specifically, walnuts.20, 50 This suggests there may be an additive effect of consuming whole walnuts as an SFA replacement versus vegetable oils that provide the same fatty acid profile.
Obesity and hypertension are interrelated and can influence the response to both diet and drug treatments.51, 52, 53 Adipocytes from visceral fat secrete inflammatory markers and angiotensinogen, an activator of the renin–angiotensin–aldosterone system, which may result in hypertension.54 Metabolic changes that occur due to the expansion of adipose tissue may affect the potency of dietary interventions; thus, the wide range in baseline BMI in the present study (BMI 25–38) may explain the lack of effect on cSBP and cMAP following the study diets. Although there was not a diet effect for our primary end point, cSBP, secondary analyses indicated that BMI played a role in participants’ systolic BP response to the study diets. We expected to see the greatest improvement in central BP in either the overweight group (n=24), for which obesity would not blunt the effects of the intervention, or in the obese (n=11) and morbidly obese (n=10) categories, with the highest baseline cSBP (overweight: 108.9±2.2 mm Hg; obesity: 113.8±2.2 mm Hg; morbid obesity: 113.8±2.5 mm Hg). However, we found that only individuals with obesity (BMI 30.0 to <35) had a significant reduction in cSBP and cMAP from baseline following the WD and the WFMD, with no significant change from baseline in the overweight or morbidly obese groups. Importantly, there were no significant differences in weight change between groups (P=0.20) that could account for this. Furthermore, we observed greater reduction in cSBP and cMAP in individuals with obesity compared with morbid obesity following the WD. This suggests that changes in central BP following the substitution of SFA with PUFA may be related to the degree of metabolic abnormalities associated with overweight and obesity. Relative to the obese group, individuals in the overweight group may have fewer metabolic disturbances and individuals in the morbidly obese group may have greater metabolic disturbances that possibly blunted the response to dietary treatment. Given the rising rates of obesity in the United States and worldwide, further research investigating the role of BMI in the response to dietary changes is warranted.
A strength of this study was the use of a crossover design that allowed participants to act as their own controls and minimized the influence of between‐subject variability on treatment effects. This study represents a realistic food‐based approach to replacing SFA and demonstrates that relatively small dietary changes can reduce cardiovascular risk. The context of the background diets is important for the incorporation of walnuts and addition of walnuts to a Western‐style diet would not result in the same cardiovascular benefits. In addition, the controlled‐feeding study design with high rates of compliance, as assessed via daily questionnaire and weight status, were additional strengths. The 6‐week feeding periods also provided a better understanding of the longer term effects of different treatment diets compared with a standard Western diet. However, the effect size was overestimated (0.6) for the primary end point, and thus the study was underpowered to detect between‐treatment effects. To detect the observed effect size (0.14), ≈516 participants would have been required. Although the run‐in diet was designed as a Western‐style diet with an SFA content representing average American consumption, this diet likely differed from participants’ habitual diets, particularly in SFA. This may explain the improvement we observed in LDL‐C (−6.1±2.2 mg/dL; P=0.009) from the time participants were screened to when they were randomized (baseline), although regression to the mean is also likely. It is possible the LDL‐C lowering from the run‐in diets blunted the effect of the study diets.
In summary, our findings demonstrate that replacement of SFA with PUFA from walnuts and vegetable oils and MUFA from vegetable oils significantly reduces established cardiovascular risk factors, including TC, LDL‐C, and non‐HDL‐C. This study also provides evidence that walnuts decrease cDBP. The results show that relatively small shifts from a Western‐style diet to dietary patterns with a favorable fatty acid profile, achieved using different food‐based approaches, confers cardiovascular benefits.
Sources of Funding
This study was funded by the California Walnut Commission. This research was also supported by the Pennsylvania State University Clinical and Translational Research Institute, Pennsylvania State University Clinical and Translational Science Award, and National Institutes of Health/National Center for Advancing Translational Sciences (grant no. UL1TR000127).
Disclosures
Kris‐Etherton serves as a consultant for Seafood Nutrition Partnership, Avocado Nutrition Science Advisors, and HUMANn. The California Walnut Commission provided funds for the research conducted. The commission's staff was not involved with any aspects of conducting the study, analyzing the data, or interpreting the results reported in this article. The remaining authors have no disclosures to report.
Supporting information
Table S1. Average Study Compliance for Each Participant, Including Participants Who Did Not Complete the Entire Study
Table S2. Baseline Characteristics of Participants Who Did Not Complete (n=9) the Study Compared With Those Who Completed the Study (n=36)*
Table S3. Mean Change From Baseline for Vascular Outcomes*
Table S4. Mean Change From Baseline for Lipids, Lipoproteins, C‐Reactive Protein, Glucose, Insulin, and Weight*
Acknowledgments
The authors sincerely thank Michael Russell, who provided excellent assistance in the statistical analyses, and research staff nurses Tracey Allen, Cyndi Flanagan, and Christa Oelhaf for their assistance. The authors’ responsibilities were as follows: A.C.S.‐R., D.N.P., and P.M.K.‐E. designed the study; A.M.T. and C.K.R. collected the data; A.M.T. and K.S.P. performed the statistical analyses; A.M.T., K.S.P., and P.M.K.‐E. wrote the article; A.C.S.‐R., D.N.P., and C.K.R. reviewed the article. All authors have reviewed and approved this article.
(J Am Heart Assoc. 2019;8:e011512 DOI: 10.1161/JAHA.118.011512.)
References
- 1. Blood Pressure Lowering Treatment Trialists’ Collaboration BPLTT , Ninomiya T, Perkovic V, Turnbull F, Neal B, Barzi F, Cass A, Baigent C, Chalmers J, Li N, Woodward M, MacMahon S. Blood pressure lowering and major cardiovascular events in people with and without chronic kidney disease: meta‐analysis of randomised controlled trials. BMJ. 2013;347:f5680. [DOI] [PMC free article] [PubMed] [Google Scholar]
- 2. Benjamin EJ, Virani SS, Callaway CW, Chamberlain AM, Chang AR, Cheng S, Chiuve SE, Cushman M, Delling FN, Deo R, de Ferranti SD, Ferguson JF, Fornage M, Gillespie C, Isasi CR, Jiménez MC, Jordan LC, Judd SE, Lackland D, Lichtman JH, Lisabeth L, Liu S, Longenecker CT, Lutsey PL, Mackey JS, Matchar DB, Matsushita K, Mussolino ME, Nasir K, O'Flaherty M, Palaniappan LP, Pandey A, Pandey DK, Reeves MJ, Ritchey MD, Rodriguez CJ, Roth GA, Rosamond WD, Sampson UKA, Satou GM, Shah SH, Spartano NL, Tirschwell DL, Tsao CW, Voeks JH, Willey JZ, Wilkins JT, Wu JH, Alger HM, Wong SS, Muntner P; American Heart Association Council on Epidemiology and Prevention Statistics Committee and Stroke Statistics Subcommittee . Heart disease and stroke statistics‐2018 update: a report from the American Heart Association. Circulation. 2018;137:e67–e492. [DOI] [PubMed] [Google Scholar]
- 3. Whelton PK, Carey RM, Aronow WS, Casey DE, Collins KJ, Dennison Himmelfarb C, DePalma SM, Gidding S, Jamerson KA, Jones DW, MacLaughlin EJ, Muntner P, Ovbiagele B, Smith SC, Spencer CC, Stafford RS, Taler SJ, Thomas RJ, Williams KA, Williamson JD, Wright JT. 2017 ACC/AHA/AAPA/ABC/ACPM/AGS/APhA/ASH/ASPC/NMA/PCNA guideline for the prevention, detection, evaluation, and management of high blood pressure in adults: a report of the American College of Cardiology/American Heart Association Task Force on Clinical Practice Guidelines. J Am Coll Cardiol. 2018;71:e127–e248. [DOI] [PubMed] [Google Scholar]
- 4. Huang Y, Cai X, Li Y, Su L, Mai W, Wang S, Hu Y, Wu Y, Xu D. Prehypertension and the risk of stroke: a meta‐analysis. Neurology. 2014;82:1153–1161. [DOI] [PubMed] [Google Scholar]
- 5. Roman MJ, Devereux RB, Kizer JR, Lee ET, Galloway JM, Ali T, Umans JG, Howard BV. Central pressure more strongly relates to vascular disease and outcome than does brachial pressure: the Strong Heart Study. Hypertension. 2007;50:197–203. [DOI] [PubMed] [Google Scholar]
- 6. Kollias A, Lagou S, Zeniodi ME, Boubouchairopoulou N, Stergiou GS. Association of central versus brachial blood pressure with target‐organ damage: systematic review and meta‐analysis. Hypertension. 2016;67:183–190. [DOI] [PubMed] [Google Scholar]
- 7. Orsavova J, Misurcova L, Ambrozova JV, Vicha R, Mlcek J. Fatty acids composition of vegetable oils and its contribution to dietary energy intake and dependence of cardiovascular mortality on dietary intake of fatty acids. Int J Mol Sci. 2015;16:12871–12890. [DOI] [PMC free article] [PubMed] [Google Scholar]
- 8. Souza RGM, Gomes AC, Naves MMV, Mota JF. Nuts and legume seeds for cardiovascular risk reduction: scientific evidence and mechanisms of action. Nutr Rev. 2015;73:335–347. [DOI] [PubMed] [Google Scholar]
- 9. Tsukamoto I, Sugawara S. Low levels of linoleic acid and α‐linolenic acid and high levels of arachidonic acid in plasma phospholipids are associated with hypertension. Biomed Rep. 2018;8:69–76. [DOI] [PMC free article] [PubMed] [Google Scholar]
- 10. Bemelmans WJ, Muskiet FA, Feskens EJ, de Vries JH, Broer J, May JF, Jong BM. Associations of alpha‐linolenic acid and linoleic acid with risk factors for coronary heart disease. Eur J Clin Nutr. 2000;54:865–871. [DOI] [PubMed] [Google Scholar]
- 11. Paschos GK, Magkos F, Panagiotakos DB, Votteas V, Zampelas A. Dietary supplementation with flaxseed oil lowers blood pressure in dyslipidaemic patients. Eur J Clin Nutr. 2007;61:1201–1206. [DOI] [PubMed] [Google Scholar]
- 12. Ueshima H, Stamler J, Elliott P, Chan Q, Brown IJ, Carnethon MR, Daviglus ML, He K, Moag‐Stahlberg A, Rodriguez BL, Steffen LM, Van Horn L, Yarnell J, Zhou B. Food omega‐3 fatty acid intake of individuals (total, linolenic acid, long‐chain) and their blood pressure: INTERMAP study. Hypertension. 2007;50:313–319. [DOI] [PMC free article] [PubMed] [Google Scholar]
- 13. Jacobson TA, Maki KC, Orringer CE, Jones PH, Kris‐Etherton P, Sikand G, La Forgef R, Daniels SR, Wilson DP, Morris PB, Wild RA, Grundy SM, Daviglus M, Ferdinand KC, Vijayaraghavan K, Deedwania PC, Aberg JA, Liao KP, McKenney JM, Ross JL, Braun LT, Ito MK, Bays HE, Brown WV. National Lipid Association recommendations for patient‐centered management of dyslipidemia: part 2. J Clin Lipidol. 2015;9:S1–S122.e1. [DOI] [PubMed] [Google Scholar]
- 14. Miller M, Sorkin JD, Mastella L, Sutherland A, Rhyne J, Donnelly P, Simpson K, Goldberg AP. Poly is more effective than monounsaturated fat for dietary management in the metabolic syndrome: the Muffin study. J Clin Lipidol. 2016;10:996–1003. [DOI] [PMC free article] [PubMed] [Google Scholar]
- 15. US Department of Agriculture and US Department of Health and Human Services . 2015‐2020 Dietary Guidelines for Americans. 8th Edition. Available at: https://health.gov/dietaryguidelines/2015/guidelines/table-of-contents/. Accessed May 9, 2017.
- 16. Lichtenstein AH, Appel LJ, Brands M, Carnethon M, Daniels S, Franch HA, Franklin B, Kris‐Etherton P, Harris WS, Howard B, Karanja N, Lefevre M, Rudel L, Sacks F, Van Horn L, Winston M, Wylie‐Rosett J. Diet and lifestyle recommendations revision 2006. Circulation. 2006;114:82–96. [DOI] [PubMed] [Google Scholar]
- 17. Katz DL, Davidhi A, Ma Y, Kavak Y, Bifulco L, Njike VY. Effects of walnuts on endothelial function in overweight adults with visceral obesity: a randomized, controlled, crossover trial. J Am Coll Nutr. 2012;31:415–423. [DOI] [PMC free article] [PubMed] [Google Scholar]
- 18. West SG, Krick AL, Klein LC, Zhao G, Wojtowicz TF, McGuiness M, Bagshaw DM, Wagner P, Ceballos RM, Holub BJ, Kris‐Etherton PM. Effects of diets high in walnuts and flax oil on hemodynamic responses to stress and vascular endothelial function. J Am Coll Nutr. 2010;29:595–603. [DOI] [PMC free article] [PubMed] [Google Scholar]
- 19. Banel DK, Hu FB. Effects of walnut consumption on blood lipids and other cardiovascular risk factors: a meta‐analysis and systematic review. Am J Clin Nutr. 2009;90:56–63. [DOI] [PMC free article] [PubMed] [Google Scholar]
- 20. Sabate J, Fraser GE, Burke K, Knutsen SF, Bennett H, Lindsted KD. Effects of walnuts on serum lipid levels and blood pressure in normal men. N Engl J Med. 1993;328:603–607. [DOI] [PubMed] [Google Scholar]
- 21. Guasch‐Ferré M, Li J, Hu FB, Salas‐Salvadó J, Tobias DK. Effects of walnut consumption on blood lipids and other cardiovascular risk factors: an updated meta‐analysis and systematic review of controlled trials. Am J Clin Nutr. 2018;108:174–187. [DOI] [PMC free article] [PubMed] [Google Scholar]
- 22. National Cholesterol Education Program (NCEP) Expert Panel on Detection, Evaluation, and Treatment of High Blood Cholesterol in Adults (Adult Treatment Panel III) . Third Report of the National Cholesterol Education Program (NCEP) Expert Panel on Detection, Evaluation, and Treatment of High Blood Cholesterol in Adults (Adult Treatment Panel III) final report. Circulation. 2002;106:3143–3421. [PubMed] [Google Scholar]
- 23. Harris JA, Benedict FG. A biometric study of human basal metabolism. Proc Natl Acad Sci USA. 1918;4:370–373. [DOI] [PMC free article] [PubMed] [Google Scholar]
- 24. U.S. Department of Agriculture, Agricultural Research Service . 2018. Nutrient Intakes from Food and Beverages: Mean Amounts Consumed per Individual, by Gender and Age, What We Eat in America. NHANES 2015–2016.
- 25. Shoji T, Nakagomi A, Okada S, Ohno Y, Kobayashi Y. Invasive validation of a novel brachial cuff‐based oscillometric device (SphygmoCor XCEL) for measuring central blood pressure. J Hypertens. 2017;35:69–75. [DOI] [PubMed] [Google Scholar]
- 26. Ding F‐H, Fan W‐X, Zhang R‐Y, Zhang Q, Li Y, Wang J‐G. Validation of the noninvasive assessment of central blood pressure by the SphygmoCor and Omron devices against the invasive catheter measurement. Am J Hypertens. 2011;24:1306–1311. [DOI] [PubMed] [Google Scholar]
- 27. Seventh Report of the Joint National Committee on the Prevention, Detection, Evaluation, and Treatment of High Blood Pressure. 2003. [DOI] [PubMed]
- 28. Laurent S, Cockcroft J, Van Bortel L, Boutouyrie P, Giannattasio C, Hayoz D, Pannier B, Vlachopoulos C, Wilkinson I, Struijker‐Boudier H. Expert consensus document on arterial stiffness: methodological issues and clinical applications. Eur Heart J. 2006;27:2588–2605. [DOI] [PubMed] [Google Scholar]
- 29. Friedewald WT, Levy RI, Fredrickson DS. Estimation of the concentration of low‐density lipoproteincholesterol in plasma, without use of the preparative ultracentrifuge. Clin Chem. 1972;18:499. [PubMed] [Google Scholar]
- 30. Wu H, Pan A, Yu Z, Qi Q, Lu L, Zhang G, Yu D, Zong G, Zhou Y, Chen X, Tang L, Feng Y, Zhou H, Chen X, Li H, Demark‐Wahnefried W, Hu FB, Lin X. Lifestyle counseling and supplementation with flaxseed or walnuts influence the management of metabolic syndrome. J Nutr. 2010;140:1937–1942. [DOI] [PMC free article] [PubMed] [Google Scholar]
- 31. Din JN, Aftab SM, Jubb AW, Carnegy FH, Lyall K, Sarma J, Newby DE, Flapan AD. Effect of moderate walnut consumption on lipid profile, arterial stiffness and platelet activation in humans. Eur J Clin Nutr. 2011;65:234–239. [DOI] [PMC free article] [PubMed] [Google Scholar]
- 32. Raatz SK, Conrad Z, Jahns L, Belury MA, Picklo MJ. Modeled replacement of traditional soybean and canola oil with high‐oleic varieties increases monounsaturated fatty acid and reduces both saturated fatty acid and polyunsaturated fatty acid intake in the US adult population. Am J Clin Nutr. 2018;108:594–602. [DOI] [PubMed] [Google Scholar]
- 33. United States Department of Agriculture . Basic Report: 12155, Nuts, walnuts, English. National Nutrient Database for Standard Reference Release 28. Available at https://ndb.nal.usda.gov/ndb/foods/show/3690. Accessed July 20, 2017.
- 34. Hayes D, Angove MJ, Tucci J, Dennis C. Walnuts (Juglans regia) chemical composition and research in human health. Crit Rev Food Sci Nutr. 2016;56:1231–1241. [DOI] [PubMed] [Google Scholar]
- 35. Bolling BW, Chen C‐YO, Mckay DL, Blumberg JB. Tree nut phytochemicals: composition, antioxidant capacity, bioactivity, impact factors. A systematic review of almonds, Brazils, cashews, hazelnuts, macadamias, pecans, pine nuts, pistachios and walnuts. Nutr Res Rev. 2011;24:244–275. [DOI] [PubMed] [Google Scholar]
- 36. Reiter RJ, Manchester LC, Tan D‐X. Melatonin in walnuts: influence on levels of melatonin and total antioxidant capacity of blood. Nutr J. 2005;21:920–924. [DOI] [PubMed] [Google Scholar]
- 37. Alasalvar C, Bolling BW. Review of nut phytochemicals, fat‐soluble bioactives, antioxidant components and health effects. Br J Nutr. 2015;113(suppl 2):S68–S78. [DOI] [PubMed] [Google Scholar]
- 38. Huang W‐Y, Davidge ST, Wu J. Bioactive natural constituents from food sources‐potential use in hypertension prevention and treatment. Crit Rev Food Sci Nutr. 2013;53:615–630. [DOI] [PubMed] [Google Scholar]
- 39. Caligiuri SPB, Rodriguez‐Leyva D, Aukema HM, Ravandi A, Weighell W, Guzman R, Pierce GN. Dietary flaxseed reduces central aortic blood pressure without cardiac involvement but through changes in plasma oxylipins. Hypertension. 2016;68:1031–1038. [DOI] [PubMed] [Google Scholar]
- 40. Schlörmann W, Birringer M, Lochner A, Lorkowski S, Richter I, Rohrer C, Glei M. In vitro fermentation of nuts results in the formation of butyrate and c9, t11 conjugated linoleic acid as chemopreventive metabolites. Eur J Nutr. 2016;55:2063–2073. [DOI] [PubMed] [Google Scholar]
- 41. Bamberger C, Rossmeier A, Lechner K, Wu L, Waldmann E, Fischer S, Stark RG, Altenhofer J, Henze K, Parhofer KG. A walnut‐enriched diet affects gut microbiome in healthy caucasian subjects: a randomized, controlled trial. Nutrients. 2018;10:244. [DOI] [PMC free article] [PubMed] [Google Scholar]
- 42. Wang J‐Z, Du W‐T, Xu Y‐L, Cheng S‐Z, Liu Z‐J. Gut microbiome‐based medical methodologies for early‐stage disease prevention. Microb Pathog. 2017;105:122–130. [DOI] [PubMed] [Google Scholar]
- 43. Yan Q, Gu Y, Li X, Yang W, Jia L, Chen C, Han X, Huang Y, Zhao L, Li P, Fang Z, Zhou J, Guan X, Ding Y, Wang S, Khan M, Xin Y, Li S, Ma Y. Alterations of the gut microbiome in hypertension. Front Cell Infect Microbiol. 2017;7:381. [DOI] [PMC free article] [PubMed] [Google Scholar]
- 44. Baer DJ, Gebauer SK, Novotny JA. Walnuts consumed by healthy adults provide less available energy than predicted by the Atwater factors. J Nutr. 2016;146:9–13. [DOI] [PubMed] [Google Scholar]
- 45. Holscher H, Guetterman H, Swanson K, An R, Matthan N, Lichtenstein A, Novotny J, Baer D. Walnut consumption alters the gastrointestinal microbiota, microbial‐derived secondary bile acids, and health markers in healthy adults: a randomized controlled trial. J Nutr. 2018;148:1–7. [DOI] [PMC free article] [PubMed] [Google Scholar]
- 46. Gomez‐Arango LF, Barrett HL, McIntyre HD, Callaway LK, Morrison M, Dekker Nitert M. Increased systolic and diastolic blood pressure is associated with altered gut microbiota composition and butyrate production in early pregnancy. Hypertension. 2016;68:974–981. [DOI] [PubMed] [Google Scholar]
- 47. Roshanravan N, Mahdavi R, Alizadeh E, Ghavami A, Saadat YR, Alamdari NM, Alipour S, Dastouri MR, Ostadrahimi A. The effects of sodium butyrate and inulin supplementation on angiotensin signaling pathway via promotion of Akkermansia muciniphila abundance in type 2 diabetes; A randomized, double‐blind, placebo‐controlled trial. J Cardiovasc Thorac Res. 2017;9:183–190. [DOI] [PMC free article] [PubMed] [Google Scholar]
- 48. Katan MB, Tilburg TV, Luger M. Katan Calculator: Predicted effect of diet on blood lipids and lipoproteins. Available at: http://www.katancalculator.nl/. Accessed July 26, 2018.
- 49. Griel AE, Kris‐Etherton PM. Tree nuts and the lipid profile: a review of clinical studies. Br J Nutr. 2006;96(suppl 2):S68–S78. [DOI] [PubMed] [Google Scholar]
- 50. Ros E, Núñez I, Pérez‐Heras A, Serra M, Gilabert R, Casals E, Deulofeu R. A walnut diet improves endothelial function in hypercholesterolemic subjects. Circulation. 2004;109:1609–1614. [DOI] [PubMed] [Google Scholar]
- 51. Matone A, O'Grada CM, Dillon ET, Morris C, Ryan MF, Walsh M, Gibney ER, Brennan L, Gibney MJ, Morine MJ, Roche HM. Body mass index mediates inflammatory response to acute dietary challenges. Mol Nutr Food Res. 2015;59:2279–2292. [DOI] [PubMed] [Google Scholar]
- 52. Ottaviani S, Gardette A, Tubach F, Roy C, Palazzo E, Gill G, Meyer O, Dieudé P. Body mass index and response to infliximab in rheumatoid arthritis. Clin Exp Rheumatol.33:478–483. [PubMed] [Google Scholar]
- 53. Lee M‐R, Lim Y‐H, Hong Y‐C. Causal association of body mass index with hypertension using a Mendelian randomization design. Medicine. 2018;97:e11252. [DOI] [PMC free article] [PubMed] [Google Scholar]
- 54. Kotsis V, Nilsson P, Grassi G, Mancia G, Redon J, Luft F, Schmieder R, Engeli S, Stabouli S, Antza C, Pall D, Schlaich M, Jordan J, WG on Obesity, Diabetes, the High Risk Patient, European Society of Hypertension . New developments in the pathogenesis of obesity‐induced hypertension. J Hypertens. 2015;33:1499–1508. [DOI] [PubMed] [Google Scholar]
Associated Data
This section collects any data citations, data availability statements, or supplementary materials included in this article.
Supplementary Materials
Table S1. Average Study Compliance for Each Participant, Including Participants Who Did Not Complete the Entire Study
Table S2. Baseline Characteristics of Participants Who Did Not Complete (n=9) the Study Compared With Those Who Completed the Study (n=36)*
Table S3. Mean Change From Baseline for Vascular Outcomes*
Table S4. Mean Change From Baseline for Lipids, Lipoproteins, C‐Reactive Protein, Glucose, Insulin, and Weight*