

Abstract
Inhibitory immune-checkpoint receptors (ICRs), including programmed death 1 (PD-1), have been characterized as exhaustion markers on T cells that infiltrate the tumor micro-environment (TME) of many cancer types, including head and neck cancer (HNC). However, expression and function of ICRs, including PD-1, on natural killer (NK) cells remains less defined. NK cells are innate immune effector cells that lyse epidermal growth factor receptor–overexpressing HNC cells via cetuximab-mediated antibody-dependent cytotoxicity. Cetuximab is clinically effective but only in 10% to 15% of patients. Therefore, it is necessary to investigate how immunomodulation with cetuximab or PD-1 blockade might enhance NK cell responses in the TME and improve monoclonal antibody therapeutic efficacy. We observed that expression of PD-1 on NK cells marks an activated phenotype, which was suppressed only after binding programmed death ligand-1 (PD-L1). HNC patients who exhibit higher circulating PD-1+ NK cells associate with better clinical outcome, and these cells are enriched in the TME. Cetuximab-mediated NK cell activation increased PD-1 expression on NK cells in vitro, which was confirmed in vivo in a prospective neoadjuvant cetuximab trial. In contrast, PD-L1 ligation of PD-1+ NK cells diminished their activation status, whereas PD-1 blockade increased cetuximab-mediated NK cell activation and cytotoxicity, but only against HNC targets with high PD-L1 expression. Therefore, blocking the PD-1–PD-L1 axis may be a useful strategy to reverse immune evasion of HNC tumors with high PD-L1 expression during cetuximab therapy by reversing NK cell dysfunction.
Introduction
Inhibitory immune-checkpoint receptors (ICRs) such as PD-1, T-cell immunoglobulin and mucin-domain containing-3 (TIM-3), and cytotoxic T-lymphocyte-associated protein 4 (CTLA-4) have become important targets in cancer immunotherapy. PD-1 has been studied in several immune cell subsets, including CD8+ T cells, B cells, and dendritic cells (DCs), in the tumor microenvironment (TME; refs. 1, 2). PD-1 expression on T cells is coexpressed with activation markers such as Th1 transcription factors STAT1 and T-bet, and cytokines IFNγ and IL12 after CD3/CD28 stimulation (3). However, binding of PD-1 with its cognate ligands, programmed death ligand 1 and 2 (PD-L1 and PD-L2), mediates T-cell exhaustion and immuno-escape (4–7). In the setting of head and neck cancer (HNC), we previously documented that the majority of tumors express PD-L1 (8) and harbor a high frequency of PD-1+ T cells (9–12). Blocking the PD-1–PD-L1 axis has shown encouraging results in the treatment of several cancers, including melanoma, lung cancer, and HNC (13, 14), and PD-1 expression has been characterized in tumor-infiltrating T cells. However, less is known about PD-1 expression and function on NK cells, despite their importance in bridging innate and adaptive immunity and mediating monoclonal antibody (mAb)–specific antitumor responses (15).
NK cells play a crucial role in tumor immunosurveillance, with a capacity of killing cancer cells without prior sensitization. NK cell dysfunction has been associated with increased risk of leukemia, gastric cancers, and HNC (16–19) and poor clinical prognosis (20–22). Therefore, reversing NK cell dysfunction should improve cancer immunotherapy. NK cells mediate cytotoxicity via CD16-mediated antibody-dependent cellular cytotoxicity (ADCC), particularly in the setting of HNC, where the majority of tumors overexpress EGFR (15). In this setting, NK cells bind the Fc portion of cetuximab, an EGFR-specific IgG1 mAb, lyse tumor targets, and secrete Th1 cytokines. These effects activate DCs and promote cross-presentation of tumor antigen (TA)–specific cytotoxic T lymphocytes (CTLs; refs. 15, 23). However, the benefit of cetuximab-mediated immunotherapy is seen only in 10% to 20% of patients (23–25). One explanation may be PD-L1–mediated suppression of tumor-infiltrating PD-1+ NK cells.
Circulating and tumor-infiltrating PD-1+ NK cells are found in higher frequency in sarcoma, multiple myeloma, and ovarian cancer patients, and PD-1 blockade reversed their dysfunctional phenotype (26–28). However, whether PD-1 expression on NK cells represents a dysfunctional subset in HNC patients is still unclear. Therefore, we investigated circulating and tumor-infiltrating PD-1+ NK cells in HNC patients and also determined the expression and correlation of the NK cell marker NKp46 (NCR1), as well as PD-1, TIM-3, and CTLA-4, in tumors and paired control tissues from a large cohort of HNC specimens in The Cancer Genome Atlas (TCGA). We tested whether cetuximab-mediated NK cell activation would further increase PD-1 in vitro and in vivo, testing specimens from a neoadjuvant single-agent cetuximab clinical trial. We propose that activated PD-1+ NK cells might become dysfunctional only after PD-L1 ligation. Taken together, our findings support the use of combinational anti-EGFR and anti–PD-1 therapy in the clinic to enhance NK cell–mediated cytotoxicity.
Materials and Methods
Patients and specimens
All patients included in this report (n = 74) gave written informed consent, as approved by the institutional review board (IRB #99–06). Peripheral blood samples were obtained from nontrial HNC patients or stage III/IVA trial patients receiving neoadjuvant cetuximab (400 mg/m2/day on day 1, then 250 mg/m2/day on days 8–15) on a prospective phase II clinical trial (UPCI 08–013, NCT 01218048) conducted in accordance with the ethical standards of the Declaration of Helsinki. Tumors were biopsied before and after 4 weeks of cetuximab therapy. Clinical response was analyzed by comparing paired CT scans of tumors pre/post-cetuximab and quantifying tumor measurement by a head and neck radiologist blinded to patient status. Anatomic tumor measurements were recorded in two dimensions, and the cohort segregated into clinical “responders,” who showed a reduction of 10% to 30% in tumorvolume, “partial responders” whose tumors showed a reduction of less than 10% of volume and “nonresponders,” whose tumors grew during this therapy. Tumor biopsies (pretreatment) or surgical tumor specimens (posttreatment) were preserved for a maximum of 12 hours in complete media until tumor-infiltrating lymphocytes were isolated and cryopreserved until analysis.
Tumor-infiltrating lymphocyte (TIL) isolation
Fresh tumors from HNC patients were minced into small pieces manually or using a gentleMACS dissociator using the preloaded program h_tumor_03.01 (Miltenyi Biotec) with no enzymatic solution added, then transferred to 70-μm cell strainers (BD) and mechanically separated using the plunger of a 5-mL syringe. The cells passing through the cell strainer were collected and washed twice with RPMI media (Sigma-Aldrich) plus 10% fetal bovine serum (Corning). After centrifugation, mononuclear cells were recovered and used immediately or cryopreserved in the case of peripheral blood lymphocytes (PBLs) from active disease patients or PBL and TIL samples from the UPCI clinical trial #08–013 and thawed immediately before phenotyping experiments.
Peripheral blood mononuclear cells (PBMC) and NK isolation from healthy donors and HNC patients
Blood from healthy donors (Central Blood Bank), patients with active HNC, or from the UPCI clinical trial #08–013 NCT#01218048 was withdrawn, and PBMCs were purified by Ficoll-Paque PLUS centrifugation following a standard protocol (Amersham Biosciences). PBMCs from healthy donors used in all in vitro experiments in this report were used fresh after isolation, and NK cells were purified using a NK cell–negative selection magnetic EasySep kit (catalog# 19051) following the manufacturer’s protocol (Stem Cell Technologies). Purity of the selection was >95% CD3−CD56+ CD16+ as assessed by flow cytometry. PBMCs from active disease HNC patients with at least 3-year survival data available (n = 50) or UPCI clinical trial #08–013 were used from our cryopreserved inventory, thawed for 1 minute at 37° C, washed twice with warm FBS-enriched RPMI medium, and used for flow cytometry staining.
Coculture of NK cells using hIgG1 or PD-L1–coupled beads
PD-L1–hIgG1 Fc fusion protein (R&D Systems) or control human IgG1 (Southern Biotech) were covalently coupled to Dynabeads M-450 according to the manufacturer’s protocol (Life Technologies). We kept constant the total amount of protein at 5 mg per 107 beads as previously described (29). Briefly, 107 beads were coated with 50 μg/mL of either PD-L1–hIGg1 Fc fusion protein or control human IgG1. NK cells were freshly isolated from healthy donors’ PBMCs and subjected to coculture experiments. NK cells were cultured with beads at a fixed cell:bead ratio of 1:20 for 24 hours and analyzed by flow cytometry.
Tumor cell lines
JHU029 cells were a kind gift from Dr. James Rocco (Harvard Medical School, Boston, MA) in January 2006. 93-VU-147 T (called 93VU in this report) was a kind gift from Dr. Henning Bier (Technische Universitat Munchen, Munich, Germany) in October 2013. SCC90 cells were isolated from patients treated at the University of Pittsburgh through the explant/culture method, authenticated, and validated using short-tandem repeat profiling and HLA genotyping. All cell lines were routinely tested every 6 months and found to be free of Mycoplasma infection and were cultured in IMDM (Invitrogen) supplemented with 10% FBS (Mediatech), 2% L-glutamine, and 1% penicillin/streptomycin (Invitrogen Corp).
Antibodies and treatments
Mouse anti-human CD3-PerCPCy5.5 or AF700 (clone UCHT1), CD56-FITC (clone B159 or NCMA16.2), PD-1-APC (clone MIH4), PD-L1-PE (clone MIH1), CD16-PECy7 (clone 3G8), CD107a-PE (clone H4A3), GranzymeB-PE-TxRed or CF594 (clone GB11), IFNγ-APC-Cy7 (clone 4SB3), TIM-3-PE (clone F382E2), CTLA-4-PECy5 (clone BNI3), CD69- PerCpCy5.5, KIR-PE (clone DX27), CD69-PECy7 (clone FN50), CD96-APC (clone NK92.39), and NKp46-PE (clone 9E2) were purchased from BD Pharmingen. Zombie aqua viability dye was purchased from BioLegend. Human recombinant IL2 was purchased from R&D Systems reconstituted according the manufacturer’s instructions. For NK cell activation, rhIL2 was used at 130 IU/mL for 24 hours following a previously validated protocol (28). NKp46-Fc chimera and IgG1-Fc control were purchased from R&D Systems. Mouse anti-human anti-IFNγ blocking antibody was purchased from R&D Systems and used at 50 ng/mL. Cetuximab and nivolumab were kindly provided by Bristol-Meyers Squibb and used at 10 and 20 μg/mL, respectively. Panitumumab was kindly provided by Amgen and used at 10 μg/mL in all in vitro experiments.
Flow cytometry
Cells were harvested and resuspended in PBS containing a 1:50 dilution of viability dye Zombie Aqua (30) for 10 minutes at room temperature and washed following the manufacturer’s protocol (BioLegend). Cells were then resuspended in 50 μL of fluorescence-activated cell sorting (FACS) buffer (BD Bioscience), and fluorophore-conjugated antibodies were added at 1:25 dilution, incubated for 15 minutes at 4°C. Antibodies were washed away twice by sequential centrifugation at 1400 RPM with FACS buffer and acquired in a BD Fortessa flow cytometer using FACSDiva software. Analysis of flow cytometry files was performed using FlowJo v 10.7 software.
ELISA
Determination of IFNγ in cell culture supernatants was performed using the human IFNγ ELISA kit (catalog# DIF50; R&D Systems) and used according to the manufacturer’s protocol.
ADCC assay
Cytotoxicity was determined using a 51Cr release assay. Briefly, target cells were incubated in 100 μL of media with 25 μCi of Na2 51CrO4 (PerkinElmer) for 60 minutes at 37°C and resuspended in RPMI 1640 medium supplemented with 25 mmol/L HEPES. Cells were thoroughly washed and plated at 20:1 effector-to-target ratio in 96-well plates, and then treatments (mAbs, 10 μg/mL) and freshly purified NK cells were added. Plates were incubated for 4 hours at 37°C in a 5% CO2 atmosphere. Controls for spontaneous (cells only) and maximal lysis (cells treated with 1% Triton-X) were included. Each reaction was done in triplicate and repeated three times. The supernatants were collected and analyzed with a PerkinElmer 96-well plate gamma counter. Percent specific lysis = (experimental lysis – spontaneous lysis)/(experimental lysis — maximal lysis) × 100.
TCGA data retrieval and analysis
TCGA data for HNC gene expression by RNA-seq were downloaded from the c-Bio portal (http://www.cbioportal.org) or the UCSC cancer genomics browser (https://genome-cancer.ucsc.edu). The HNC gene-expression profile was measured experimentally using the Illumina HiSeq 2000 RNA-seq platform by the University of North Carolina TCGA genome characterization center. Data were downloaded from the TCGA data coordination center and showed the gene transcription estimates, as in RSEM normalized count, percentile ranked within each sample. Genes were mapped onto the human genome coordinates using UCSC cgData HUGO probeMap. The RSEM units to quantitate RNA-seq expression data were described and validated previously (31). Correlations and linear regression curve fits from TCGA data were calculated using GraphPad PRISM software version 6 and values were plotted into graphs.
IHC protocol
The University of Pittsburgh IRB #99–069 approved the use of clinical samples, and written informed consent was obtained. Slides were deparaffinized and rehydrated. Antigen retrieval was performed using Diva Retrieval (Biocare Medical) and a decloaking chamber at 124°C, 3 minutes, and cooled for 10 minutes. Slides were placed on an Autostainer Plus (Dako) using a TBST rinse buffer (Dako) and stained using 3% H2O2 (Thermo Fisher Scientific) for 5 minutes, CAS Block (Invitrogen) for 10 minutes, and the primary antibody for PD-L1 (6.2 μg/mL final concentration, clone 405.9A11, kindly provided by Gordon J. Freeman) was used as previously reported (32). The secondary consisted of Envision Dual Link + (Dako) polymer for 30 minutes, rinsed, then a TBST holding rinse was applied for 5 minutes. The substrate used was 3,3,-diaminobenzidine + (Dako) for 7 minutes and counterstained with hematoxylin. PD-L1 staining was quantified by positive pixel count v9 algorithm (Aperio). A head and neck pathologist blinded to clinical patient data examined tumor sections. Scoring was determined by the percentage of tumor stained for PD-L1. Tumors with <5% tumor cell-positive staining were considered negative.
RNA extraction and quality assessment
NK cell pellets ranging from 10 thousand to 1 million cells were preserved with TRIzol (Life Technologies) at —20 Celsius until RNA extraction. Briefly, each cell pellet was homogenized in 0.8 mL TRIzol by vortex. Following addition and vortexing with 160 μL chloroform, samples were centrifuged and aqueous phase transferred. RNA was precipitated from the aqueous phase by addition of equal volume of isopropanol and centrifuged for 15 minutes at maximum speed to pellet RNA. RNA pellet was washed with 1 mL 70% ethanol. Following air-drying of residual ethanol, pellets were resuspended in 15 to 20 μL RNase free water. The amount of water was based on observed pellet size. Purified RNA was quantified by Qubit (Life Technologies) and assessed for integrity on the Tape Station 4200 (Agilent).
Affymetrix WT-Pico and Clariom S human transcriptome assay
cDNA was prepared from the NK cell RNA using the IVT Pico reagent kit (Thermo Fisher) according to the manufacturer’s instructions. Using the reagents included in the Clariom S Pico assay kit (Thermo Fisher, catalog #902963), we performed reverse transcription using 2 ng total RNA for all samples having measurable concentrations. Following 3′ adapter synthesis, ds–cDNA was amplified. Input was normalized to 20 ng. A second RT reaction produced amplified dsDNA which was fragmented, end labeled with biotin, and hybridized to the Human Clariom S array (Thermo Fisher). Following hybridization (16 hours, 45°C, 60 RPM), arrays were processed on a GeneChip 450 Fluidics Station using manufacturer’s protocols. Briefly, removal of unbound sample was done with nonstringent wash Buffer A. The GeneChips were then stained in Cocktail 1. Buffer A was again used to wash off excess stain. Signal amplification was achieved with a 10-minute incubation with Stain Cocktail 2, followed by a second 10-minute incubation with Stain Cocktail 1. The chip was washed with high stringency Buffer B and filled with Array Holding Buffer before being removed from the fluidics station and scanned using the GeneArray 3000 scanner with the 7G upgrade. First-level data analysis was performed using Affymetrix Expression Console using RMA normalization algorithm.
Transcriptome expression analysis
Differential transcriptional profiles of PD-1– and PD-1+ TILNK cell subsets were analyzed using the Transcriptome Analysis Console (TAC) 4.0 as previously validated (33). First, quality control and data normalization was performed using exploratory grouping analysis (EGA), including principal component analysis, and t-distributed stochastic neighbor embedding (tSNE). The EGA standard parameters were variance filter number 20000, tSNE perplexity 5, clustering by affinity, 0.25, K-means random starts 5, and dbscan percentile of intersample distances for epsilon neighborhood 0.15. Differential expression analysis used the lmFit, contrasts.fit, duplicateCorrelation, ebayes, and topTable functions in the LIMMA Bioconductor package using the eBayes empirical parameter improvement (default settings).
Statistical analysis
Nonnormally distributed data were analyzed with nonparametric tests. For two groups of independent variables, the Mann–Whitney test was used. For three or more groups of independent variables, the Kruskal–Wallis test. For two groups of paired samples, the Wilcoxon test was used. For normally distributed data, parametric tests were used: for two groups of independent or paired variables, we used the Student t test. For three or more groups of independent variables, we used ANOVA. Kaplan–Meier survival curves were plotted and analyzed using log-rank test (Mantel–Cox). Correlations were analyzed using Person r coefficient test. For all statistical analyses, differences were considered statistically significant when P < 0.05.
Results
More PD-1+ NK cells in circulation and tumors of HNC patients associates with better outcome
Using PBLs isolated from new active disease HNC patients, we observed that circulating NK cells (live CD3–CD56+) were significantly more frequent in early-stage HNC patients [T1 (44%) N0 (77%; Table 1 and Fig. 1A, right, n = 9, black solid circles)] compared with patients with late-stage disease [T1 (24%) N0 (24%; Table 1 and Fig. 1A, n = 41, dark gray circles)] who had fewer circulating NK cells. Significantly higher frequencies of circulating PD-1+ (Fig. 1B) and TIM-3+ cells, but not CTLA-4+ NK cells (Supplementary Fig. S1A), were observed in HNC patients. Patients with a frequency of PD-1+ NK cells above the mean value (>9%) showed significantly better survival than those with PD-1+ NK cells below the mean (<9%; Fig. 1C). In order to investigate whether PD-1+, TIM-3+, and CTLA-4+ NK cells were enriched in the TME, we compared these subsets in PBLs and paired TILs from HNC patients. We found variable numbers of circulating PD-1+ NK cells, which were significantly enriched at the tumor site. In contrast, we did not find enrichment of TIM-3+ or CTLA-4+ NK cells in the TME of these patients (Fig. 1D; the gating strategy is shown in Supplementary Fig. S1B).
Table 1.
Clinical features of active disease HNC patients whose PBL specimens were included in Fig. 1A
| Patients with high percentage of NK cellsh |
Patients with low percentage of NK cells |
|
|---|---|---|
| Patients, n (%) | 9 (100) | 41 (100) |
| Gender, n (%) | ||
| Female | 1(12) | 12 (29) |
| Male | 8 (88) | 29 (71) |
| Age, years; median (range) | 67 (46–87) | 60 (33–85) |
| T/N stage, n (%) | ||
| T1 | 4 (44) | 10 (24) |
| T2 | 3 (33) | 7(17) |
| T3 | 1 (11) | 4(10) |
| T4 | 1 (11) | 10 (24) |
| TX | 0 (0) | 8 (20) |
| N0 | 7 (77) | 10 (24) |
| N1 | 0 (0) | 5 (17) |
| N2 | 1 (11) | 11 (27) |
| NX | 1 (11) | 13 (32) |
| Tumor site, n (%) | ||
| Oral cavity | 6 (66) | 33 (80) |
| Oropharynx | 0 (0) | 1 (1.5) |
| Hypopharynx | 0 (0) | 2 (5) |
| Larynx | 3 (33) | 5 (12) |
| Soft tissue | 0 (0) | 1 (1.5) |
| HPV status, n (%) | ||
| Positive | 0 (0) | 4(10) |
| Negative | 3 (33) | 16 (39) |
| Not evaluated | 6 (66) | 21 (51) |
NOTE: Patients with higher frequency of NK cells shown on the left (n = 9), and patients with lower frequency of NK cells shown on the right (n = 41).
Figure 1.
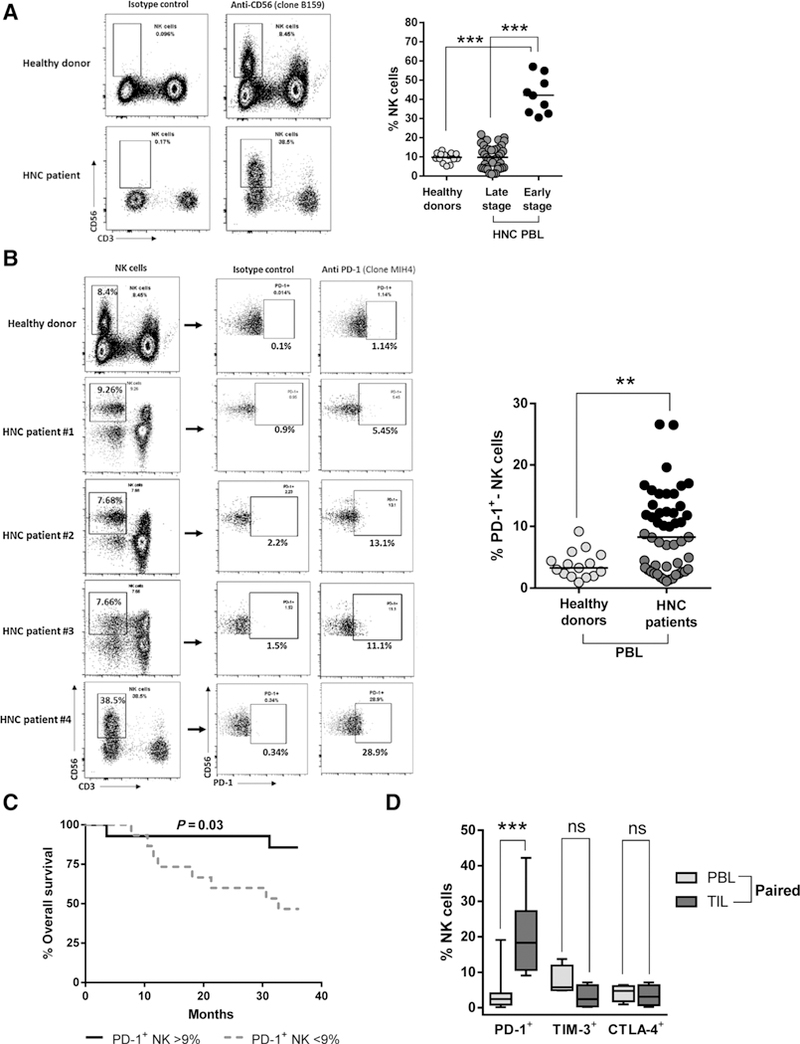
Frequency of total and PD-1+ NK cells in the circulation of HNC patients, association with clinical outcome, and enrichment of PD-1+ NK cells in HNC tumors. A, Frequency of total circulating NK cells (live CD3−CD56+ cells) in early-stage and late-stage HNC patients and healthy donors (HD). Representative gating strategy dot plots shown (left) and summary of 15 HD and 50 HNC patients (right). Black circles, early-stage HNC patients; dark gray circles, late-stage HNC patients (ANOVA, ***, P < 0.001). B, Percentage of circulating PD-1+ NK cells in HNC patients and HD. Representative gating strategy dot plots shown (left) and summary of 15 HD and 50 HNC patients (Student t test; **, P < 0.01; mean: 9%). Black circles, values above the mean; dark gray circles, values below the mean. C, Kaplan-Meier survival curve of HNC patients shown in B segregated by higher/lower frequency of PD-1+ NK cells (above and below the mean, respectively). Mean = 9% PD-1+ NK cells, log-rank test, P = 0.03. D, Frequency of PD-1+ NK cells in TILs and paired PBLs from HNC patients (ANOVA; ***, P < 0.0001, ns P > 0.05; PD-1+ n = 12, TIM-3/CTLA4+ n = 4).
Higher expression of NCR1 in HNC specimens correlates with better survival and PD-1 expression
To extend our previous findings, we used the transcriptional data from HNC specimens (n = 500) and matched controls (n = 43) in TCGA (34) and compared expression of the NK cell–specific marker NCR1 (NKp46) across different solid malignancies. HNC specimens showed the third highest expression of NCR1 (log RSEM units) when compared with other solid cancers (Fig. 2A, gray box). This finding suggests that NK cell infiltration may be important in HNC tumors, especially because patients with higher expression of NCR1 had significantly better survival (3-year follow-up) than those who had lower NCR1 expression (TCGA, n = 604; Fig. 2B).
Figure 2.
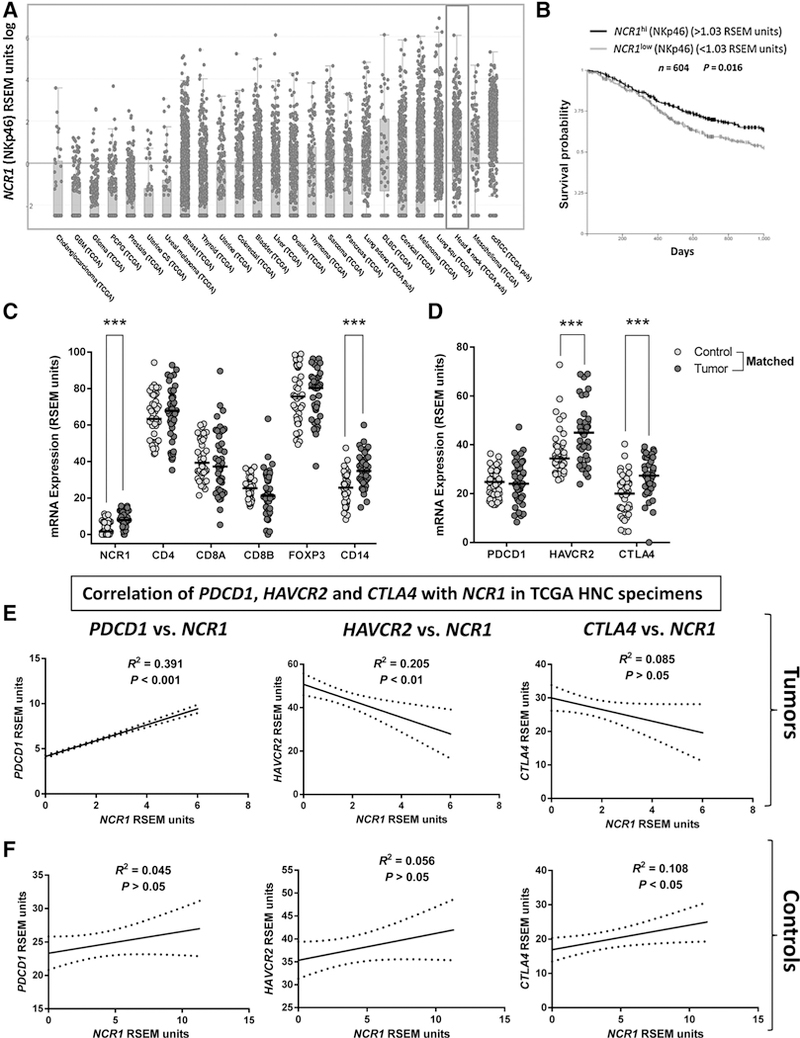
Elevated expression of NCR1 in HNC specimens (TCGA) is associated with better survival and correlates with PDCD1 expression. A, NCR1 mRNA expression (RSEM units) in HNC tumor specimens (gray box) ranks third highest among all solid tumors (n = 500, TCGA). B, Kaplan-Meier survival curve of HNC patients with high versus low tumor NCR1 expression. NKp46 (NCR1)hi versus NKp46 (NCR1)low (n = 604, TCGA c-Bio portal, log-rank test, P = 0.016). C, NCR1, CD4, CD8A, CD8B, FOXP3, and CD14 mRNA expression in HNC tumor specimens and matched control mucosa (n = 43, TCGA, Kruskal-Wallis test; ***, P < 0.001). D, PDCD1, HAVCR2, and CTLA4 expression (RSEM units) in tumor specimens and matched control mucosa (n = 43, TCGA, Kruskal-Wallis test; ***, P < 0.001). E, Correlation of NCR1 expression and PDCD1 (PD-1), CTLA4 (CTLA-4), or HAVCR2 (TIM-3) in HNC specimens (Pearson r test, graphs show linear regression curve fit. PD-1-positive correlation P < 0.001; CTLA-4, negative correlation P > 0.05; TIM-3, negative correlation P < 0.01). F, Correlation of NCR1 expression with that of PDCD1, CTLA4, and HAVCR2 in head and neck control mucosa (Pearson r test, graphs show linear regression curve fit; n = 43, TCGA).
To compare the infiltration extent of immune cell subsets including NK cells in HNC tumors versus paired healthy mucosa, we compared NCR1 expression with that of CD4, CD8A, CD8B, FOXP3, and CD14. A significantly higher expression of NCR1 and CD14 was observed in HNC tumors than in paired control mucosa (Fig. 2C), whereas CD4, CD8, and FOXP3 were expressed at similar levels, likely because of the ubiquitous presence of adaptive immune cells even in healthy tissues. However, overall NCR1 expression was lower than that of CD4, CD8, FOXP3, and CD14 in tumor specimens, which suggests that the extent of NK cell infiltration in HNC tumors may be lower than that of adaptive or myeloid immune cell subsets. Because our flow cytometry analyses showed an enrichment of PD-1+ NK cells in HNC tumors, we investigated the expression level of PD-1 (PDCD1) and other checkpoint receptors, such as TIM-3 (HAVCR2) and CTLA-4 (CTLA4), in the TCGA cohort. We found that PDCD1 was expressed similarly in control mucosa and HNC tumors. However, HAVCR2 and CTLA4 expression was higher in tumors (Fig. 2D). Because PDCD1, HAVCR2, or CTLA4 expression could correspond to many immune cell types present in the TME, we correlated their expression with that of NCR1 in HNC tumors and paired healthy mucosa, as an indicator of ICR expression on NK cells. Expression of PDCD1, but not of HAVCR2 or CTLA4, significantly correlated with NCR1 in HNC tumors (Fig. 2E, P < 0.001), and the positive correlation of NCR1 and PDCD1 found in tumors was not present when we analyzed matched control mucosa (Fig. 2F).
PD-1+ NK cells display an activated status that is downregulated after PD-L1 ligation in vitro
Our flow cytometry analyses showed that PD-1+, but not TIM-3+ or CTLA-4+, NK cells were enriched in TILs. Likewise, TCGA analyses showed that PDCD1, but not HAVCR2 or CTLA4, correlated with NCR1 in HNC tumors. These findings led us to further explore the role of PD-1 over other ICR on NK cells. Because a higher frequency of circulating PD-1+ NK cells was associated with better patient survival (Fig. 1C), we hypothesized that PD-1 expression on NK cells could constitute an activation marker that would provide a suppressive signal only after ligation with PD-L1, which is expressed by HNC tumors as we reported before (8). In order to test this hypothesis, we investigated whether activated NK cells concomitantly upregulated PD-1 expression (or TIM-3, CTLA-4) and activation markers CD69 and IFNγ in vitro. We cocultured purified NK cells with tumor cells with and without cetuximab and determined PD-1, TIM-3, CTLA-4, and CD69 expression by flow cytometry and IFNγ secretion by ELISA. Cetuximab-activated NK cells significantly upregulated PD-1 (Supplementary Fig. S2A) and CD69 but not TIM-3 or CTLA-4 expression when compared with baseline or the untreated conditions (Fig. 3A). PD-1+CD69+ NK cells were significantly higher than the PD-1+CD69– subset after cetuximab activation (Fig. 3B). Likewise, cetuximab-activated PD-1-upregulated NK cells showed high IFNγ secretion (Supplementary Fig. S2B), and IL2-mediated NK cell activation upregulated expression of PD-1, CD107a, IFNγ, granzyme B, and CD16 on NK cells (Fig. 3C). PD-1+ NK cells had significantly higher expression of IFNγ, granzyme B, and CD16 when compared with PD-1– NK cells (Fig. 3D). We did not find differences in granzyme B or CD107a expression between the PD-1low and PD-1hi NK cells (Supplementary Fig. S2C). These findings provide experimental evidence that both cetuximab and IL2-mediated activation induce PD-1 upregulation on NK cells. To test whether PD-L1 ligation could diminish the activation status of PD-1 upregulated NK cells, aliquots of IL2-activated NK cells were cocultured with either IgG1 control mAb or PD-L1 Ig-conjugated beads. We found that CD16, CD107a, IFNγ, and granzyme B expression were down-regulated by PD-L1 ligation compared with control beads or baseline activation (Fig. 3E). CD16 MFI expression also showed significant downregulation (Fig. 3F), suggesting that PD-L1 ligation of PD-1+ NK cells would also prevent further cetuximab activation signals through downregulation of CD16 surface expression.
Figure 3.
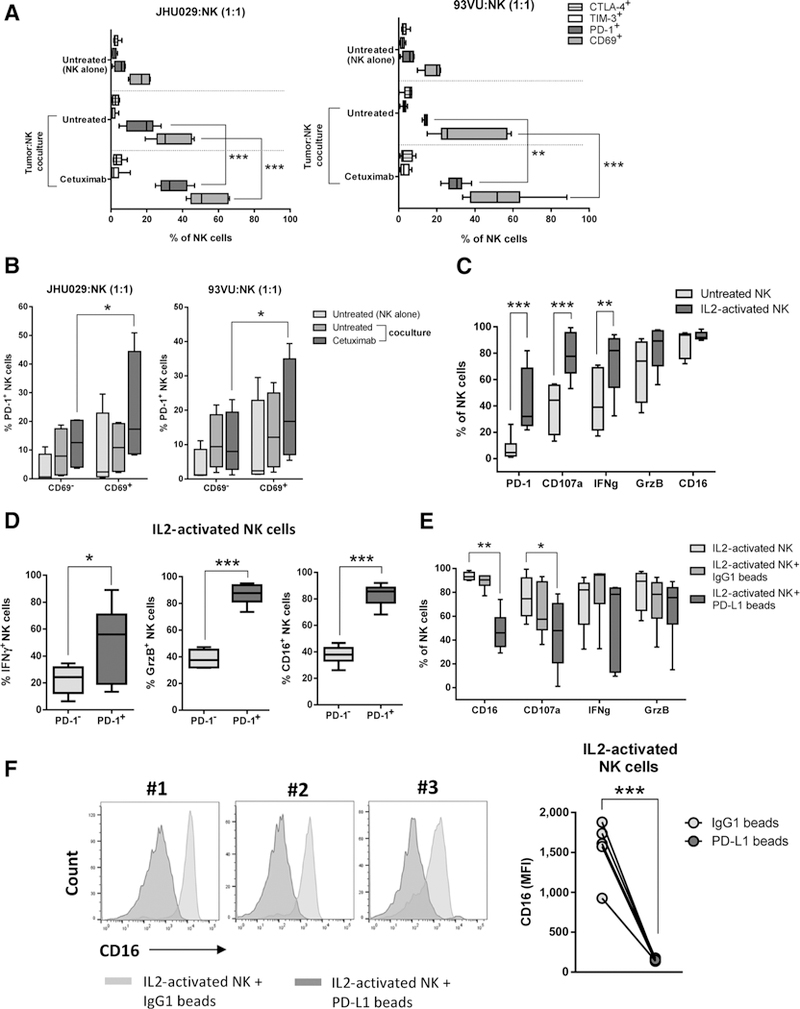
PD-L1 downregulates the activation status of PD-1+-activated NK cells in vitro. A, Healthy donor-purified NK cells were stained for PD-1, CTLA-4, TIM-3, and CD69 expression at baseline and after coculture with tumor cells (JHU029 and 93VU, NK:tumor ratio 1:1,24 hours) in the absence of mAb or with cetuximab (10 μg/mL). n = 6, Kruskal-Wallis test, ***, P < 0.001; **, P < 0.01. B, Frequency of PD-1+CD69+ and PD-1+CD69- NK cells after cetuximab activation. NK cells from experiment shown in A were analyzed for CD69 and PD-1 coexpression by flow cytometry (n = 6, Kruskal-Wallis test, *, P < 0.05). C, IL2-activated NK cells concomitantly upregulate PD-1, CD107a, IFNγ, granzyme B, and CD16. Purified NK cells were analyzed at baseline (gray boxes) or after rhIL2 treatment (130 IU/mL, 24 hours, dark gray boxes). n = 6, Kruskal-Wallis test; ***, P < 0.001; **, P < 0.01. D, Expression of IFNγ, GrzB, and CD16 in PD-1+ versus PD-1– NK cells. Healthy donor purified NK cells were treated with rhIL2 (130 IU/mL/24 hours) and markers were determined by flow cytometry (n = 6; Mann-Whitney test, ***, P < 0.001; *, P < 0.05). E, PD-1+ NK cells downregulate expression of activation markers after PD-L1 ligation. NK cells were activated as in D (light gray boxes), then incubated with either IgG1 control (dark gray boxes) or PD-L1-conjugated beads (darkest gray boxes) for additional 24 hours; cells were harvested, and CD16, CD107a, IFNγ, and granzyme B expression were determined by flow cytometry (n = 6, Kruskal-Wallis test, **, P < 0.01; *, P < 0.05). F, CD16 expression on activated NK cells after PD-L1 ligation. IL2-activated NK cells were cultured under the same conditions as in E and analyzed for CD16 expression (MFI) by flow cytometry (Student t test, n = 6; ***, P < 0.001).
TIL PD-1+ NK cells display an exhausted phenotype when PD-L1 is highly expressed in the tumor
On the basis of our in vitro findings, we hypothesized that TIL PD-1+ NK cells would interact with PD-L1 expressed in the tumor, which may provide a suppressive signal. Therefore, TIL PD-1+ NK cells would have lower expression of activation/effector molecules than PD-1- NK cells. We sorted TIL PD-1+ and PD-1- NK cells from a PD-L1-high-expressing tumor (85% PD-L1+ as determined by IHC) and analyzed their transcriptome profile (Supplementary Fig. S3A and S3B). We found a total of 3,391 differentially expressed genes, from which 1,745 were downregulated in TIL PD-1+ NK cells. Among the differentially downregulated transcripts (>2-fold) in PD-1+ versus PD-1– TIL NK cells were Th1 transcription factors, EOMES, BLIMP-1, and TBET. Likewise, NK cell activation markers such as CD69, CD38, 2B4, NKG2D, NKG2C, CD56, CD94, and KLRG1; upstream activation molecules ZAP70, CD247; cytolytic molecules such as GZMA, GZMK, PRF1, GNLY, and NKG7; RAS/MAPK, PI3K, and JAK-STAT signaling pathway molecules were also significantly downregulated. NK cell activating cytokine receptors such as IL2RB, IL12RB1, IL18RAP, and IL9R were also found to be downregulated in this subset (Supplementary Table S1). We did not find changes in expression of the inhibitory receptor KIR in TIL PD-1+ versus PD-1– NK cells (by transcriptome sequencing) or PBLs (by flow cytometry; Supplementary Fig. S4A). Other inhibitory receptors such as TIGIT, CD96, and HAVCR2 were found downregulated in PD-1+ NK cells.
Cetuximab increased circulating and tumor-infiltrating PD-1+ NK cells in PD-L1low/– tumors
In order to extend our in vitro findings, we used a cohort of advanced (stage III/IV) HNC patients who were treated with cetuximab in a prospective phase II neoadjuvant trial (clinical features shown in Table 2). Prior to and after 4 weeks of cetuximab therapy, PBLs and TILs were collected, and NK cells were analyzed by flow cytometry. We found a significant increase of PD-1+ NK cells in PBLs in cetuximab responders when compared with their respective matched pretreatment samples (Fig. 4A). Activated PD-1+IFNγ+ and PD-1+CD69+ NK cells were significantly higher in the circulation of responders post-cetuximab treatment (Fig. 4B; *, P > 0.05; **, P > 0.01). Similar to PBLs, we found that TIL PD-1+ NK cells were upregulated in post-cetuximab responders (Fig. 4C; left, representative gating strategy; right, summary of 5 patients with matched pre/post TILs). We characterized CD69 expression on PD-1+ NK cells pre/post-cetuximab treatment from three trial patients who also had tumor PD-L1 expression and response status available. We found that TIL PD-1+CD69+ NK cells were higher post-cetuximab treatment in a responder patient whose tumor was PD-L1-negative. In contrast, when tumor PD-L1 expression post-cetuximab was upregulated, we saw less enrichment of CD69+PD-1+ NK cells, a response that was associated with poor clinical outcome. Lower expression of tumor PD-L1 and CD69+PD-1+ NK cells post-cetuximab were seen in a partial responder (Fig. 4D and E). Because PD-L1 ligation of PD-1 upregulated NK cells reduced their activation status in vitro and a reduced activation status was associated with poor response to cetuximab therapy in vivo, we hypothesized that PD-1-PD-L1 axis blockade might reverse NK cell dysfunction. PD-1 blockade might enhance cetuximab-mediated tumor lysis, particularly because PD-L1 is expressed in the majority of HNC tumors (8).
Table 2.
Clinical features of HNC patients from the clinical trial UPCI #08–013
| Patients, n (%) | 6 (100) |
| Gender, n (%) | |
| Male | 4 (66.6) |
| Female | 2 (33.3) |
| Age, years; median (range) | 57.5 (47–74) |
| T stage, n (%) | |
| T1 | 1 (16.6) |
| T2 | 1 (16.6) |
| T3 | 1 (16.6) |
| T4 | 3 (50) |
| N stage, n (%) | |
| N0 | 2 (33.3) |
| N1 | 2 (33.3) |
| N2 | 2 (33.3) |
| Tumor site, n (%) | |
| Oral cavity | 2 (33.3) |
| Tonsil | 2 (33.3) |
| Larynx | 2 (33.3) |
| HPV status, n (%) | |
| Positive | 2 (33.5) |
| Not evaluated | 4 (66.5) |
| Response status, n (%) | |
| Responder | 3 (50) |
| Partial responder | 1 (16.6) |
| Nonresponder | 1 (16.6) |
| Not available | 1 (16.6) |
Figure 4.
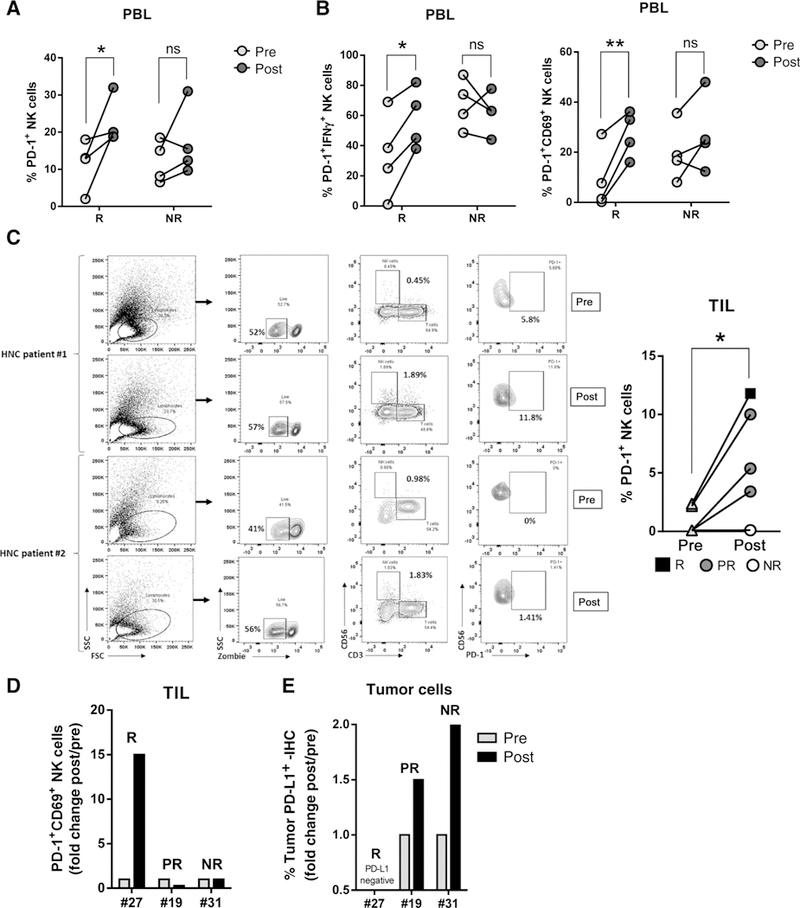
In vivo cetuximab responders have higher PD-1+ NK cells in PBLs and in TILs only when tumor cells expressed little to no PD-L1. A, Frequency of PBLPD-1+ NK cellsin vivo. PBLs were isolated from stage III/IVA HNC tumor specimens pre- and post-cetuximab single-agent treatment (clinical trial UPCI #08–013) and PD-1 expression on NK cells was determined by flow cytometry and matched with response status (n = 4 responders, n = 4 nonresponders. Wilcoxon test; ns, P > 0.05; *, P < 0.05; **, P < 0.001). B, PD-1+ IFNγ+ and PD-1+CD69+ NK cells were determined in the same cohort of patients (Wilcoxon test; ns, P > 0.05; *, P < 0.05; **, P < 0.001). C, TILs were isolated from tumor specimens pre- and post-cetuximab single-agent treatment and PD-1 expression on NK cells was determined by flow cytometry. Left, representative gating strategy; right, summary of 6 paired pre-post specimens (R, responder; PR, partial responder; NR, nonresponder; Wilcoxon test; *, P < 0.01). D, Frequency of PD-1+CD69+ NK cells in TIL post-cetuximab treatment and correlation with clinical response. Fold change of % PD-1+CD69+ NK cells POST/PRE cetuximab was calculated and matched with response status. R, responder; PR, partial responder; NR, nonresponder. E, PD-L1 expression (IHC) in tumor specimens in the same cohort shown in D. Fold change of PD-L1+ tumor cells POST/PRE cetuximab was determined and correlated with response status. R, responder; PR, partial responder; NR, nonresponder.
Cetuximab-activated NK cells increase IFNγ-mediated PD-L1 upregulation on tumor cells
We previously reported that IFNγ induces PD-L1 upregulation in HNC tumor cells (8). Because cetuximab-activated, PD-1 upregulated, NK cells increased IFNγ secretion (Supplementary Fig. S2B), we hypothesized that NK cell-derived IFNγ could upregulate PD-L1 expression on HNC cells in the coculture. We found that cetuximab-activated NK cells significantly upregulated PD-L1 expression on HNC cells in an IFNγ-dependent fashion because PD-L1 upregulation was completely abolished by an IFNγ-blocking mAb (Fig. 5A). To test whether nivolumab, a PD-1-blocking mAb, could further increase PD-L1 expression by enhancing cetuximab-dependent NK cell activation and IFNγ secretion, we cocultured purified NK cells and HNC cells with cetuximab, nivolumab, or the combination. An even higher PD-L1 upregulation on tumor cells was seen when NK cells were treated concurrently with cetuximab plus nivolumab (Fig. 5B).
Figure 5.
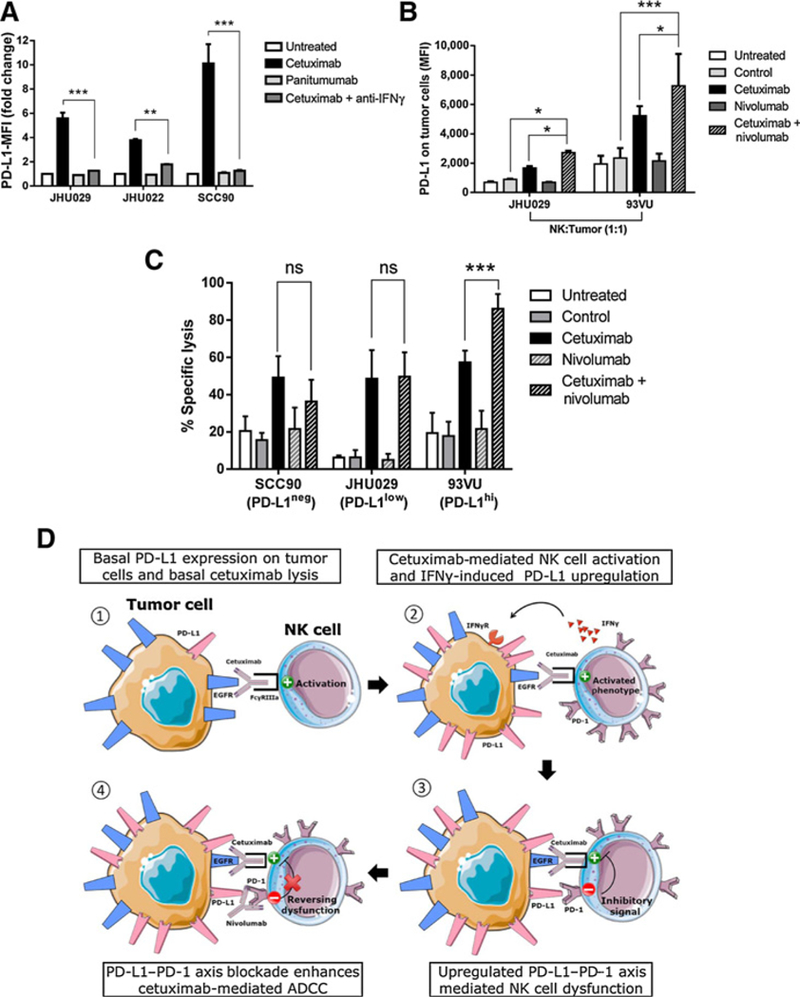
PD-1 blockade on NK cells enhances cetuximab-mediated ADCCof PD-L1high tumor cells. A, Cetuximab-activated NK cells upregulate PD-L1 expression on tumor cells in an IFNγ-dependent fashion. Healthy donor NK cells were cocultured with JHU029, JHU022, or SCC90 tumor targets for 24 hours in the absence of mAb, cetuximab (10 μg/mL), panitumumab (10 μg/mL), and cetuximab plus IFNγ-blocking antibody (anti-IFNγ, 50 ng/mL), harvested and PD-L1 expression on tumor cells was determined by flow cytometry (n = 3, ANOVA, **, P < 0.01; ***, P < 0.001). B, Expression of PD-L1 on tumor cells after cetuximab activation and PD-1 blockade on NK cells. NK cells were cocultured with tumor cells (JHU029 or 93VU, 1 to 1 ratio, 24 hours) in the absence of mAb or with IgG1 control (10 μg/mL), cetuximab (10 μg/mL), nivolumab (20 μg/mL), or cetuximab plus nivolumab, tumor cells were harvested and PD-L1 expression was determined by flow cytometry (n = 6, ANOVA, ***, P < 0.001; *, P < 0.05). C, Cetuximab-mediated ADCC of target cells with negative, low, or high PD-L1 expression. IL2-pretreated NK cells (130 IU/mL, 24 hours) were cocultured with PD-L1-negative (SCC90), PD-L1-low (JHU029), or PD-L1-high (93VU) tumor targets (51Cr labeled, 20:1 ratio) with no mAb, IgG1 isotype control (10 μg/mL), cetuximab (10 μg/mL), nivolumab (20 μg/mL), or cetuximab + nivolumab for 4 hours. 51Cr release was determined and % specific lysis was calculated (n = 3, ANOVA; ns, P > 0.05; ***, P < 0.001). D, PD-1-PD-L1-mediated tumor immune evasion of NK cell cytotoxicity. (1) HNC cells express basal PD-L1, cetuximab induces CD16-mediated NK cell activation and basal lysis. (2) Cetuximab activated NK cells increase PD-1 expression and secrete IFNγ that in turn induces PD-L1 upregulation on tumor cells. (3) Tumor PD-L1 binds upregulated PD-1 on NK cells, providing an inhibitory signal for NK cell-CD16 mediated activation. (4) Nivolumab-mediated PD-1 blockade restores NK cell activation and enhances cetuximab-mediated ADCC.
PD-1 blockade enhanced cetuximab-mediated NK cell cytotoxicity against PD-L1high tumor cells
Next, we determined whether PD-1–PD-L1 axis blockade with nivolumab could enhance cetuximab-mediated NK cell cytotoxicity of tumor targets with either negative, low, or high PD-L1 expression. We hypothesized that the extent of tumor PD-L1 expression would be the limiting factor for the efficacy of PD-1 blockade mediating enhancement of NK cell activation, especially because higher PD-1 expression was not seen on NK cells activated with cetuximab plus nivolumab compared with cetuximab alone (Supplementary Fig. S5A). In order to test our hypothesis, we cocultured PD-1 upregulated NK cells (IL2 pretreated) with either PD-L1 negative (SCC90), PD-L1low (JHU029), or PD-L1high (93VU) tumor target cells (Supplementary Fig. S5B). Under these conditions, we found that nivolumab enhanced cetuximab-mediated NK cell ADCC only when tumor targets expressed higher PD-L1, given that cetuximab cytotoxicity was only significantly increased by nivolumab in 93VU but not SCC90 or JHU029 cells (Fig. 5C). Therefore, NK cells upregulate PD-1 upon activation and concomitantly induce PD-L1 on tumor cells via IFNγ secretion, upregulating the suppressive PD-1–PD-L1 axis leading to NK cell dysfunction. PD-1 blockade appeared to enhance cetuximab-mediated NK cell cytotoxicity primarily when PD-L1 was highly expressed on tumor targets (Fig. 5D).
Discussion
Although the suppressive PD-1–PD-L1 axis is well documented in T-cell tumor immune evasion (35, 36), information regarding ICR on NK cells is still sparse. Here, we report that early-stage HNC patients (T1, 44%; N0, 77%) have higher circulating NK cells compared with late-stage HNC patients (T1, 24%; N0, 24%), findings that agree with previous reports from breast cancer patients (37, 38). Lang and colleagues also found a high frequency of NK cells in HNC patients (39). We report that circulating PD-1+ NK cells are significantly higher in HNC patients than in healthy controls, and higher frequency of circulating PD-1+ NK cells (mean value >9%) was associated with better overall survival. PD-1+ NK cells were significantly enriched in tumors when compared with paired PBLs, suggesting that PD-1+ NK cells traffic to the TME or are activated there. As part of our characterization of ICR expression of NK cells, we also analyzed TIM-3 and CTLA-4 expression. We found higher frequencies of TIM-3+ NK cells in PBLs of HNC patients. Previous reports showed that PBL TIM-3+ NK cells appeared to be dysfunctional because they had lower expression of T-bet, EOMES, IFNγ, CD107a, and impaired cytotoxicity could be reversed by TIM-3 blockade (40–42). However, we did not find enrichment of TIM-3+ NK cells in HNC tumors nor a positive correlation between HAVCR2 (TIM-3) and NCR1 (NKp46) expression in TCGA HNC specimens. We also found that CTLA-4 expression on NK cells was low or undetectable in PBLs and TILs, as well as in healthy donors, as previously reported (39, 43).
Because NCR1 (NKp46) is a specific marker of NK cells (44), we analyzed NCR1 mRNA expression as a surrogate indicative of NK cell infiltration in HNC specimens. The high expression of NCR1 in HNC compared with all other solid malignancies suggests an antitumor role of NK cells, especially because we found higher tumor NCR1 expression (>median: 1.03 RSEM) was associated with better patient survival (n = 604). However, NCR1 expression was lower than that of CD4, CD8, FOXP3, and CD14, which may suggest a lesser extent of NK cell infiltration in HNC tumors than adaptive lymphocytic or myeloid immune cell subsets. Likewise, a higher expression of HAVCR2 and CTLA4 mRNAs was noted in HNC tumors than in paired control mucosa. However, such high expression correlated negatively with NCR1 expression, whereas PDCD1 expression showed a positive correlation specific to tumor specimens and not healthy tissue, indicating that the higher HAVCR2 or CTLA4 expression detected in our TCGA analysis may correspond to other immune subsets that infiltrate the tumor such as CD8+ T cells or regulatory T cells as we reported previously (45–47).
When we analyzed the differential transcriptome expression of paired TIL PD-1+ versus PD-1– NK cells from a specimen that expressed high PD-L1, we noted >2-fold downregulation of NK cell activation/effector molecules such as EOMES, BLIMP-1, TBET, CD69, 2B4, NKG2D, NKG2C, and NKG2E in the PD-1+ subset. KLRG1, which constitutes a marker of responsiveness in innate lymphoid cells that is downregulated by PD-1 (48), was found to be downregulated in our study, providing further evidence of a less responsive phenotype of TIL PD-1+ NK cells. Likewise, PI3K and MAPK pathway components that are crucial for NK cell activation downstream NKG2D, 2B4, and IFNG production were downregulated (49–54). IL2RB1, IL12RB, IL18RAP, and IL9R, which are essential for NK cell activation, proliferation, and survival (55–57), were also found to be downregulated in TIL PD-1+ NK cells. The inhibitory receptor NKG2A was found to be neither downregulated nor upregulated in our study, an observation concordant with that of Pesce and colleagues, where PD-1+ NK cells were NKG2A- (27). mRNA expression of other ICR such as TIGIT, HAVCR2, and CD96, which inhibit NK cell responses in mice (58), was found to be downregulated in TIL PD-1+ NK cells when compared with the PD-1– subset, suggesting that compensatory ICR upregulation may not happen on human TIL PD-1+ NK cells.
In the light of these findings, we hypothesized that PD-1+ NK cells are activated and would become dysfunctional when exposed to PD-L1 ligation in the tumor. We tested this hypothesis in vitro, where CD16- or IL2-activated NK cells upregulated PD-1 along with CD69, CD107a, IFNγ, and granzyme B, which were subsequently downregulated after ligation by PD-L1. Activated PD-1+ NK cells had significantly higher coexpression of IFNγ, granzyme B, and CD16 than PD-1- NK cells. PD-L1 ligation of PD-1-upregulated NK cells induced a significant downregulation of CD16 surface density in vitro (MFI), suggesting that PD-1–PD-L1 interaction could prevent cetuximab cytotoxicity not only by blocking CD16 intracellular activation cascade via PD-1/SHP2, but also by diminishing the number of CD16 receptors capable of binding to cetuximab. Our observation that PD-1+ NK cells display an activated status is concordant with those found in gastric cancer where PBLPD-1+ NK cells expressed higher CD107a and NKG2D than the PD-1- subset and that PD-1 blockade increased IFNγ and CD107a expression (59). Similarly, Pesce and colleagues demonstrated higher expression of perforin, granzyme B, and CD16 in PD-1+ than in PD-1- NK cells from PBLs in ovarian cancer patients (27). Previous studies showed that TIL PD-1+ T cells coexpress Th1 transcription factors T-bet and STAT1 and correlate with better clinical outcome (3, 9). We also reported that TIL CD8+ T cells with PD-1hi expression had higher granzyme B than the PD-1low subset (9, 45). In contrast, we did not find differences in granzyme B or CD107a expression between the PD-1low and PD-1hi NK cells.
Because cetuximab treatment induced upregulation of PD-1+ NK cells in vitro and in vivo, the otherwise beneficial effect of cetuximab may constitute a mechanism of tumor immune escape dominated by PD-1-PD-L1 axis interaction in the TME. Nivolu-mab significantly increased cetuximab-mediated killing only when PD-L1 had high expression in tumor targets. Therefore, tumor PD-L1 expression was the single most important factor that provided suppressive signals to NK cells since PD-1 expression remained constant on NK cells in both conditions. These findings agree with reports that demonstrate a better clinical outcome of anti–PD-1 therapy when tumors had robust PD-L1 expression, presenting PD-L1 expression as a predictor of response to anti–PD-1 therapy (13, 60). Further highlighting the role of NK cells in anti–PD-1 immunotherapy, a study reported significant association of an NK cell gene signature with better clinical outcome of non-small cell lung cancer, melanoma, and HNC patients treated with pembrolizumab and nivolumab (61). Overall, our results showed a better prognosis for HNC patients who have higher frequency of circulating PD-1+ NK cells and that PD-1+ NK cells display an activated status and become dysfunctional only when PD-1 is bound by its cognate ligand PD-L1 in the tumor. PD-1 blockade restored NK cytotoxicity against PD-L1high expressing tumor targets and enhanced cetuximab-mediated ADCC (Fig. 5D). Our findings support the combination of PD-1 and EGFR blockade in HNC patients with high PD-L1 tumor expression in order to improve their clinical response.
Supplementary Material
Acknowledgments
This work was supported by NIH grants R01 DE19727, P50 CA097190, and CA110249 and University of Pittsburgh Cancer Center Support Grant P30CA047904.
We thank Dr. Angen Liu for his kind help with scoring IHC images from the PD-L1-stained tumor specimens included in this report.
The costs of publication of this article were defrayed in part by the payment of page charges. This article must therefore be hereby marked advertisement in accordance with 18 U.S.C. Section 1734 solely to indicate this fact.
Footnotes
Disclosure of Potential Conflicts of Interest
R.L. Ferris has received compensation for consulting/advisory boards from Astra-Zeneca/Medimmune, Bristol-Myers Squibb, Merck, Pfizer, and Tesaro. Through contracts with the UPMC Hillman Cancer Center, his laboratory has also been funded to perform sponsored research by Astra-Zeneca/Medimmune, Bristol-Myers Squibb, and Tesaro. No potential conflicts of interest were disclosed by the other authors.
Note: Supplementary data for this article are available at Cancer Immunology Research Online (http://cancerimmunolres.aacrjournals.org/).
References
- 1.Okazaki T, Honjo T. The PD-1-PD-L pathway in immunological tolerance. Trends Immunol 2006;27:195–201. [DOI] [PubMed] [Google Scholar]
- 2.KeirME LiangSC, GuleriaI LatchmanYE, QipoA AlbackerLA, et al. Tissue expression of PD-L1 mediates peripheral T cell tolerance. J Exp Med 2006;203:883–95. [DOI] [PMC free article] [PubMed] [Google Scholar]
- 3.Li J, Jie HB, Lei Y, Gildener-Leapman N, Trivedi S, Green T, et al. PD-1/SHP- 2 inhibits Tc1/Th1 phenotypic responses and the activation of T cells in the tumor microenvironment. Cancer Res 2015;75:508–18. [DOI] [PMC free article] [PubMed] [Google Scholar]
- 4.Tseng SY, Otsuji M, Gorski K, Huang X, Slansky JE, Pai SI, et al. B7-DC, a new dendritic cell molecule with potent costimulatory properties for T cells. J Exp Med 2001;193:839–46. [DOI] [PMC free article] [PubMed] [Google Scholar]
- 5.Wang L, Pino-Lagos K, de Vries VC, Guleria I, Sayegh MH, Noelle RJ. Programmed death 1 ligand signaling regulates the generation of adaptive Foxp3+CD4+ regulatory T cells. Proc Natl Acad Sci USA 2008;105: 9331–6. [DOI] [PMC free article] [PubMed] [Google Scholar]
- 6.Iwai Y, Ishida M, Tanaka Y, Okazaki T, Honjo T, Minato N. Involvement of PD-L1 on tumor cells in the escape from host immune system and tumor immunotherapy by PD-L1 blockade. Proc Natl Acad Sci USA 2002;99: 12293–7. [DOI] [PMC free article] [PubMed] [Google Scholar]
- 7.Tsushima F, Yao S, Shin T, Flies A, Flies S, Xu H, et al. Interaction between B7-H1 and PD-1 determines initiation and reversal of T-cell anergy. Blood 2007;110:180–5. [DOI] [PMC free article] [PubMed] [Google Scholar]
- 8.Concha-Benavente F, Srivastava RM, Trivedi S, Lei Y, Chandran U, Seethala RR, et al. Identification of the cell-intrinsic and -extrinsic pathways downstream of EGFR and IFNγ that induce PD-L1 expression in head and neck cancer. Cancer Res 2016;76:1031–43. [DOI] [PMC free article] [PubMed] [Google Scholar]
- 9.Badoual C, Hans S, Merillon N, Van Ryswick C, Ravel P, Benhamouda N, et al. PD-1-expressing tumor-infiltrating T cells are a favorable prognostic biomarker in HPV-associated head and neck cancer. Cancer Res 2013; 73:128–38. [DOI] [PubMed] [Google Scholar]
- 10.Katou F, Ohtani H, Watanabe Y, Nakayama T, Yoshie O, Hashimoto K. Differing phenotypes between intraepithelial and stromal lymphocytes in early-stage tongue cancer. Cancer Res 2007;67:11195–201. [DOI] [PubMed] [Google Scholar]
- 11.Malm IJ, Bruno TC, Fu J, Zeng Q, Taube JM, Westra W, et al. Expression profile and in vitro blockade of programmed death-1 in human papillomavirus-negative head and neck squamous cell carcinoma. Head Neck 2015;37:1088–95. [DOI] [PMC free article] [PubMed] [Google Scholar]
- 12.Ferris RL. Immunology and immunotherapy of head and neck cancer. J Clin Oncol 2015;33:3293–304. [DOI] [PMC free article] [PubMed] [Google Scholar]
- 13.Ferris RL, Blumenschein G, Fayette J, Guigay J, Colevas AD, Licitra L, et al. Nivolumab for recurrent squamous-cell carcinoma of the head and neck. N Engl J Med 2016;375:1856–67. [DOI] [PMC free article] [PubMed] [Google Scholar]
- 14.Sharma P, Allison JP. The future of immune checkpoint therapy. Science 2015;348:56–61. [DOI] [PubMed] [Google Scholar]
- 15.Ferris RL, Jaffee EM, Ferrone S. Tumor antigen-targeted, monoclonal antibody-based immunotherapy: clinical response, cellular immunity, and immunoescape. J Clin Oncol 2010;28:4390–9. [DOI] [PMC free article] [PubMed] [Google Scholar]
- 16.Hersey P, Edwards A, Honeyman M, McCarthy WH. Lownatural-killer-cell activity in familial melanoma patients and their relatives. Br J Cancer 1979;40:113–22. [DOI] [PMC free article] [PubMed] [Google Scholar]
- 17.Fauriat C, Just-Landi S, Mallet F, Arnoulet C, Sainty D, Olive D, et al. Deficient expression of NCR in NK cells from acute myeloid leukemia: Evolution during leukemia treatment and impact of leukemia cells in NCRdull phenotype induction. Blood 2007;109:323–30. [DOI] [PubMed] [Google Scholar]
- 18.Saito H, Osaki T, Ikeguchi M. Decreased NKG2D expression on NK cells correlates with impaired NK cell function in patients with gastric cancer. Gastric Cancer 2012;15:27–33. [DOI] [PubMed] [Google Scholar]
- 19.Schantz SP, Shillitoe EJ, Brown B, Campbell B. Natural killer cell activity and head and neck cancer: a clinical assessment. J Natl Cancer Inst 1986;77:869–75. [PubMed] [Google Scholar]
- 20.Coca S, Perez-Piqueras J, Martinez D, Colmenarejo A, Saez MA, Vallejo C, et al. The prognostic significance of intratumoral natural killer cells in patients with colorectal carcinoma. Cancer 1997;79:2320–8. [DOI] [PubMed] [Google Scholar]
- 21.Takeuchi H, Maehara Y, Tokunaga E, Koga T, Kakeji Y, Sugimachi K. Prognostic significance of natural killer cell activity in patients with gastric carcinoma: a multivariate analysis. Am J Gastroenterol 2001; 96:574–8. [DOI] [PubMed] [Google Scholar]
- 22.Ishigami S, Natsugoe S, Tokuda K, Nakajo A, Che X, Iwashige H, et al. Prognostic value of intratumoral natural killer cells in gastric carcinoma. Cancer 2000;88:577–83. [PubMed] [Google Scholar]
- 23.Srivastava RM, Lee SC, Andrade Filho PA, Lord CA, Jie HB, Davidson HC, et al. Cetuximab-activated natural killer and dendritic cells collaborate to trigger tumor antigen-specific T-cell immunity in head and neck cancer patients. Clin Cancer Res 2013;19:1858–72. [DOI] [PMC free article] [PubMed] [Google Scholar]
- 24.Kim S, Grandis JR, Rinaldo A, Takes RP, Ferlito A. Emerging perspectives in epidermal growth factor receptor targeting in head and neck cancer. Head Neck 2008;30:667–74. [DOI] [PubMed] [Google Scholar]
- 25.Argiris A, Karamouzis MV, Raben D, Ferris RL. Head and neck cancer. Lancet 2008;371:1695–709. [DOI] [PMC free article] [PubMed] [Google Scholar]
- 26.Beldi-Ferchiou A, Lambert M, Dogniaux S, Vely F, Vivier E, Olive D, et al. PD-1 mediates functional exhaustion of activated NK cells in patients with Kaposi sarcoma. Oncotarget 2016;7:72961–77. [DOI] [PMC free article] [PubMed] [Google Scholar]
- 27.Pesce S, Greppi M, Tabellini G, Rampinelli F, Parolini S, Olive D, et al. Identification of a subset of human natural killer cells expressing high levels of programmed death 1: A phenotypic and functional characterization. J Allergy Clin Immunol 2017;139:335–46.e3. [DOI] [PubMed] [Google Scholar]
- 28.Benson DM Jr, Bakan CE, Mishra A, Hofmeister CC, Efebera Y, Becknell B, et al. The PD-1 /PD-L1 axis modulates the natural killer cell versus multiple myeloma effect: a therapeutic target for CT-011,a novel monoclonal anti- PD-1 antibody. Blood 2010;116:2286–94. [DOI] [PMC free article] [PubMed] [Google Scholar]
- 29.Francisco LM, Salinas VH, Brown KE, Vanguri VK, Freeman GJ, Kuchroo VK, et al. PD-L1 regulates the development, maintenance, and function of induced regulatory T cells. J Exp Med 2009;206:3015–29. [DOI] [PMC free article] [PubMed] [Google Scholar]
- 30.Schmitt NC, Trivedi S, Ferris RL. STAT1 activation is enhanced by cisplatin and variably affected by EGFR inhibition in HNSCC cells. Mol Cancer Ther 2015;14:2103–11. [DOI] [PMC free article] [PubMed] [Google Scholar]
- 31.Li B, Dewey CN. RSEM: accurate transcript quantification from RNA-Seq data with or without a reference genome. BMC Bioinformatics 2011; 12:323. [DOI] [PMC free article] [PubMed] [Google Scholar]
- 32.Chen BJ, Chapuy B, Ouyang J, Sun HH, Roemer MG, Xu ML, et al. PD-L1 expression is characteristic of a subset of aggressive B-cell lymphomas and virus-associated malignancies. Clin Cancer Res 2013;19:3462–73. [DOI] [PMC free article] [PubMed] [Google Scholar]
- 33.Pezzotti N, Lelieveldt BPF, Van Der Maaten L, Hollt T, Eisemann E, Vilanova A. Approximated and user steerable tSNE for progressive visual analytics. IEEE Trans Vis Comput Graph 2017;23:1739–52. [DOI] [PubMed] [Google Scholar]
- 34.Cancer Genome Atlas N Comprehensive genomic characterization ofhead and neck squamous cell carcinomas. Nature 2015;517:576–82. [DOI] [PMC free article] [PubMed] [Google Scholar]
- 35.Brown JA, Dorfman DM, Ma FR, Sullivan EL, Munoz O, Wood CR, et al. Blockade of programmed death-1 ligands on dendritic cells enhances T cell activation and cytokine production. J Immunol 2003;170:1257–66. [DOI] [PubMed] [Google Scholar]
- 36.Strome SE, Dong H, Tamura H, Voss SG, Flies DB, Tamada K, et al. B7-H1 blockade augments adoptive T-cell immunotherapy for squamous cell carcinoma. Cancer Res 2003;63:6501–5. [PubMed] [Google Scholar]
- 37.Melioli G, Semino C, Margarino G, Mereu P, Scala M, Cangemi G, et al. Expansion of natural killer cells in patients with head and neck cancer: detection of “noninhibitory” (activating) killer Ig-like receptors on circulating natural killer cells. Head Neck 2003;25:297–305. [DOI] [PubMed] [Google Scholar]
- 38.Mamessier E, Pradel LC, Thibult ML, Drevet C, Zouine A, Jacquemier J,et al. Peripheral blood NK cells from breast cancer patients are tumor-induced composite subsets. J Immunol 2013;190:2424–36. [DOI] [PubMed] [Google Scholar]
- 39.Lang S, Vujanovic NL, Wollenberg B, Whiteside TL. Absence of B7.1-CD28/CTLA-4-mediated co-stimulation in human NK cells. Eur J Immunol 1998;28:780–6. [DOI] [PubMed] [Google Scholar]
- 40.Wang Z, Zhu J, Gu H, Yuan Y, Zhang B, Zhu D, et al. The clinical significance of abnormal Tim-3 expression on NK cells from patients with gastric cancer. Immunol Invest 2015;44:578–89. [DOI] [PubMed] [Google Scholar]
- 41.Xu L, Huang Y, Tan L, Yu W, Chen D, Lu C, et al. Increased Tim-3 expression in peripheral NK cells predicts a poorer prognosis and Tim-3 blockade improves NK cell-mediated cytotoxicity in human lung adenocarcinoma. Int Immunopharmacol 2015;29:635–41. [DOI] [PubMed] [Google Scholar]
- 42.da Silva IP, Gallois A, Jimenez-Baranda S, Khan S, Anderson AC, Kuchroo VK, et al. Reversal of NK-cell exhaustion in advanced melanoma by Tim-3 blockade. Cancer Immunol Res 2014;2:410–22. [DOI] [PMC free article] [PubMed] [Google Scholar]
- 43.Silva IEDPD, Gallois A, Lui KP, Shapiro RL, Pavlick AC, Bhardwaj N, et al. The effect of ipilimumab on natural killer cells identifies the subset of advanced melanoma patients with clinical response. J Clin Oncol 2015;33 (15_suppl):9065. [Google Scholar]
- 44.Freud AG, Zhao S, Wei S, Gitana GM, Molina-Kirsch HF, Atwater SK, et al. Expression of the activating receptor, NKp46 (CD335), in human natural killer and T-cell neoplasia. Am J Clin Pathol 2013; 140:853–66. [DOI] [PubMed] [Google Scholar]
- 45.Kansy BA, Concha-Benavente F, Srivastava RM, Jie HB, Shayan G, Lei Y, et al. PD-1 status in CD8(+) T cells associates with survival and anti-PD-1 therapeutic outcomes in head and neck cancer. Cancer Res 2017; 77:6353–64. [DOI] [PMC free article] [PubMed] [Google Scholar]
- 46.Shayan G, Srivastava R, Li J, Schmitt N, Kane LP, Ferris RL. Adaptive resistance to anti-PD1 therapy by Tim-3 upregulation is mediated by the PI3K-Akt pathway in head and neck cancer. Oncoimmunology 2017;6: e1261779. [DOI] [PMC free article] [PubMed] [Google Scholar]
- 47.Jie HB, SchulerPJ, Lee SC, Srivastava RM, Argiris A, Ferrone S, et al. CTLA-4+ regulatory T cells increased in cetuximab-treated head and neck cancer patients suppress NK cell cytotoxicity and correlate with poor prognosis. Cancer Res 2015;75:2200–10. [DOI] [PMC free article] [PubMed] [Google Scholar]
- 48.Taylor S, Huang Y, Mallett G, Stathopoulou C, Felizardo TC, Sun MA, et al. PD-1 regulates KLRG1+ group 2 innate lymphoid cells. J Exp Med 2017;214:1663–78. [DOI] [PMC free article] [PubMed] [Google Scholar]
- 49.Tassi I, Cella M, Gilfillan S, Turnbull I, Diacovo TG, Penninger JM, et al. p110gamma and p110delta phosphoinositide 3-kinase signaling pathways synergize to control development and functions ofmurine NK cells. Immunity 2007;27:214–27. [DOI] [PubMed] [Google Scholar]
- 50.Kim N, Saudemont A, Webb L, Camps M, Ruckle T, Hirsch E, et al. The p110delta catalytic isoform of PI3Kisa key player in NK-cell development and cytokine secretion. Blood 2007;110:3202–8. [DOI] [PubMed] [Google Scholar]
- 51.Saudemont A, Garcon F, Yadi H, Roche-Molina M, Kim N, Segonds-Pichon A, et al. p110gamma andp110delta isoforms of phosphoinositide 3-kinase differentially regulate natural killer cell migration in health and disease. Proc Natl Acad Sci USA 2009;106:5795–800. [DOI] [PMC free article] [PubMed] [Google Scholar]
- 52.Bloch-Queyrat C, Fondaneche MC, Chen R, Yin L, Relouzat F, Veillette A, et al. Regulation of natural cytotoxicity by the adaptor SAP and the Src- related kinase Fyn. J Exp Med 2005;202:181–92. [DOI] [PMC free article] [PubMed] [Google Scholar]
- 53.Dong Z, Davidson D, Perez-Quintero LA, Kurosaki T, Swat W, Veillette A. The adaptor SAP controls NK cell activation by regulating the enzymes Vav- 1 and SHIP-1 and by enhancing conjugates with target cells. Immunity 2012;36:974–85. [DOI] [PubMed] [Google Scholar]
- 54.Eissmann P, Beauchamp L, Wooters J, Tilton JC, Long EO, Watzl C. Molecular basis for positive and negative signaling by the natural killer cell receptor 2B4 (CD244). Blood 2005;105:4722–9. [DOI] [PubMed] [Google Scholar]
- 55.Cho D, Campana D. Expansion and activation of natural killer cells for cancer immunotherapy. Korean J Lab Med 2009;29:89–96. [DOI] [PMC free article] [PubMed] [Google Scholar]
- 56.Fagan EA, Eddleston AL. Immunotherapy for cancer: the use of lymphokine activated killer (LAK) cells. Gut 1987;28:113–6. [DOI] [PMC free article] [PubMed] [Google Scholar]
- 57.West WH, Tauer KW, Yannelli JR, Marshall GD, Orr DW, Thurman GB, et al. Constant-infusion recombinant interleukin-2 in adoptive immunotherapy of advanced cancer. N Engl J Med 1987;316: 898–905. [DOI] [PubMed] [Google Scholar]
- 58.Barrow AD, Edeling MA, Trifonov V, Luo J, Goyal P, Bohl B, et al. Natural killer cells control tumor growth by sensing a growth factor. Cell 2018; 172:534–48.e19. [DOI] [PMC free article] [PubMed] [Google Scholar]
- 59.Liu Y, Cheng Y, Xu Y, Wang Z, Du X, Li C, et al. Increased expression of programmed cell death protein 1 on NK cells inhibits NK-cell-mediated anti-tumor function and indicates poor prognosis in digestive cancers. Oncogene 2017;36:6143–53. [DOI] [PMC free article] [PubMed] [Google Scholar]
- 60.Seiwert TY, Burtness B, Weiss J, Gluck I, Eder JP, Pai SI, et al. Aphase Ib study of MK-3475 in patients with human papillomavirus (HPV)-associated and non-HPV-associated head and neck (H/N) cancer. ASCO Meeting Abstracts 2014;32(15_suppl):6011. [Google Scholar]
- 61.Prat A, Navarro A, Pare L, Reguart N, Galvan P, Pascual T, et al. Immune-related gene expression profiling after PD-1 blockade in non-small cell lung carcinoma, head and neck squamous cell carcinoma, and melanoma. Cancer Res 2017;77:3540–50. [DOI] [PubMed] [Google Scholar]
Associated Data
This section collects any data citations, data availability statements, or supplementary materials included in this article.