

Abstract
The ubiquitin C‐terminal hydrolase‐L1 (UCH‐L1) is a deubiquitinating enzyme that catalyses the hydrolysis of polyubiquitin precursors and small ubiquitin adducts. UCH‐L1 has been detected in a variety of malignant and metastatic tumours but its biological function in these cells is unknown. We have previously shown that UCH‐L1 is highly expressed in Burkitt’s lymphoma (BL) and is up‐regulated upon infection of B lymphocytes with Epstein–Barr virus (EBV). Here we show that knockdown of UCH‐L1 by RNAi inhibits the proliferation of BL cells in suspension and semisolid agar and activates strong LFA‐1‐dependent homotypic adhesion. Induction of cell adhesion correlated with cation‐induced binding to ICAM‐1, clustering of LFA‐1 into lipid rafts and constitutive activation of the Rap1 and Rac1 GTPases. Expression of a catalytically active UCH‐L1 promoted the proliferation of a UCH‐L1‐negative EBV transformed lymphoblastoid cell line (LCL) and inhibited cell adhesion, whereas a catalytic mutant had no effect, confirming the requirement of UCH‐L1 enzymatic activity for the regulation of these phenotypes. Our results identify UCH‐L1 as a new player in the signalling pathways that promote the proliferation and invasive capacity of malignant B cells.
Keywords: UCH‐L1, cell proliferation, integrin activation, Burkitt’s lymphoma, tumor progression
Introduction
The modification of cellular proteins by ubiquitin (Ub) and ubiquitin‐like (UbL) molecules and the degradation of polyubiquitinated substrates by the proteasome control a broad spectrum of cellular processes that regulate cell proliferation, functional differentiation and apoptosis (reviewed in [1]). Increasing evidence points to a pivotal role of specific proteases that fine‐tune Ub‐ and UbL‐regulated processes by assuring the availability of the modifiers and modulating the turnover of modified substrates, which influences proteins stability, their function and subcellular localization (reviewed in [2]). Approximately a hundred putative deubiquitinating enzymes (DUBs) have been identified in the human genome but only few of them have been functionally characterized (reviewed in [3]). Their roles are diverse, varying from housekeeping functions, such as maintenance of a pool of free Ub, to highly specialized regulatory activities on specific substrates and signalling pathways, making them potentially interesting as therapeutic targets.
Alterations in the expression and activity of enzymes of the ubiquitin‐proteasome system (UPS) are often observed in malignant cells. Burkitt’s lymphoma (BL), a highly malignant B cell tumour characterized by chromosomal translocations that constitutively activate the c‐myc oncogene (reviewed in [4]), is a well‐documented example of a tumour where deregulation of the UPS may contribute to the growth and immune escape of the malignant cells (reviewed in [5]). BL biopsies and derived cell lines that maintain in vitro the characteristics of the original tumour express low levels of B‐cell activation markers, co‐stimulatory and adhesion molecules and major histocompatibility complex (MHC) class I [6, 7]. BL cells are also deficient in their ability to process and present endogenous antigens [8], which correlates with low expression of the interferon‐γ‐inducible subunits of the proteasome and the peptide transporters, TAP1 and TAP2 [9, 10]. The potentially harmful consequence of proteasome deficiency appear to be partly compensated by the c‐Myc‐dependent up‐regulation of downstream proteases, such as the serine protease tripeptidyl peptidase (TPP)‐II, and deubiquitinating enzymes that are likely to prevent the accumulation of toxic Ub conjugates and may also alter the turnover of proteins involved in oncogenesis [11]. Using a proteomics approach based on covalent binding of ubiquitin‐trap probes followed by mass spectrometry, we have identified the ubiquitin C‐terminal hydrolase UCH‐L1 as the only DUB regularly overexpressed in tumour cell lines compared with immortalized lymphoblastoid cell lines (LCLs) derived by infection of normal B cells with Epstein–Barr virus (EBV) [12]. Furthermore, although UCH‐L1 was not detected in resting or mitogen‐induced T‐ or B‐blasts, a time course of EBV immortalization revealed a significant up‐regulation of the enzyme several weeks after exposure to the virus. Thus, expression of UCH‐L1 appears to be associated with the capacity for autonomous cell proliferation and with loosening of the tight homotypic adhesion that characterizes newly EBV infected B cells.
UCH‐L1, also known as PGP9.5, is physiologically expressed only in testis, ovary and neuronal cells. A spontaneous autosomal recessive UCH‐L1 deletion mutant, the gad mouse, shows axonal dystrophy and altered spermatogenesis [13], whereas mutations at or around the catalytic site of UCH‐L1 are associated with familial Parkinson’s disease [14] and other neurodegenerative disorders characterized by the formation of protein aggregates, such as spinocerebellar ataxia [15] and Huntington’s disease [16]. Abnormal expression of UCH‐L1 was also reported in a variety of human malignancies including neuroblastoma [17], colon carcinoma [18], non‐small‐cell‐lung carcinoma [19], pancreatic carcinoma [20], prostate and breast carcinomas [21, 22] and renal carcinoma [23]. High levels of the enzyme appear to be associated with the more invasive forms of these tumours but the physiological targets of UCH‐L1 and the mechanisms by which it may promote the malignant phenotype remain unknown.
In this investigation, we have addressed the significance of UCH‐L1 up‐regulation in BL‐ and EBV‐immortalized B lymphocytes. Using a combination of RNAi‐mediated UCH‐L1 knockdown in BL cells and overexpression of catalytically active or inactive variants of the enzyme in LCL cells, we demonstrate that UCH‐L1 promotes B‐cell proliferation and regulates B‐cell adhesion by modulating the affinity and avidity of the leukocyte integrin LFA‐1. Thus, UCH‐L1 appears to be an important player in the regulation of signalling pathways that promote the growth and invasive capacity of malignant B cells.
Materials and methods
Cell lines
The EBV‐negative BL lines BL28, Akata EBV–, and DG75, the EBV‐positive Namalwa, Akata EBV+ and Raji, and the EBV‐immortalized LCL CBM1‐ Ral‐STO (henceforth abbreviated as CBM), were cultured in RPMI 1640 medium supplemented with 2 mM L‐glutamine, 100 IU/ml penicillin, 100 μg/ml streptomycin and 10% heat‐inactivated FCS (complete medium). CBM expressing an HA epitope‐tagged UCH‐L1 or a catalytic inactive UCH‐L1C90S mutant were obtained by transfection with a pCEP4 plasmid containing the inserts followed by selection in the presence of 100 μg/ml Hygromycin B (Calbiochem, Germany).
Antibodies
Antibodies to UCH‐L1/PGP9.5 (polyclonal rabbit anti‐serum, 1:4000, Biomol, Plymouth Meeting, PA, USA), β‐actin (1:1000) (Santa Cruz Biotechnology, Santa Cruz, CA, USA), Flotillin‐2/ESA (Clone 29, 1:5000), LFA‐1 αL (Clone 27, 1:1000) (all from BD Transduction Laboratories, Franklin Lakes, NJ, USA), HA (12CA5, 1:12,000, Abcam, Cambridge, MA, USA) were used for Western blot analysis, together with the appropriate HRP‐conjugated goat‐antimouse or anti‐rabbit antibodies (both from Zymed, San Fransisco, CA, USA). Antibodies to LFA‐1 (IB4 directed to β2/CD18 and H12 directed to αL/CD11a, both from BectonDickinson, San Jose, CA, USA) were used for flow cytometric analysis.
Production of UCH‐L1 shRNA encoding lentiviruses
The oligonucleotides UCHL1‐i1 forward: 5′CCGGTGTGTACTTCATGAAGCAGACCCTCGAGGGTCTGCTTCATGA AGTACACTTTTTG3′ reverse: 5′AATTCA AAAAGTGTACTTCATGAAGCAGACC CTCGAGGGTCTGCTTCATGAAGTACA CA3′ directed to exon 4 and UCHL1‐i3 forward: 5′CCGGTGGATTTGAGGATGGATCAGTTCTCAGAAACTGATCCATCC TCAAATCCTTTTTG‐3′ and reverse: 5′AATTCAAAAAGGATTTGAGGATGGATC AGTTCTCAGAAACTGATCCATCCTCAAATCCA3′ directed towards a region spanning exon 4 and 5 were annealed and cloned into the AgeI and EcoRI sites of the pLKO.puro.1 plasmid containing the human U6 promoter. Lentivirus stocks were produced in 293T cells co‐transfected with the plasmids lent‐VSV‐G, lent‐PACK and pLKO.puro.1 containing the shRNA cassette at a 1:2:3 ratio using LipofectAMINE 2000 (Invitrogen, San Diego, CA, USA). Lentivirus carrying the empty backbone vector pLKO.puro.1 or expressing shRNA to TPPII, Bid or USP7/HAUSP were used as controls. The cells were plated at a density of 0.5 × 10⁶ per well in 6‐well plates and infected with 500 μl of virus stock for 2 hrs at 37°C. Transduced cells were selected in medium containing 5 μg/ml puromycin (Sigma, St. Louis, MO, USA) for 1 week before phenotypic and functional analysis.
Western blot
For quantification of protein levels, the cells were lysed in Nonidet‐P40 buffer (10 mM Tris‐HCl pH 7.5, 50 mM NaCl, 1 mM CaCl2, 1 mM MgCl2, 1% NP40) for 30 min. on ice. After boiling in NuPAGE® LDS sample buffer (Invitrogen), the samples were run on 7, 10, 12 or 4–12% Precast gels (Invitrogen) depending on protein size, and blotted onto 0.45 μm polyvinylidene difluoride (PVDF) membranes (Millipore, Billerica, MA, USA), followed by incubation for 1 hr in blocking buffer (5% milk in PBS‐0.1% Tween20). The membranes were incubated with primary antibodies diluted in blocking buffer for 1 hr, washed 4 × 5 min. in PBS with 0.1% Tween20, and further incubated for 1 hr with the appropriate secondary antibody diluted in blocking buffer. The conjugates were detected using ECL (Amersham Biosciences, Buckinghamshire, UK). The films were scanned and saved as TIFF files. Protein levels were quantified by densitometry using the Quantity One software (BioRad Laboratories Inc., Hercules, CA, USA).
DUB activity assay
Determination of DUB activity was performed using HAUb‐VME (vinylmethyl ester functionalized probe) as described [12]. Briefly, 107 cells were lysed by vortexing for 1 hr at 4°C in 80 μl of buffer containing 50 mM Tris pH 7.4, 5 mM MgCl2, 250 mM sucrose, 1 mM DTT, 1 mM ATP, and glass beads (106 μm, Sigma) at 1:3 vol:vol ratio. The lysates were clarified by centrifugation, and 20 μg of proteins were incubated with 1 μg of HAUb‐VME probe for 1 hr at 37°C. Active DUBs were detected by Western blot using the anti‐HA‐antibody.
Immunofluorescence and flow cytometry
The surface levels of B‐cell integrins and their ligands were investigated by immufluorescence and FACS analysis. The cells were stained for 30 min. on ice with fluorochrome conjugated antibodies, or for 30 min. on ice with primary unconjugated antibodies followed by 30 min. with the appropriate secondary fluorochrome conjugated antibody. After washing three times with PBS, the cells were fixed for 10 min. in 3.7% formaldehyde and analysed using a FACSort flow cytometer (Becton Dickinson, Sunnyvale, CA, USA) and the CELLQUEST software. Alternatively, the fixed cells were spun onto glass slides and mounted using Vectashield mounting medium containing DAPI (Vector Laboratories, Inc., Burlingame, CA, USA). Fluorescence was analysed using a Perkin Elmer Ultraview Axiovert 200M microscope (Zeiss, Germany) equipped with a Hamamatsu ORCA‐ER camera.
ICAM‐1 binding assay
Binding to a recombinant chimeric Fc‐ICAM‐1 was assayed as described [24]. Briefly, 96‐well Maxisorb plates (NUNC) were pre‐coated overnight at 4°C with 5 μg/ml Fc‐ICAM‐1 (R&D System) in coating buffer (20 mM Tris‐HCl and 150 mM NaCl, pH 8.2), followed by blocking for 1 hr at room temperature in coating buffer containing 1% BSA, and two washes in PBS. The cells were labelled for 1 hr at 37°C with 200 μCi Na51CrO4, washed twice and resuspended in assay buffer (20 mM HEPES, 150 mM NaCl2, 2 mg/ml glucose in ddH2O pH 7.4). Two ×105 cells in 100 μl were plated in triplicate wells of the Fc‐ICAM‐1‐coated plate and 5 mM Mg2+/1 mM EGTA was added to induced LFA‐1 activation. Where indicated cells were preincubated for 30 min. on ice with 20 μg/ml of the LFA‐1‐specific monoclonal antibody IB4. Following centrifugation for 5 min. at 2000 g, the plates were incubated for 90 min. at 37°C and the unbound cells were then removed by gently washing the plates four times with PBS. Bound cells were lysed using 1% Tween20 and radioactivity was measured using a γ‐counter (Wallac Wizard, Wallac Sweden). ICAM‐1‐independent binding was determined by adding cells to wells coated with 1% BSA and total radioactivity was determined by addition of 1% Tween20 to unwashed wells. The percentage of specific binding was calculated as: mean cpm in Fc‐ICAM‐1‐coated wells – mean cpm in BSA‐coated wells/mean total cpm – mean cpm in BSA‐coated wells.
Isolation of lipid rafts
Sucrose gradient floatation assays were performed as described by Fabbri et al.[25]. Twenty × 106 cells were washed in PBS and lysed on ice in 25 mM 2‐(N‐morpholino)ethanesulfonic acid, 150 mM NaCl, 1% Triton X‐100 (MBS buffer) and protease inhibitors (Complete Mini, Roche, Mannheim, Germany). The lysates were brought to a concentration of 40% sucrose and placed at the bottom of an SW41Ti ultracentrifuge tube (Sorvall). A step sucrose gradient (5–35% in MBS buffer) was layered on top of the lysates, and the samples were centrifuged at 39,000 rpm for 18–20 hrs in a Beckman SW41Ti Rotor. Thirteen 1‐ml fractions were harvested from the top of the gradient using the Auto Densi‐Flow (Labconco, Kansas City, MO, USA). The proteins were precipitated by adding trichloroacetic acid to a final concentration of 10%. The dry pellets were boiled in NuPage sample buffer and analysed by Western blot.
Assays of cell growth
Cell growth in suspension was monitored in cultures seeded at a concentration of 0.2 × 10⁶/ml. Viable cells were counted every second day by trypan‐blue exclusion. On day 5–6, the cultures were reseeded at the original cell density and the growth curve was continued for additional 6 days. Soft agar cloning was performed as described [26]. A bottom layer of 1.5 ml of melted 0.5% SeaPlaque Agarose (Cambrex, Karlskoga, Sweden) in complete medium was poured into 35 mm cell culture dishes with 2 mm grid (Nalge Nunc International, Rochester, NY, USA) and allowed to solidify for at least 2 hrs at room temperature. One 1‐ml top layer of melted 0.35% SeaPlaque Agar in complete medium containing 200 cells was added to triplicate dishes. The agar was allowed to solidify at room temperature and the dishes were placed in a humidified 5% CO2 incubator at 37°C for approximately 3 weeks, after which colonies of more then 50 live cells were scored as clones.
Results
UCH‐L1 enhances the proliferation of BL cells
The significance of UCH‐L1 up‐regulation was addressed by RNAi‐mediated silencing in a panel of EBV‐positive and ‐negative BL lines. Recombinant lentiviruses expressing shRNAs targeting two independent sites in the UCH‐L1 mRNA were used alongside with control viruses carrying the empty vector or expressing shRNA specific for other genes expressed in BL cells (e.g. USP7, TPPII, Bid). Representative Western blots illustrating the efficiency of UCH‐L1 knockdown in BL28, Namalwa and Raji are shown in Fig. 1A. More then 90% reduction of UCH‐L1 expression was consistently observed after selection of the transduced cells with puromicine for 1–2 weeks. Similar results were obtained in Ramos, BL41, DG75 and Akata (not shown). UCH‐L1 knockdown correlated with loss of the specific enzymatic activity as assessed by labelling of cell lysates with the HAUb‐VME functional probe (not shown). The two UCH‐L1‐specific shRNAs induced comparable inhibition of UCH‐L1 protein expression and enzymatic activity (not shown) and were therefore indifferently used in all experiments.
Figure 1.

UCH‐L1 expression promotes the proliferation of BL cells in suspension and semisolid agar. (A) Representative Western blots illustrating the expression of UCH‐L1 in untreated BL cells and BL cell transduced with a control lentivirus or a lentivirus expressing a specific UCH‐L1 shRNA. Total cell lysates were fractionated by SDS‐PAGE and the blots were probed with a UCH‐L1‐specific antibody. More than 90% reduction of the UCH‐L1‐specific band was regularly observed in the shRNA expressing cells. (B) Representative growth curves of control virus and UCH‐L1 shRNA transduced BL cells. The cells were seeded at a concentration of 2 × 10⁵/ml and number of viable cells was counted every other day by tripan blue dye exclusion. After 6 days, the cells were reseeded at the original cell concentration. The values represent the mean of three or more experiments performed with each cell line. (C) UCH‐L1 knockdown results in a 5‐ to 20‐fold decrease in the number of cells capable of forming colonies in semisolid agar. The mean percentage colony forming cells in three independent experiments performed with each cell line is shown in the figure. *P < 0.01 compared with uninfected and control virus infected cells. (D) UCH‐L1 knockdown is associated with increased levels of p27Kip1. Representative Western blots illustrating the expression of p27Kip1 p21 and c‐Myc in untreated (Parental), control virus (CV) and UCH‐L1 shRNA transduced cells. β‐actin served as a loading control. One representative experiment out of three performed with each combination of cell lines is shown in the figure.
The capacity for rapid growth in suspension cultures and the formation of colonies in semisolid agar are characteristic features of malignant lymphoid cells that correlate with loss of contact inhibition and metastatic potential [27]. Monitoring of cell growth in suspension cultures over a 2‐week period revealed that UCH‐L1 knockdown was associated with a reduction of cell recovery to approximately half of that observed in untreated cell or cell transduced with the control lentivirus (Fig. 1B). Furthermore, although up to 40% of BL cells either untreated or transduced with control lentivirus formed large colonies in semisolid agar (Fig. 1C), colony formation was reduced between 5‐ and 20‐fold in cells expressing the UCH‐L1 shRNA. The change in proliferative capacity in suspension and semisolid agar was reproducibly observed in both EBV‐positive and EBV‐negative cell lines. Growth retardation was regularly associated with up‐regulation of p27Kip1 (Fig. 1D), a known inhibitor of cyclin‐dependent kinases whose overexpression in human cells leads to G1 arrest [28], whereas the expression of p21 and c‐Myc was not affected.
UCH‐L1 inhibits LFA‐1‐dependent homotypic adhesion
In addition to its effect on cell proliferation, UCH‐L1 knockdown was accompanied by a dramatic change in the adhesive properties of BL cells. Although cells transduced with the control lentivirus retained the growth as single cells or small loose clumps that is characteristic of BL lines, loss of UCH‐L1 was accompanied by the formation of large cell clusters that were readily observed upon visual inspection of the flasks (Fig. 2A). The homotypic adhesion of lymphocytes is primarily controlled by the interaction of the αLβ2 integrin LFA‐1 with ICAM‐1 and is blocked by LFA‐1‐specific antibodies [29]. In order to investigate whether this molecular interaction is regulated by UCH‐L1, control and UCH‐L1 shRNA‐transduced BL cells were vigorously pipetted to dissolve the aggregates and single‐cell suspensions were cultured overnight in the presence of antibodies to LFA‐1 or isotype matched controls. Neither antibody affected the adhesion of cells transduced with the control lentivirus (Fig. 2B). In contrast, although large cell clusters were rapidly formed when the UCH‐L1 shRNA transduced cells were cultured in the presence of the control antibody, cell clumping was abrogated by the anti‐LFA‐1 antibody (Fig. 2B), confirming that this integrin is required for the increased adhesion induced by UCH‐L1. To investigate whether the enhanced adhesion might be due to changes in LFA‐1 expression, the total and surface levels of LFA‐1 were assayed by Western blot analysis and immunofluorescence. Representative Western blots, where the expression of LFA‐1 in control and UCH‐L1 knockdown BL cells were tested in parallel, are shown in Fig. 2C. There was no obvious correlation between the expression levels of UCH‐L1 and LFA‐1. Similar results were obtained when surface expression of LFA‐1 was assessed by immunofluorescence (Fig. 2D). The expression of ICAM‐1 and other molecules involved in B‐cell adhesion was also not affected (not shown).
Figure 2.

UCH‐L1 expression modulates LFA‐1‐dependent homotypic adhesion. (A) Representative micrographs illustrating the growth pattern of BL cells transduced with control or UCH‐L1‐shRNA lentiviruses. UCH‐L1 knockdown was associated with a dramatic increase in the capacity of BL cells to form large cell clusters, whereas cells transduced with the control virus did not differ significantly from the uninfected controls (not shown). Scale bar 100 μm. (B) The increased homotypic adhesion induced by UCH‐L1 knockdown is dependent on LFA‐1. Cell transduced with the UCH‐L1 shRNA lentivirus were incubated in the present of an LFA‐1‐specific antibody (lower panel). An irrelevant antibody of the same isotype was used as control (top panel). One representative experiment out of three is shown. (C) UCH‐L1 does not affect the expression levels of LFA‐1. Representative Western blot illustrating the expression of the αL chain of LFA‐1 in the BL lines DG45 and Raji and in cells transduced with control or UCH‐L1 shRNA lentiviruses. β‐actin served as a loading control. (D) UCH‐L1 does not affect the accumulation of LFA‐1 αL/β2 heterodimers at the cell surface. Representative FACS plots illustrating the surface expression of LFA‐1 as detected by immunofluorescence staining with an LFA‐1 αL‐specific antibody. The mean fluorescence intensity is indicated in each plot. One representative experiment out of at least three performed with each pair of control and UCH‐L1 shRNA transduced cells is shown in the figure.
The possibility that UCH‐L1 may affect the adhesive properties rather than the expression of LFA‐1 was addressed by testing the cation‐induced binding of LFA‐1 to ICAM‐1. In accordance with previous reports demonstrating the cation dependence of LFA‐1‐mediated adhesion in EBV‐immortalized LCLs, the binding of CBM cells to plates coated with a recombinant Fc‐ICAM‐1 fusion protein was strongly enhanced in the presence of Mg2+/EGTA (Fig. 3A, upper panels) and the effect was abrogated by addition of LFA‐1 blocking antibodies (Fig. 3B). Similar results were obtained with other LCL cells (not shown). In contrast, virtually no adhesion could be induced in BL lines, illustrated in Fig. 3A by the results obtained with Namalwa, suggesting that LFA‐1 is kept in an inactive conformation. UCH‐L1 knockdown (Fig. 3C, insert) was accompanied by a dramatic increase of Mg2+/EGTA‐induced binding of Namalwa to Fc‐ICAM‐1 (Fig. 3C). Similar results were obtained by UCH‐L1 knockdown in BL28 and Raji (not shown).
Figure 3.
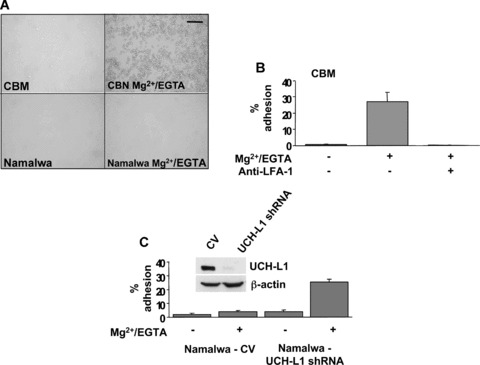
UCH‐L1 regulates the affinity of LFA‐1 for its ligand ICAM‐1. (A) Treatment with Mg2+/EGTA induces binding of LCL cells to Fc‐ICAM‐1‐coated plates (top panel) but does not affect the binding of BL cells (bottom panel). (B) The adhesion of CBM cell to Fc‐ICAM‐1‐coated plates is dependent on LFA‐1. Radioactively labelled CBM cells were incubated for 1 hr at 37°C in triplicate wells of Fc‐ICAM‐1‐coated 96‐well plates in the presence or absence of Mg2+/EGTA. Cells firmly adherent to the plates were then lysed and the readiocativity was measured in a γ‐counter. Where indicated, the cells were preincubated with LFA‐1‐specific or control antibodies for 30 min. at room temperature. Mean ± S.D. of specific binding in three independent experiments. (C) UCH‐L1 knockdown promotes the binding of BL cells to ICAM‐1‐coated plates. Binding of control and UCH‐L1 shRNA transduced Namalwa to Fc‐ICAM‐1‐coated plates in the presence or absence of Mg2+/EGTA. Mean ± S.D. of three independent experiments. UCH‐L1 knockdown was confirmed in Western blots probed with an UCH‐L1‐specific antibody (insert).
Clustering regulates the avidity of LFA‐1 for its ligands [30]. To investigate whether UCH‐L1 expression influences the distribution of LFA‐1 in the cell membrane, control and UCH‐L1 knockdown cells were stained with antibodies specific for the LFA‐1 αL or β2 chains and the pattern of staining was analysed by confocal microscopy. Similar results were obtained with both antibodies. As illustrated by the representative micrographs obtained by combining different cell layers shown in Fig. 4A, LFA‐1 appeared as small fluorescent dots evenly distributed throughout the cell membrane in uninfected (not shown) and control virus infected BL cells (Fig. 4A left panel), whereas upon UCH‐L1 knockdown LFA‐1 was found in larger clusters that were often localized to one side of the cell or only on protrusions (Fig. 4A right panel). The effect was quantified by scoring the pattern of LFA‐1 staining in at least three independent experiments performed with the DG75 and Raji cell lines. As shown in Fig. 4B, the percentage of cells with clustered LFA‐1 staining was increased between two‐ and four‐fold in cells expressing UCH‐L1 shRNA compared with control lentivirus transduced cells.
Figure 4.
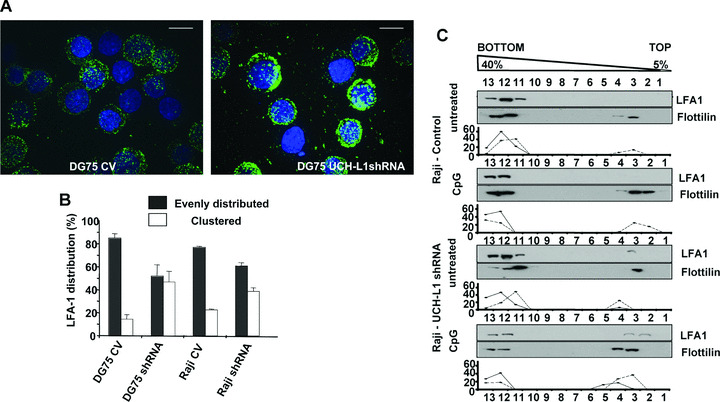
UCH‐L1 regulates the distribution of LFA‐1 in the cell membrane. (A) Representative immunofluorescence micrographs illustrating the surface distribution of LFA‐1 in BL cells transduced with control or UCH‐L1 shRNA lentiviruses. The cells were stained with an antibody specific to the αL chain of LFA‐1 and the nuclei were stained with DAPI. (B) Analysis of LFA‐1 membrane distribution in BL cells transduced with control UCH‐L1 shRNA lentiviruses. The membrane distribution of LFA‐1 was visually assessed in at least 100 cells per each slide. Mean ± S.D. of at least three experiments performed with each pair of cell lines. (C) UCH‐L1 knockdown results in spontaneous relocalization of LFA‐1 to lipid rafts. The distribution of LFA‐1 was examined by sucrose gradient flotation assays in untreated and CpG DNA treated Raji cells transduced with control or UCH‐L1 shRNA lentiviruses. LFA‐1 was detected by probing Western blots of each fraction with αL chain‐specific antibodies. Flotillin was used as a marker for lipid rafts. The percentage of Flotillin and LFA‐1 recovered in each fraction is plotted below each blot. One representative experiment out of three is shown in the figure.
Integrin clusters are localized in membrane micro‐domains known as lipid rafts [25]. To investigate whether UCH‐L1 expression influences this property of LFA‐1, flotation assays were performed in BL cells untreated or treated with the TLR9 ligand CpG DNA that induces strong LFA‐1‐dependent adhesion in B cells [31]. The distribution of the raft resident protein flotillin‐2 was used as control. As illustrated by the representative experiment shown in Fig. 4C, LFA‐1 was not detected in lipid rafts isolated from Raji cells transduced with the control lentivirus, either untreated or treated with CpG DNA, confirming that the LFA‐1 expressed in these cells is in an inactive conformation. In contrast, a small but sizable fraction (≈ 5%) of LFA‐1 was found in lipid rafts isolated from UCH‐L1 shRNA‐transduced cells in the absence of any treatment and the amount was increased (up to 30% depending on the experiment) upon treatment with CpG DNA. Thus, UCH‐L1 appears to inhibit LFA‐1‐dependent adhesion in B lymphocytes by regulating both the affinity and avidity of LFA‐1 for its ligand ICAM‐1.
The small GTPases Rap1 and Rac1 play critical roles in the regulation of LFA‐1‐dependent adhesion [32]. To investigate whether UCH‐L1 expression affects the activity of these GTPases, the endogenous levels of Rap1GTP and Rac1GTP were measured in control and UCH‐L1 knockdown BL cells by affinity purification assays. As illustrated by the representative experiments shown in Fig. 5A, the total levels of Rap1 and Rac1 were not affected by UCH‐L1 knockdown in DG75 and Namalwa, whereas the proportion of activated Rap1GTP and Rac1GTP was significantly increased. The increase varied between three‐ and five‐fold, depending on the cell lines (Fig. 5B).
Figure 5.

UCH‐L1 knockdown leads to constitutive activation of Ras family GTPases. (A) The endogenous levels of activated Rac1 and Rap1 are increased upon UCH‐L1 knockdown. Activated Rac1GTP and Rap1GTP were affinity purified using as baits GST‐PBD and GST‐RalGDS, respectively, and Western blots of equal amounts of total and purified cell lysates were probed with Rac1‐ and Rap1‐specific antibodies. HeLa cells treated with CNF served as control for Rac1 activation. One representative experiment, where DG75 and Namalwa cells transduced with control and UCH‐L1 shRNA lentiviruses were tested in parallel, is shown in the figure. (B) Quantification of the Rac1GTP and Rap1GTP levels in a panel of BL lines. The percentage of Rac1GTP and Rap1GTP were calculated relative to the total input and the fold induction was calculated as the ratio between as the percentage Rac1GTP and Rap1GTP in UCH‐L1 knockdown versus control virus transduced cells. Mean ± S.D. of three to six experiments performed with each cell pair.
The enzymatic activity of UCH‐L1 is required for its effects
In order to investigate whether the enzymatic activity of UCH‐L1 is required for its capacity to promote cell growth and inhibit cell adhesion we took advantage of the finding that the CBM cells do not express detectable levels of endogenous UCH‐L1 as assessed by Western blot and labelling of cell lysates with the HAUb‐VME functional probe (Fig. 6A). CBM sublines stably expressing the wild‐type UCH‐L1 or an inactive enzyme, where the catalytic Cys90 residue was substituted with Ser (UCH‐L1‐C90S), were generated by transfection. In accordance with the effect of UCH‐L1 on the proliferation of BL cells, expression of UCH‐L1 was associated with enhanced cell proliferation, whereas the catalytic mutant UCH‐L1‐C90S had no significant effect (Fig. 6B). Furthermore, although untransfected (not shown) and vector‐transfected CBM cells grow in large and very tight cell clusters (Fig. 5C), CBM‐UCH‐L1 cells formed small clumps that could be easily dissolved by gentle shaking of the flasks. This effect was dependent on the catalytic activity of UCH‐L1 as CBM expressing the UCH‐L1‐C90S mutant behaved like the parental cell line and formed tight cell clusters (Fig. 6C). In accordance with its effect of cell adhesion, UCH‐L1 expression was associated with significant reduction of the affinity of LFA‐1 for ICAM‐1, as assessed by Mg2+/EGTA‐induced binding to Fc‐ICAM‐1‐coated plates (Fig. 7A), and with changes in pattern for surface LFA‐1 staining, that became more similar to that observed in BL cells (compare Fig. 4A and B with Fig. 7B and C) and in the levels of activated Rap1GTP (Fig. 7D) and Rac1GTP (not shown).
Figure 6.

The enzymatic activity of UCH‐L1 is required for its effect on B‐cell proliferation and homotypic adhesion. (A) Expression and activity of UCH‐L1 and catalytically inactive UCH‐L1 C90S mutant in stably transfected CBM cells. UCH‐L1 expression was detected in Western blots probed with a UCH‐L1‐specific antibody (lower panel). The enzymatic activity was assessed by labelling the cell lysates with the HA‐Ub‐VME functional probe followed by detection of the labelled DUBs with antibodies specific for the HA tag (upper panel). Identification of the labelled DUBs was done based on the molecular mass of the polypeptides and previous characterization by mass spectrometry. (B) Expression of a catalytically active UCH‐L1 enhances the proliferation capacity of CBM cells. Representative growth curves of CBM parental cells and CBM cells transfected with the wild‐type UCH‐L1 or the UCH‐L1 C90S catalytic mutant. The growth curves were performed as described in the legend to Fig. 1. One representative experiment out of three is shown in the figure. (C) Stable expression of a catalytically active UCH‐L1 decreased the homotypic adhesion in CBM cells, whereas the UCH‐L1‐C90S had no effect. Pictures of cells cultured overnight at a concentration of 5 × 10⁵/ml in serum‐free medium were taken with an inverted light microscope equipped with a cooled CCD camera using 10× and 4× objectives.
Figure 7.

UCH‐L1 inhibits the activation and membrane relocalization of LFA‐1 in LCL cells. (A) Expression of UCH‐L1 inhibits the Mg2+/EDTA‐induced binding of CBM cells to Fc‐ICAM‐1‐coated plates. The percentage of CBM and CBM‐UCH‐L1 cells bound to Fc‐ICAM‐1‐coated plates in the presence or absence of Mg2+/EGTA is shown in the figure. Mean ± S.D. of three experiments. The expression of UCH‐L1 was confirmed by Western blot (insert). (B) Expression of UCH‐L1 expression prevents the clustering of LFA‐1. Representative immunofluorescence micrographs illustrating the distribution of LFA‐1 in the cell membrane of control and UCH‐L1‐transfected CBM cells. The cells were stained with an antibody specific to the αL subunit of LFA‐1 and the nuclei were stained with DAPI. (C) LFA‐1 membrane distribution in vector and UCH‐L1‐transfected CBM cells. The membrane distribution of LFA‐1 was visually assessed in at least 100 cells per each slide. Mean ± S.D. of three experiments where the cell lines were tested in parallel. (D) Representative experiment illustrating the decrease of endogenous levels of Rap1GTP in UCH‐L1‐transfected cells. Rap1GTP was pooled down from equal amount of cell lysates using GST‐RalGDS and Western blots were probed with an anti‐Rap1 antibody.
Discussion
Previous reports have described a selective up‐regulation of the ubiquitin C‐terminal hydrolase UCH‐L1 in a variety of metastatic tumours but the biological functions of this enzyme and the mechanism by which it may contribute to the malignant phenotype have remained enigmatic. Here we report on a previously unidentified function of UCH‐L1 and show that the expression of a catalytically active enzyme regulates the proliferative capacity of malignant B cell and their interaction with the surrounding cells and stroma by controlling the activation of the leukocyte integrin LFA‐1. These effects were highly reproducible and were observed in a large panel of BL lines independently of their EBV carrier status. This, together with the observation that overexpression of the enzyme in EBV‐immortalized B cells is accompanied by increased proliferation and decreased homotypic adhesion, indicates that UCH‐L1 controls basic features of the malignant phenotype.
We have found that inhibition of UCH‐L1 expression by RNAi is accompanied by a significantly reduced proliferation of BL cells in suspension and semisolid agar. The effect on the formation of colonies from a single cell precursor is particularly interesting, because this is regarded as a property of tumour stem cells that correlates with malignancy and metastatic potential. The inhibition of cell growth induced by UCH‐L1 knockdown was associated with a selective increase in the steady state levels of the CDK inhibitor p27Kip1 (Fig. 1), which also correlated with a partial cell cycle arrest as demonstrated by a small but reproducible accumulation of cells in the GO/G1 phase of the cell cycle (not shown). The finding, that a catalytically active UCH‐L1 induces rapid proliferation in the UCH‐L1‐negative LCL CBM (Fig. 7), further supports the involvement of this enzyme in the regulation of B‐cell proliferation.
To date, there are no identified substrates for UCH‐L1 and the mechanism by which it may influence p27Kip1 expression and cell growth is, therefore, unclear. One interesting possibility is suggested by the finding that UCH‐L1 interacts with the Jun activation domain‐binding protein (Jab)‐1 [33], a component of the COP9 signalosome that activates Jun and promotes the cytoplasmic translocation of p27Kip1[34]. Jab1 may stabilize p27Kip1 by de‐Neddylating CUL1, which inactivates the SCFSkp2 ubiquitin ligase (CUL1/Rox/Skp2) that specifically targets p27Kip1[35]. Interestingly, Jab1 interacts also with the cytoplasmic tail of LFA‐1 and is rapidly relocated to the nucleus upon triggering of the integrin by monoclonal antibodies or binding to ICAM‐1‐coated plates [36]. Thus, Jab1 could promote p27Kip1 stabilization in response to integrin activation. This scenario is substantiated by the recent findings of Lwin et al. who reported that cell adhesion induces p27Kip1‐associated cell‐cycle arrest in mantle‐cell and other non‐Hodgkin B‐cell lymphomas via inactivation of the SCFSkp2 ligase [37]. UCH‐L1 could influence this pathway by acting directly on Jab1 and/or by controlling the activation state of integrins. A blockade of LFA‐1 activation by UCH‐L1 could prevent Jab1 translocation and thus allow efficient degradation of p27Kip1. Indeed, we have found that loss of UCH‐L1 is associated with a dramatic increase of LFA‐1‐dependent adhesion in BL cells and accumulation of p27Kip1 (Fig. 2), whereas stable transfection of a catalytically active UCH‐L1 inhibits homotypic adhesion in the UCH‐L1‐negative LCL CBM (Fig. 6). The effect of UCH‐L1 on cells adhesion was not due to detectable changes in the total or surface levels of LFA‐1 (Fig. 2) and was instead associated with changes in the affinity of binding of LFA‐1 to its ligand ICAM‐1 (Figs 3 and 7), and with spontaneous relocalization of LFA‐1 into lipid rafts (Figs 4 and 7). In line with the known involvement of the Ras family GTPases in the regulation of integrin activation and signalling, two members of the family, Rap1 and Rac1, were found to be constitutively activated following UCH‐L1 knockdown in BL cells (Fig. 4), whereas expression of UCH‐L1 was associated with a significant decrease of the endogenous levels of activated Rap1 in CBM cells (Fig. 7). These findings are consistent with the possibility that UCH‐L1 may be involved in maintaining LFA‐1 in a state of low affinity/avidity that prevents homotypic adhesion.
The activation of integrins involves a complex cascade of events that are triggered by both extracellular and intracellular signals. These induce conformational changes of the integrin heterodimer, leading to enhanced affinity, and clustering of the activated molecules, which regulates the avidity of integrins for their ligands (reviewed in [38]). Early events in this process include the release of the integrin from their cytoskeletal anchor, which allows their redistribution to ligand‐independent nanoclusters [39], and the internalization of integrins into an early endocytic compartment where the conformational changes required for enhanced affinity are likely to occur [40]. Cytoskeletal remodelling as well as endocytosis and recycling of membrane receptors are critically regulated by mono‐ and polyubiquitination [41]. It seems plausible that the enzymatic activity of UCH‐L1 may be required to regulate the turnover of such modifications, either on the integrins themselves, or on one or more components of their activation/inactivation pathways. For example, the Casitas B‐lineage Lymphoma (Cbl)‐b ubiquitin ligase, a negative regulator of LFA‐1 activation in lymphoid cells and mononuclear phagocytes [42, 43], is itself ubiquitinated by HECT family E3 ubiquitin ligases and hence targeted for proteasomal degradation [44]. Thus, deubiquitination of Cbl‐b by UCH‐L1 could promote its stabilization and consequently inhibit LFA‐1 activation. This possibility is currently under investigation.
The lack of information on its physiological substrates is a major obstacle in dissecting the mechanism of action of UCH‐L1. The capacity to hydrolyse polyubiquitin precursors and small Ub adducts is the only experimentally confirmed enzymatic activity of UCH‐L1 [45]. High expression of the enzyme was shown to be associated with increased levels of free Ub in neurons but a catalytically inactive mutant had a similar effect [46]. The failure to identify putative UCH‐L1 substrates is likely to be explained by the requirement of specific modification or co‐factors that may regulate its activity. Indeed, the crystal structure of UCH‐L1 has revealed a distorted and inaccessible catalytic site, suggesting that a major conformational rearrangement is required to activate the enzyme [47]. A possible mechanism of activation was recently proposed in a study where monoubiquitination and auto‐deubiquitination were shown to affect UCH‐L1 activity, perhaps by regulating protein–protein interaction [48]. In addition, UCH‐L1 activity is also regulated by other post‐translational modifications, such as O‐glycosylation [49] and oxidation that appear to be a major cause of UCH‐L1 inactivation in the brain of Alzheimer’s and Parkinson’s disease patients [50]. A precise characterization of the significance of these modifications for the activity of UCH‐L1 in vitro and in vivo will be required to fully understand the mechanism of action of UCH‐L1 and its role in disease.
In conclusion, our finding that UCH‐L1 expression in malignant B lymphocytes is associated with enhanced proliferation and decreased cell adhesion highlights an interesting aspect of the activity of this still mysterious enzyme and provides a new focus for the identification of its putative substrates and mechanisms of action. The involvement of UCH‐L1 in a variety of neurodegenerative disorders has promoted intensive work aiming to identify small molecules that may specifically modulate its activity in vivo. Our results suggest that such small molecules could be potentially useful as anti‐cancer drugs.
Acknowledgements
We wish to thank Sheila Stewart, Manuel Patarroyo, Hans Wigzell, Huib Ovaa and Michael Gold for sharing reagents and experimental protocols. This investigation was supported by grants awarded by the Swedish Research Council, the Swedish Cancer Foundation, the Karolinska Institute, Stockholm Sweden, the Association for International Cancer Research, Edinburgh, UK and the European Community Network of Excellence RUBICON Project no. LSHC‐CT‐2005‐018683.
References
- 1. Ciechanover A, Schwartz AL. The ubiquitin system: pathogenesis of human diseases and drug targeting. Biochim Biophys Acta . 2004; 1695: 3–17. [DOI] [PubMed] [Google Scholar]
- 2. Love KR, Catic A, Schlieker C, et al. Mechanisms, biology and inhibitors of deubiquitinating enzymes. Nat Chem Biol . 2007; 3: 697–705. [DOI] [PubMed] [Google Scholar]
- 3. Nijman SM, Luna‐Vargas MP, Velds A, et al. A genomic and functional inventory of deubiquitinating enzymes. Cell . 2005; 123: 773–86. [DOI] [PubMed] [Google Scholar]
- 4. Brady G, MacArthur GJ, Farrell PJ. Epstein‐Barr virus and Burkitt lymphoma. J Clin Pathol . 2007; 60: 1397–402. [DOI] [PMC free article] [PubMed] [Google Scholar]
- 5. Masucci MG. Epstein‐Barr virus oncogenesis and the ubiquitin‐proteasome system. Oncogene . 2004; 23: 2107–15. [DOI] [PubMed] [Google Scholar]
- 6. Rowe M, Rowe DT, Gregory CD, et al. Differences in B cell growth phenotype reflect novel patterns of Epstein‐Barr virus latent gene expression in Burkitt’s lymphoma cells. EMBO J . 1987; 6: 2743–51. [DOI] [PMC free article] [PubMed] [Google Scholar]
- 7. Masucci MG, Torsteindottir S, Colombani J, et al. Down‐regulation of class I HLA antigens and of the Epstein‐Barr virus‐encoded latent membrane protein in Burkitt lymphoma lines. Proc Natl Acad Sci USA . 1987; 84: 4567–71. [DOI] [PMC free article] [PubMed] [Google Scholar]
- 8. Frisan T, Zhang QJ, Levitskaya J, et al. Defective presentation of MHC class I‐restricted cytotoxic T‐cell epitopes in Burkitt’s lymphoma cells. Int J Cancer . 1996; 68: 251–8. [DOI] [PubMed] [Google Scholar]
- 9. Rowe M, Khanna R, Jacob CA, et al. Restoration of endogenous antigen processing in Burkitt’s lymphoma cells by Epstein‐Barr virus latent membrane protein‐1: coordinate up‐regulation of peptide transporters and HLA‐class I antigen expression. Eur J Immunol . 1995; 25: 1374–84. [DOI] [PubMed] [Google Scholar]
- 10. Frisan T, Levitsky V, Masucci MG. Variations in proteasome subunit composition and enzymatic activity in B‐lymphoma lines and normal B cells. Int J Cancer . 2000; 88: 881–8. [DOI] [PubMed] [Google Scholar]
- 11. Gavioli R, Frisan T, Vertuani S, et al. c‐myc overexpression activates alternative pathways for intracellular proteolysis in lymphoma cells. Nat Cell Biol . 2001; 3: 283–8. [DOI] [PubMed] [Google Scholar]
- 12. Ovaa H, Kessler BM, Rolen U, et al. Activity‐based ubiquitin‐specific protease (USP) profiling of virus‐infected and malignant human cells. Proc Natl Acad Sci USA . 2004; 101: 2253–8. [DOI] [PMC free article] [PubMed] [Google Scholar]
- 13. Saigoh K, Wang YL, Suh JG, et al. Intragenic deletion in the gene encoding ubiquitin carboxy‐terminal hydrolase in gad mice. Nat Genet . 1999; 23: 47–51. [DOI] [PubMed] [Google Scholar]
- 14. Liu Y, Fallon L, Lashuel HA, et al. The UCH‐L1 gene encodes two opposing enzymatic activities that affect alpha‐synuclein degradation and Parkinson’s disease susceptibility. Cell . 2002; 111: 209–18. [DOI] [PubMed] [Google Scholar]
- 15. Fernandez‐Funez P, Nino‐Rosales ML, de Gouyon B, et al. Identification of genes that modify ataxin‐1‐induced neurodegeneration. Nature . 2000; 408: 101–6. [DOI] [PubMed] [Google Scholar]
- 16. Naze P, Vuillaume I, Destee A, et al. Mutation analysis and association studies of the ubiquitin carboxy‐terminal hydrolase L1 gene in Huntington’s disease. Neurosci Lett . 2002; 328: 1–4. [DOI] [PubMed] [Google Scholar]
- 17. Yanagisawa TY, Sasahara Y, Fujie H, et al. Detection of the PGP9.5 and tyrosine hydroxylase mRNAs for minimal residual neuroblastoma cells in bone marrow and peripheral blood. Tohoku J Exp Med . 1998; 184: 229–40. [DOI] [PubMed] [Google Scholar]
- 18. Yamazaki T, Hibi K, Takase T, et al. PGP9.5 as a marker for invasive colorectal cancer. Clin Cancer Res . 2002; 8: 192–5. [PubMed] [Google Scholar]
- 19. Sasaki H, Yukiue H, Moriyama S, et al. Expression of the protein gene product 9.5, PGP9.5, is correlated with T‐status in non‐small cell lung cancer. Jpn J Clin Oncol . 2001; 31: 532–5. [DOI] [PubMed] [Google Scholar]
- 20. Tezel E, Hibi K, Nagasaka T, et al. PGP9.5 as a prognostic factor in pancreatic cancer. Clin Cancer Res . 2000; 6: 4764–7. [PubMed] [Google Scholar]
- 21. Aumuller G, Renneberg H, Leonhardt M, et al. Localization of protein gene product 9.5 immunoreactivity in derivatives of the human Wolffian duct and in prostate cancer. Prostate . 1999; 38: 261–7. [DOI] [PubMed] [Google Scholar]
- 22. Schumacher U, Mitchell BS, Kaiserling E. The neuronal marker protein gene product 9.5 (PGP 9.5) is phenotypically expressed in human breast epithelium, in milk, and in benign and malignant breast tumors. DNA Cell Biol . 1994; 13: 839–43. [DOI] [PubMed] [Google Scholar]
- 23. D’Andrea V, Malinovsky L, Berni A, et al. The immunolocalization of PGP 9.5 in normal human kidney and renal cell carcinoma. G Chir . 1997; 18: 521–4. [PubMed] [Google Scholar]
- 24. Berendt AR, McDowall A, Craig AG, et al. The binding site on ICAM‐1 for Plasmodium falciparum‐infected erythrocytes overlaps, but is distinct from, the LFA‐1‐binding site. Cell . 1992; 68: 71–81. [DOI] [PubMed] [Google Scholar]
- 25. Fabbri M, Di Meglio S, Gagliani MC, et al. Dynamic partitioning into lipid rafts controls the endo‐exocytic cycle of the alphaL/beta2 integrin, LFA‐1, during leukocyte chemotaxis. Mol Biol Cell . 2005; 16: 5793–803. [DOI] [PMC free article] [PubMed] [Google Scholar]
- 26. Torsteinsdottir S, Andersson ML, Avila‐Carino J, et al. Reversion of tumorigenicity and decreased agarose clonability of an IgH/myc translocation carrying BL line. Int J Cancer . 1989; 43: 273–8. [DOI] [PubMed] [Google Scholar]
- 27. Frazier ME, Ushijima RN, Andrews TK, et al. Comparative studies on cell lines established from normal and radiation‐exposed miniature swine. In Vitro . 1979; 15: 1001–12. [DOI] [PubMed] [Google Scholar]
- 28. Polyak K, Lee MH, Erdjument‐Bromage H, et al. Cloning of p27Kip1, a cyclin‐dependent kinase inhibitor and a potential mediator of extracellular antimitogenic signals. Cell . 1994; 78: 59–66. [DOI] [PubMed] [Google Scholar]
- 29. Mentzer SJ, Gromkowski SH, Krensky AM, et al. LFA‐1 membrane molecule in the regulation of homotypic adhesions of human B lymphocytes. J Immunol . 1985; 135: 9–11. [PubMed] [Google Scholar]
- 30. van Kooyk Y, van Vliet SJ, Figdor CG. The actin cytoskeleton regulates LFA‐1 ligand binding through avidity rather than affinity changes. J Biol Chem . 1999; 274: 26869–77. [DOI] [PubMed] [Google Scholar]
- 31. Bernasconi NL, Traggiai E, Lanzavecchia A. Maintenance of serological memory by polyclonal activation of human memory B cells. Science . 2002; 298: 2199–202. [DOI] [PubMed] [Google Scholar]
- 32. de Bruyn KM, Rangarajan S, Reedquist KA, et al. The small GTPase Rap1 is required for Mn(2+)‐ and antibody‐induced LFA‐1‐ and VLA‐4‐mediated cell adhesion. J Biol Chem . 2002; 277: 29468–76. [DOI] [PubMed] [Google Scholar]
- 33. Caballero OL, Resto V, Patturajan M, et al. Interaction and colocalization of PGP9.5 with JAB1 and p27(Kip1). Oncogene . 2002; 21: 3003–10. [DOI] [PubMed] [Google Scholar]
- 34. Tomoda K, Kubota Y, Kato J. Degradation of the cyclin‐dependent‐kinase inhibitor p27Kip1 is instigated by Jab1. Nature . 1999; 398: 160–5. [DOI] [PubMed] [Google Scholar]
- 35. Wu K, Chen A, Pan ZQ. Conjugation of Nedd8 to CUL1 enhances the ability of the ROC1‐CUL1 complex to promote ubiquitin polymerization. J Biol Chem . 2000; 275: 32317–24. [DOI] [PubMed] [Google Scholar]
- 36. Bianchi E, Denti S, Granata A, et al. Integrin LFA‐1 interacts with the transcriptional co‐activator JAB1 to modulate AP‐1 activity. Nature . 2000; 404: 617–21. [DOI] [PubMed] [Google Scholar]
- 37. Lwin T, Hazlehurst LA, Dessureault S, et al. Cell adhesion induces p27Kip1‐associated cell‐cycle arrest through down‐regulation of the SCFSkp2 ubiquitin ligase pathway in mantle‐cell and other non‐Hodgkin B‐cell lymphomas. Blood . 2007; 110: 1631–8. [DOI] [PMC free article] [PubMed] [Google Scholar]
- 38. Hogg N, Henderson R, Leitinger B, et al. Mechanisms contributing to the activity of integrins on leukocytes. Immunol Rev . 2002; 186: 164–71. [DOI] [PubMed] [Google Scholar]
- 39. Cambi A, Joosten B, Koopman M, et al. Organization of the integrin LFA‐1 in nanoclusters regulates its activity. Mol Biol Cell . 2006; 17: 4270–81. [DOI] [PMC free article] [PubMed] [Google Scholar]
- 40. Pellinen T, Ivaska J. Integrin traffic. J Cell Sci . 2006; 119: 3723–31. [DOI] [PubMed] [Google Scholar]
- 41. Kirkin V, Dikic I. Role of ubiquitin‐ and Ubl‐binding proteins in cell signaling. Curr Opin Cell Biol . 2007; 19: 199–205. [DOI] [PubMed] [Google Scholar]
- 42. Zhang W, Shao Y, Fang D, et al. Negative regulation of T cell antigen receptor‐mediated Crk‐L‐C3G signaling and cell adhesion by Cbl‐b. J Biol Chem . 2003; 278: 23978–83. [DOI] [PubMed] [Google Scholar]
- 43. Choi EY, Orlova VV, Fagerholm SC, et al. Regulation of LFA‐1‐dependent inflammatory cell recruitment by Cbl‐b and 14–3‐3 proteins. Blood . 2008; 111: 3607–14. [DOI] [PMC free article] [PubMed] [Google Scholar]
- 44. Magnifico A, Ettenberg S, Yang C, et al. WW domain HECT E3s target Cbl RING finger E3s for proteasomal degradation. J Biol Chem . 2003; 278: 43169–77. [DOI] [PubMed] [Google Scholar]
- 45. Larsen CN, Price JS, Wilkinson KD. Substrate binding and catalysis by ubiquitin C‐terminal hydrolases: identification of two active site residues. Biochem . 1996; 35: 6735–44. [DOI] [PubMed] [Google Scholar]
- 46. Osaka H, Wang YL, Takada K, et al. Ubiquitin carboxy‐terminal hydrolase L1 binds to and stabilizes monoubiquitin in neuron. Hum Mol Genet . 2003; 12: 1945–58. [DOI] [PubMed] [Google Scholar]
- 47. Das C, Hoang QQ, Kreinbring CA, et al. Structural basis for conformational plasticity of the Parkinson’s disease‐associated ubiquitin hydrolase UCH‐L1. Proc Natl Acad Sci USA . 2006; 103: 4675–80. [DOI] [PMC free article] [PubMed] [Google Scholar]
- 48. Meray RK, Lansbury PT Jr. Reversible monoubiquitination regulates the Parkinson disease‐associated ubiquitin hydrolase UCH‐L1. J Biol Chem. 2007; 282: 10567–75. [DOI] [PubMed] [Google Scholar]
- 49. Cole RN, Hart GW. Cytosolic O‐glycosylation is abundant in nerve terminals. J Neurochem . 2001; 79: 1080–9. [DOI] [PubMed] [Google Scholar]
- 50. Choi J, Levey AI, Weintraub ST, et al. Oxidative modifications and down‐regulation of ubiquitin carboxyl‐terminal hydrolase L1 associated with idiopathic Parkinson’s and Alzheimer’s diseases. J Biol Chem . 2004; 279: 13256–64. [DOI] [PubMed] [Google Scholar]