

Abstract
The proinflammatory chemokine interleukin 8 exerts potent angiogenic effects on endothelial cells by interacting with its receptors CXCR1 and CXCR2. As thrombin is also a potent inflammatory factor, and as endothelial progenitor cells (EPC) express functional PAR‐1 thrombin receptor, we examined whether PAR‐1 stimulation interferes with the IL‐8 pathway in EPC. EPC were obtained from adult blood (AB) and cord blood (CB). The effect of PAR‐1 stimulation by the peptide SFLLRN on IL‐8, CXCR1 and CXCR2 expression was examined by RTQ‐PCR and at the protein level in AB and CB late EPC and in AB early EPC. Specific siRNA was used to knock down PAR‐1 expression. The IL‐8 gene was expressed strongly in AB early EPC and moderately in late EPC. In contrast, CXCR1 and CXCR2 gene expression was restricted to AB early EPC. The IL‐8 level in AB early EPC conditioned medium was high in basal conditions and did not change after PAR‐1 activation. By contrast, IL‐8 secretion by late EPC was low in basal conditions and strongly up‐regulated upon PAR‐1 activation. PAR‐1 activation induced a number of genes involved in activating protein‐1 (AP‐1) and nuclear factor (NF)‐κB pathways. Conditioned medium of PAR‐1‐activated late EPC enhanced the migratory potential of early EPC, and this effect was abrogated by blocking IL‐8. Target‐specific siRNA‐induced PAR‐1 knockdown, and fully inhibited PAR‐1‐induced IL‐8 synthesis. In conclusion, PAR‐1 activation induces IL‐8 synthesis by late EPC. This could potentially enhance cooperation between late and early EPC during neovascularization, through a paracrine effect.
Keywords: endothelial progenitor cells, interleukin 8, thrombin, PAR‐1, siRNA
Introduction
Interleukin‐8 (IL‐8 or CXCL8) was initially identified as a major proinflammatory cytokine. IL‐8 is an ELR (Glu‐Leu‐Arg) motif‐positive (ELR+) CXC chemokine [1] that has direct angiogenic effects on mature endothelial cells in vitro and in vivo[2, 3, 4]. Blockade of IL‐8 activity inhibits angiogenesis, metastasis and tumour progression in mouse xenograft models [3, 5, 6]. Moreover, IL‐8 is strongly expressed in cancer patients [7]. The biological activity of IL‐8 is mediated by its binding to two closely related receptors, CXCR1 and CXCR2, on target cells. The chemokine receptor CXCR2 binds all known angiogenic ELR+ CXC chemokines, including IL‐8 [1], while CXCR1 specifically binds IL‐8 and GCP‐2 [1]. CXCR1 and CXCR2 expression by cultured endothelial cells, in terms of messenger RNA (mRNA) and functional protein expression, is controversial [8].
Endothelial progenitor cells (EPC) have a unique ability to repair vessel damage and to promote neovascularization, but the underlying molecular mechanisms are poorly understood (for review [9]). Several studies have shown significant heterogeneity among EPC populations. At least two types of EPC have been described [10]. ‘Early’ EPC appear within 4–7 days of culture, are spindle‐shaped and express both endothelial (von Willebrand factor) and monocytic (CD14) markers, whereas ‘late’ EPC (also called endothelial colony forming cells, or ECFC) develop after 2–3 weeks of culture and have the characteristics of precursor cells committed to the endothelial lineage, witha cobblestone appearance and long‐term proliferative potential [11]. Both early and late human EPC contribute to vasculogenesis in various preclinical models of ischaemia [10, 12]. In these latter experiments, mixed transplantation of the two types of EPC resulted in synergistic neovascularization, notably through IL‐8 secretion [12]. Moreover, late EPC secrete significantly higher levels of IL‐8 than mature endothelial cells, giving them mitogenic potential [13]. Finally, IL‐8 and inflammation, respectively, have been implicated in EPC mobilization during acute myocardial infarction [14, 15] and after angioplasty for chronic lower limb ischaemia [16].
Another inflammatory mediator, thrombin, plays a key role in platelet and coagulation activation and is also involved in angiogenesis. The main thrombin receptor on vascular cells and platelets, PAR‐1, is a protease‐activated G protein‐coupled receptor specifically cleaved by thrombin at its extracellular N‐terminus [17]. The amino‐terminal sequence thereby unmasked acts as a tethered ligand, triggering a rapid response that can be reproduced by a specific hexapeptide (SFLLRN). Mouse models in which thrombin generation is impaired display altered vascular development [17]. We have previously shown that PAR‐1 is expressed on EPC, and that its activation promotes angiogenesis in vitro, through up‐regulation of the SDF‐1 and angiopoietin pathways [18, 19].
Ingram et al. has described a hierarchy between late EPC derived from adult blood (AB) and those derived from cord blood (CB), based on their clonogenic and proliferative potential [20]. It is likely that EPC and mature endothelial cells have different angiogenic properties. For instance, we have shown that PAR‐1 activation only stimulates immature progenitor cell proliferation [21]. Moreover, PAR‐1 activation has been shown to induce angiogenesis associated with increased IL‐8 expression in human umbilical endothelial cells (HUVEC) [22, 23], but no such data are available for EPC. Therefore, we examined the expression of IL‐8 and its receptors in different subsets of human EPC, along with the effect of PAR‐1 activation on the IL‐8 pathway in early and late EPC derived from human cord and adult blood.
Methods
Preparation of mononuclear cells (MNC)
Cord and adult blood was diluted 1:1 with PBS, 0.2 mM EDTA, overlaid on Histopaque‐1077 (Sigma‐Aldrich, Saint‐Quentin Fallavier, France) and centrifuged at 1000 g for 20 min. MNC were collected and washed 3 times in PBS, 0.2 mM EDTA.
Culture of EPC
Cord blood (CB) late EPC culture and characterization are described in detail elsewhere [11, 18]. To obtain adult blood (AB) early and late EPC, 107 MNC per well were plated in collagen (BD, France)‐coated 6‐well plastic culture dishes and maintained in EGM2 medium (Lonza®, France) composed of endothelial cell basal medium‐2 (EBM2), 5% foetal bovine serum (FBS) and growth factors. Late EPC colonies appeared between 7 and 21 days of culture and consisted of well‐circumscribed cobblestone monolayer. Colonies were counted under an inverted microscope at ×20 magnification. The colonies were harvested, trypsinized and replated on 6‐well plates. AB early EPC derived from 107 MNC per well were enumerated with a trypan blue exclusion assay (Sigma, St Louis, MO, USA) under an inverted microscope once a week and were monitored for 60 days.
Immunohistochemistry
Immunohistochemical studies used a standard three‐step avidin‐biotin‐immunoperoxidase method [24]. An antibody against the proliferation marker Ki‐67 was obtained from Dako (Trappes, France).
Flow cytometry
Cultured cells were detached in non‐enzymatic cell dissociation medium (Sigma‐Aldrich, Saint‐Quentin Fallavier, France) to preserve cell membrane markers, then were washed in HBSS containing 10% FBS, resuspended in 50 μl of PBS‐1% BSA, and incubated for 30 min. at 4°C with primary mouse monoclonal antibodies (mAb) against CD31‐PE, CXCR1‐PE, CXCR2‐PE, integrin α6‐PE, integrin αvβ3‐PE (BD Pharmingen, Grenoble, France), CD144‐PE, CD146‐PCy5, CD34‐PCy5, CD14‐FITC, CD45‐FITC (Iotest, Beckman Coulter), KDR‐PE and CXCR4‐PE (R&D systems), CD133‐PE (myltenii biotec) and PAR‐1‐PE (clone WEDE 15, Immunotech, Marseille, France) at saturating concentrations. Isotype‐matched mouse IgG1 or IgG2a was used as negative control and was purchased from the same manufacturer as the specific antibodies.
Real‐time quantitative reverse‐transcription polymerase chain reaction (RT‐PCR)
The theoretical and practical aspects of real‐time quantitative RT‐PCR on the ABI Prism 7700 Sequence Detection System (Perkin‐Elmer Applied Biosystems, Courtaboeuf, France) are described in detail elsewhere [11, 18]. We quantified transcripts of the TBP gene, which encodes the TATA box‐binding protein (a component of the DNA‐binding protein complex TFIID) as the endogenous RNA control, and each sample was normalized on the basis of its TBP content. Results, expressed as N‐fold differences in target gene expression relative to the TBP gene, and termed Ntarget, were determined with the formula: Ntarget = 2ΔCtsample, where the ΔCt value of the sample was determined by subtracting the Ct value of the target gene from the Ct value of the TBP gene. The Ntarget values of the samples were subsequently normalized such that the untreated control Ntarget value was 1. Primers for TBP and the three target genes were chosen with the assistance of the Oligo 5.0 computer program (National Biosciences, Plymouth, MN, USA) and are shown in Table 1. To avoid amplifying contaminating genomic DNA, one of the two primers was placed at the junction between two exons. The thermal cycling conditions comprised an initial denaturation step at 95°C for 10 min. and 50 cycles at 95°C for 15 sec. and 65°C for 1 min.
Table 1.
Oligonucleotide primers used for real‐time quantitative RT‐PCR
| Gene | Upper primer sequence | Lower primer sequence |
|---|---|---|
| IL‐8 | 5′‐CAC CGG AAG GAA CCA TCT CAC TGT‐3′ | 5′ TCC TTG GCA AAA CTG CAC CTT CA– 3′ |
| CXCR1 (IL‐8RA) | 5′‐CCT GGC CGG TGC TTC AGT TA‐3′ | 5′‐ATC AAA ATC CCA CAT CTG TGG ATC T‐3′ |
| CXCR2 (IL‐8RB) | 5′‐GCT CTG ACT ACC ACC CAA CCT TGA‐3′ | 5′‐AGA AGA GCA GCT GTG ACC TGC TGT‐3′ |
| MMP‐1 | 5′‐ GGC TTG AAG CTG CTT ACG AAT TT ‐3′ | 5′‐ ACA GCC CAG TAC TTA TTC CCT TTG A ‐3′ |
| ATF3 | 5′‐ GCG CTG GAA TCA GTC ACT GTC A ‐3′ | 5′‐ TTC AGG GGC TAC CTC GGC TT ‐3′ |
| Jun‐c | 5′‐ CAC GGC CAA CAT GCT CAG G ‐3′ | 5′‐GCA TGA GTT GGC ACC CAC TGT‐3′ |
| Jun‐b | 5′‐ACG ACT ACA AAC TCC TGA AAC CGA‐3′ | 5′‐CCC CAG GCG CTT TGA GAC T‐3′ |
| Jun‐d | 5′‐TCT ACG CGA ACC TGA GCA GCT AC‐3′ | 5′‐GAA GGG CAC AGG TTC GGC A‐3′ |
| Fos | 5′‐ACC ACT CAC CCG CAG ACT CCT‐3′ | 5′‐ CCA GGT CCG TGC AGA AGT CCT‐ 3′ |
| Fos‐b | 5′‐ACC CCG AGA GGA GAC GCT CAC ‐3′ | 5′‐ CTC CGC CGG TTC CTG CAT T ‐3′ |
| Gadd45‐β | 5′‐TGG ATT ATA ATT GCA ACA TGA CGC T ‐3′ | 5′‐ CGG TCA CCG TCT GCA TCT TCT ‐3′ |
| Bcl2A1 | 5′‐ ATT TCA TAT TTT GTT GCG GAG TTC A ‐3′ | 5′‐ CTT CTT TAC AAA GCC ATT TTC CCA ‐3′ |
| IER3S | 5′‐ CTC TCG CGG GCA CCG AAA ‐3′ | 5′‐ GCT GGC GCC GGA CCA CT ‐3′ |
| NF‐κB 1 | 5′‐ GCC AGC GTG GGA GTC CTG A ‐3′ | 5′‐ AAG TGT AGA CAC GTG TGG CCA TTG TA ‐3′ |
| NF‐κB 2 | 5′‐ GCC AGC GTG GGA GTC CTG A ‐3′ | 5′‐ AAG TGT AGA CAC GTG TGG CCA TTG TA ‐3′ |
| REL | 5′‐ CCG AAC ATA CCC TTC TAT CCA GAT TA‐3′ | 5′‐ TGA GGA TGA GGT TTA TAT GGG TCA TT – 3′ |
| REL‐A | 5′‐ CCA GTA CCT GCC AGA TAC AGA CGA T – 3′ | 5′– CGC TGA AAG GAC TCT TCT TCA TGA T – 3′ |
| REL‐B | 5′– CCT CGC GAC CAT GAC AGC TA – 3′ | 5′– CCG CCG TTT GCT CTC GAT – 3′ |
| PAR‐1 | 5′‐ GCC CCC TGC TTC AGT CTG T ‐3′ | 5′‐ TGT TGC TTT TGA TTC TGG CCT G – 3′ |
| TBP | 5′– TGC ACA GGA GCC AAG AGT GAA – 3′ | 5′– CAC ATC ACA GCT CCC CAC CA– 3′ |
ELISA measurement of secreted IL‐8
Cells were incubated for 24 hrs in EBM2 at 37°C with 75 μM SFLLRN and the IL‐8 concentration was measured with the Quantikine ELISA kit (R&D systems).
Immunoblotting
NP40 Cell Lysis buffer (Biosource®, Nivelles – Belgium) supplemented with PMSF (1 mM), a protease inhibitor cocktail (P 2714, Sigma®) and a phosphatase inhibitor cocktail (P 2850, Sigma®) was used to prepare cell lysates (30 min., +4°C). After centrifugation (12,000 g, 15 min., +4°C), protein was quantified in the supernatant with the BCA® kit (Pierce® Rockford, IL, USA). Proteins (10 μg) were separated by NuPAGE® electrophoresis (Invitrogen®, Cergy‐Pontoise, France) performed with a 4–12% acrylamide gel, transferred to a nitrocellulose membrane and then probed overnight at +4°C with antibodies against phospho‐c‐Jun Ser63 (CS2361), phospho‐c‐Jun Ser73 (CS9164) and c‐Jun (CS9165) from Cell Signaling® (Danvers, MA, USA) and against phospho‐c‐Fos (sc‐81485) and c‐Fos (sc‐81444) from Santa Cruz Biotechnology® (Santa Cruz, CA, USA). Membranes were incubated with secondary HRP‐antibodies (antimouse NA931 and antirabbit NA934, GE Healthcare®, Orsay, France) for 1 hr at room temperature. Immunoblots were developed with enhanced chemiluminescence detection (ECL Reagent Plus, Perkin Elmer). Membranes were stripped of bound antibodies by incubating in Restore® Western Blot stripping reagent and reprobed with another primary antibody as appropriate. Spots were quantified with Image J® software (freely available on the National Institutes of Health website).
Cell proliferation assay
The effects of SFLLRN peptide on EPC proliferation were examined by measuring cell phosphatase activity based on the release of paranitrophenol (pNPP, Sigma‐Aldrich) measured at OD 405 nm (Flustar optima, BMG labtech, Champigny‐ sur‐Marne, France) after 3 days of incubation. EPC were activated in EBM2 medium containing SFLLRN 75 μM and antibodies blocking IL‐8 at 10 μg/ml (goat IgG, AF‐208‐NA, R&D systems).
In vitro capillary‐like growth assay
CB late EPC were activated for 4 hrs in EBM2 medium containing SFLLRN 75 μM. Cells were then seeded on Matrigel (3 × 10⁴ cells/well) and cultured for 18 hrs at 37°C with 5% CO2, with or without antibodies blocking IL‐8 at 10 μg/ml. Capillary‐like structures were examined by phase‐contrast microscopy and endothelial cell networks formed by late EPC were quantified with Videomet 5.4.0 software.
Cell migration assay
EPC migration was measured in 24‐well modified Boyden chambers (Costar, Avon, France) equipped with 3‐μm pore‐size filters. Early EPC were seeded at a density of 5 × 10⁴ per well in 200 μl of EBM2, and were allowed to migrate for 5 hrs at 37°C. Conditioned medium from late EPC (600 μl) was placed in the lower chamber, with or without blocking IL‐8 antibodies at 10 μg/ml.
Cell transfection with siRNA against PAR‐1
SiRNA previously shown [25] to silence PAR‐1 (sc‐36663, Santa Cruz Biotechnology, Santa Cruz, CA, USA) was mixed with the Primefect reagent (LONZA) at 10 μM to obtain the transfection complexes, which were added to 2 × 10⁵ CB late EPC in complete EGM2 medium in 6‐well plates. Scrambled siRNA (Allstars Neg. control siRNA, Qiagen, Cambridge, MA, USA) was used as a control.
Statistical analysis
Data are shown as means ± S.E.M. Significant differences were identified by ANOVA followed by Fisher’s protected least‐significant‐difference test. All statistical tests were performed with the Stat View software package (SAS, Cary, NC, USA). Differences with P‐values <0.05 were considered significant.
Results
EPC characterization
The starting material used to isolate endothelial populations consisted of either mononuclear cells (MNC) from adult peripheral blood (AB) or CD34+ sorted cells from human umbilical cord blood (CB). Early EPC from adult blood (AB early EPC) were obtained from MNC cultured on type‐1 collagen in endothelial growth medium (EGM2). During the first 20 days of culture, AB early EPC were identified as elongated sprouting cells, sometimes radiating from a central core of round cells (Fig. 1A). They weakly expressed the endothelial markers CD31, CD144, CD146 and KDR, and expressed high levels of CXCR1 and CXCR2 and of the leucocyte and monocyte antigens CD45 and CD14. Early EPC expressed neither the haematopoietic markers CD34 and CD133 nor the integrins α6 and αvβ3 (Table 2). Early EPC did not replicate in vitro and gradually disappeared 60 days after plating.
Figure 1.
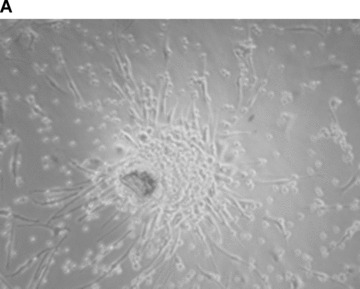
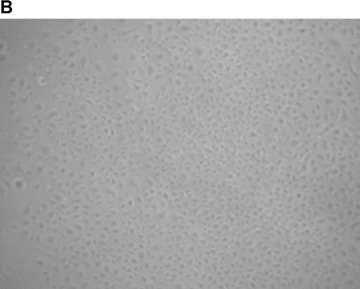


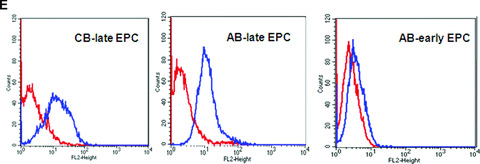
Characterization of early and late EPC. (A) Representative phase‐contrast photomicrograph of AB‐early EPC (mag. ×20). (B) Representative phase‐contrast photomicrograph of an AB‐late EPC colony (mag. ×20). (C) Growth curves of three types of EPC: early EPC isolated from adult blood (▪), and late EPC isolated from adult blood (–▴–) and cord blood (▾). (D) Ki‐67 differential expression between early EPC (left panel) and late EPC from adult blood (centre) and cord blood (right) by immunohistochemistry. Representative images of AB early EPC 10 days after plating and AB and CB late EPC before 40 days of culture after plating. (E) Expression of the thrombin receptor PAR‐1 in AB‐early, AB‐late and CB‐late EPC by flow cytometry. Representative histograms of detached EPC after immunolabelling with a control antibody (red line) and PAR‐1‐specific antibody (blue line).
Table 2.
Mean fluorescence intensity (MFI) of AB early EPC, AB late EPC and CB late EPC phenotypic markers analysed by flow cytometry
| AB early EPC | AB late EPC | CB late EPC | |
|---|---|---|---|
| CD31 | 5.9 | 113.3 | 168.8 |
| CD144 | 3.5 | 8.2 | 9.6 |
| CD146 | 2.6 | 111.0 | 110.4 |
| KDR | 3.0 | 3.1 | 3.2 |
| CXCR1 | 7.1 | 1.2 | 1.1 |
| CXCR2 | 8.5 | 1.9 | 1.5 |
| CXCR4 | 11.4 | 9.6 | 8.4 |
| CD 34 | 1.3 | 22.5 | 23.1 |
| CD 133 | 1.3 | 0.9 | 1.5 |
| Integrinα6 | 1.4 | 7.0 | 12.0 |
| Integrin αvβ3 | 1.1 | 30.7 | 37 |
| CD 14 | 3.5 | 1.4 | 0.8 |
| CD 45 | 8.8 | 1.1 | 0.9 |
| PAR‐1 | 3.0 | 14.1 | 17.8 |
MFI was considered positive if above 2 (bold type in the table).
For late EPC culture, AB‐MNC and CB‐CD34+ cells, respectively, were seeded in collagen‐ and gelatin‐coated culture plates with EGM2. Non‐adherent cells were discarded daily and fresh EGM2 medium was added. Colonies emerged from adherent cells between 7 and 21 days. AB and CB late EPC monolayers had a cobblestone appearance typical of the endothelial lineage (Fig. 1B). They rapidly grew from several cells to a colony, formed near‐confluent monolayers and showed multiple population doublings. Interestingly, the number of late EPC obtained per blood volume was 20‐fold higher with CB than with AB, and only one‐fifth of AB late EPC expanded after replating. We thus compared the proliferative kinetics of CB and AB late EPC in serial cultures. Remarkably, CB late EPC expanded for at least 120 days with no morphological signs of senescence. In contrast, AB late EPC could be cultured for only 60 days (Fig. 1C). The higher proliferative potential of CB late EPC was confirmed by Ki67 immunostaining: more than 80% of CB late EPC were positive for Ki67, compared to only 30% of AB late EPC and less than 1% of AB early EPC (Fig. 1D). Immunophenotyping revealed that AB and CB late EPC expressed the endothelial cell‐surface antigens CD31, CD144, CD146 and KDR (Table 2). Importantly, they did not express the haematopoietic‐cell‐specific surface antigens CD45 and CD14. Finally, late EPC expressed CD34 but not CD133 on their surface. Both early and late EPC expressed the PAR‐1 receptor, although the expression level was much lower in early EPC (Fig. 1E and Table 2).
We used RTQ‐PCR to compare the basal gene expression of IL‐8 and its receptors CXCR1 and CXCR2 in early and late EPC. IL‐8 mRNA was expressed at a high level in both cell types, but was 50 times more abundant in AB early EPC than in late EPC derived from either CB or AB. In contrast, CXCR1 and CXCR2 were not expressed in late EPC at either the mRNA level (Fig. 2A) or the protein level (Fig. 2B), whereas AB early EPC expressed both receptors (Fig. 2A and B).
Figure 2.
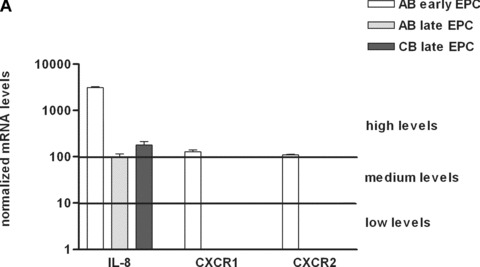
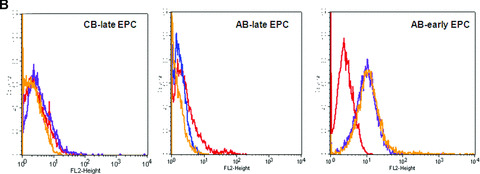
Expression of IL‐8 and its receptors CXCR1 and CXCR2 in early and late EPC. (A) Transcripts of IL‐8 and its receptors CXCR1 and CXCR2 were measured in early EPC isolated from adult blood, and in late EPC isolated from adult and cord blood. mRNA levels were normalized to TBP transcripts and to the sample with the lowest quantifiable level (i.e. 1 on the left ordinate, corresponding to a Ct value of 35). (B) Expression of CXCR1 and CXCR2 in AB early, AB late and CB late EPC by flow cytometry. Representative histograms of detached EPC after immunolabelling with a control antibody (red line) and specific antibodies against CXCR1 (blue line) and CXCR2 (orange line).
Effect of PAR‐1 activation on IL‐8 pathway
As previously shown by Hur et al. [10], high IL‐8 protein levels were found in early EPC conditioned medium and did not change 24 hrs after PAR‐1 activation (Fig. 3A). By contrast, the IL‐8 basal level was very low in conditioned medium of late EPC and increased 4‐fold upon PAR‐1 activation of both AB and CB late EPC (Fig. 3A).
Figure 3.


SFLLRN induces expression of IL‐8 mRNA and protein in late EPC. (A) Early and late EPC were cultured in endothelial basal medium‐2 (EBM2) for 24 hrs and IL‐8 was quantified in the medium by ELISA. IL‐8 (ng/106 cells) was at 312 ± 28 in early EPC and 338 ± 3 after SFLLRN treatment (P= 0.46). IL‐8 in late EPC from adult blood averaged 15 ± 2 ng/106 cells at baseline versus 273 ± 80 ng/106 cells after SFLLRN treatment (*P= 0.014). In late EPC from cord blood, IL‐8 was at 110 ± 7 ng/106 cells versus 471 ± 196 ng/106 cells after SFLLRN treatment (*P= 0.034). (B) Effect of PAR‐1 activation on mRNA expression of IL‐8 and its receptors CXCR1 and CXCR2 by early EPC from adult blood (AB) and late EPC from AB and cord blood (CB). Gene expression was considered relevant when the Ct value (representing the threshold cycle number at which PCR products become detectable) was below 35. EPC were stimulated with SFLLRN 75 μM for 4 hrs after 16 hrs of serum and growth‐factor privation (EBM2). mRNAs were measured by RTQ‐PCR and normalized to the ubiquitous gene TBP mRNA. Normalized mRNA levels were compared between stimulated and untreated control cells (arbitrarily = 1). Data are means ± S.E.M. of at least three independent experiments. (C) Time‐dependent fold‐increase in IL‐8 gene expression upon PAR‐1 activation by SFLLRN in CB late EPC. Serum‐starved CB late EPC were kept unstimulated or stimulated for 1, 4, 8, 12, 24 or 48 hrs with SFLLRN 75 μM. MRNAs were measured by RTQ‐PCR and normalized to the ubiquitous gene TBP mRNA. Normalized mRNA levels were compared between stimulated and untreated control cells (arbitrarily = 1). Data are means ± S.E.M. of at least three independent experiments.
To study the effects of PAR‐1 activation on IL‐8 gene transcription, AB early EPC and AB and CB late EPC were incubated for 4 hrs with the PAR‐1‐activating peptide SFLLRN at the optimal concentration of 75 μM [18]. As shown in Fig. 3B, IL‐8 mRNA expression was significantly up‐regulated (20‐fold) in CB late EPC upon PAR‐1 activation, in keeping with the increase in the protein concentration in the culture medium shown in Fig. 3A. PAR‐1 activation also led to a moderate increase in IL‐8 mRNA in AB late EPC. No induction of CXCR1 or CXCR2 was observed after PAR‐1 activation in early EPC, by either RTQ‐PCR (Fig. 3B) or flow cytometry (data not shown).
To gain insight into the targets involved in IL‐8 up‐regulation upon PAR‐1 activation, the time course of the gene expression profile of CB late EPC in response to 75 μM SFLLRN was studied by RTQ‐PCR. RNA was isolated from CB late EPC after 1, 4, 8, 12, 24 and 48 hrs of SFLLRN stimulation. IL‐8 synthesis was maximal after 1–4 hrs of SFLLRN stimulation (Fig. 3C). We then compared cells stimulated for 1 and 4 hrs and untreated cells. As the IL‐8 gene has a promoter region containing activator protein‐1 (AP‐1) and NF‐κB regulatory element sites, we examined whether EPC IL‐8 mRNA levels correlated with the amounts of AP‐1 and NF‐κB members and known target genes (Table 3). IL‐8 mRNA levels correlated positively with the levels of AP‐1 pathway members such as ATF3, JunB and FosB, and with the expression of their target genes (e.g. MMP‐1). Phosphorylation of c‐Fos and c‐Jun on Ser63 and Ser73 is critical for IL‐8 transactivation and for enhanced AP‐1 DNA binding. PAR‐1 activation with SFLLRN induced a significant increase in c‐Jun and c‐fos phosphorylation from 15 min. to 1 hr after PAR‐1 activation with SFLLRN (Fig. 4). PAR‐1 activation also modulated NF‐κB members and increased the expression of GADD45β and BCL2A1, two typical NF‐κB target genes (Table 3).
Table 3.
Effect of PAR‐1 activation in CB late EPC on mRNA expression of IL‐8 and other genes activated by AP‐1 and/or NF‐κB pathways
| Target | 1 hr | 4 hrs | |
|---|---|---|---|
| IL‐8 | AP‐1/ NF‐κB | 53.1 ± 32* | 30.1 ± 25* |
| MMP1 | AP‐1 | 1.9 ± 0.6* | 2 ± 0.6* |
| ATF3 | AP‐1 | 5.6 ± 1.6* | 1.5 ± 0.7 |
| Jun‐c | AP‐1 | 1.1 ± 0.1 | 1 ± 0.4 |
| Jun‐b | AP‐1 | 104.4 ± 130* | 19.2 ± 14 |
| Jun‐d | AP‐1 | 1.6 ± 0.6 | 1.1 ± 0.4 |
| Fos | AP‐1 | 1.6 ± 1 | 0.3 ± 0.2* |
| Fos‐b | AP‐1 | 46 ± 44* | 0.9 ± 0.6 |
| GADD45B | NF‐κB | 6.2 ± 3* | 1.7 ± 0.4* |
| BCL2A1 | NF‐κB | 59.2 ± 56* | 50.1 ± 46* |
| IER3S | NF‐κB | 0.9 ± 0.5 | 0.5 ± 0.1* |
| NFKB‐1 | NF‐κB | 1.9 ± 0.1* | 2.1 ± 0.6* |
| NFKB‐2 | NF‐κB | 2.9 ± 1* | 5.9 ± 4* |
| REL | NF‐κB | 1.5 ± 0.6 | 0.4 ± 0.1* |
| REL‐A | NF‐κB | 1.3 ± 0.6 | 1 ± 0.3 |
| REL‐B | NF‐κB | 5.2 ± 2* | 6.1 ± 3* |
EPC were stimulated with SFLLRN for 1 or 4 hrs after 16 hrs of serum and growth‐factor privation. MRNAs were measured by real‐time quantitative RT‐PCR and normalized to TBP mRNA (mean ± S.E.M., n= 3). *P < 0.05, compared with unstimulated cells (= 1).
Figure 4.
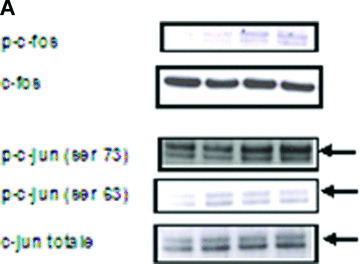
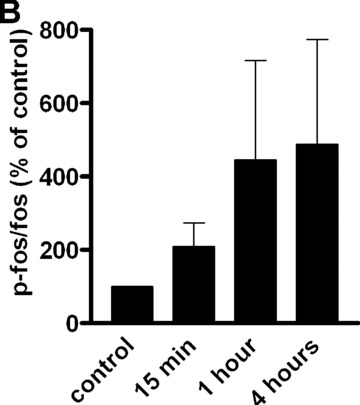
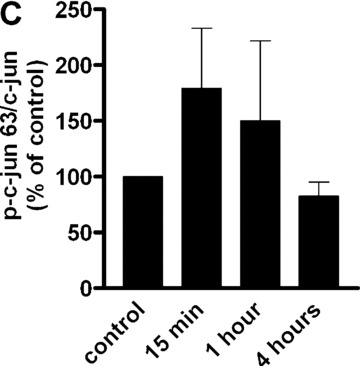
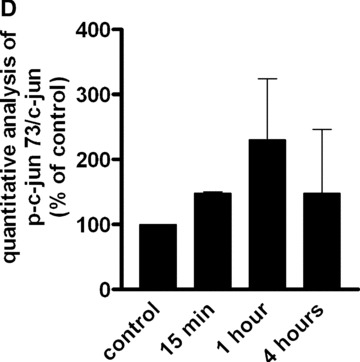
Effect of SFLLRN 75 μM on c‐Fos (Thr325) and c‐jun (Ser 63 and Ser73) phosphorylation. (A) CB late EPC were stimulated with SFLLRN 75 μM and collected 15 min., 1 hr and 4 hrs later for immunoblotting experiments. (B), (C) and (D): quantitative integration of western blots by image J® software for p‐fos (B) and p‐c‐jun 63 (C) and 73 (D) at the different time‐points.
Roles of IL‐8 in PAR‐1 activated EPC
As previously shown [18, 19, 21, 26], SFLLRN increases late EPC proliferation when cultured in serum‐containing medium. The anti‐IL‐8 blocking antibody did not inhibit this proliferation response (Fig. 5A). As previously shown [18], treatment of late EPC with SFLLRN (75 μM) also promoted EPC organization into branched structures and pseudo‐tubes with enclosed areas in Matrigel. The anti‐IL‐8 blocking antibody did not inhibit the differentiation response of late EPC activated with PAR‐1 agonist (network length: 1863 ± 326 μm in untreated controls versus 5399 ± 1471 and 5846 ± 1976 μm in SFLLRN‐treated cells with and without anti‐IL‐8 blocking antibody, respectively) (Fig. 5B). To test the functional activity of IL‐8 released from late EPC stimulated with SFLLRN, we tested the effect of concentrated medium conditioned by CB late EPC 48 hrs after PAR‐1 activation on the migration of AB early EPC, which express CXCR1 and CXCR2 (Fig. 2). As shown in Fig. 5C, this conditioned medium induced early‐EPC migration more potently than unstimulated late‐EPC conditioned medium in the Boyden chamber assay, and this effect was reversed by a neutralizing antibody directed against IL‐8.
Figure 5.
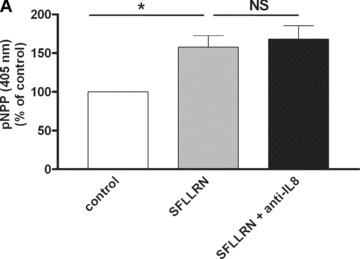


IL‐8 blockade inhibits SFLLRN‐induced migration of early EPC but not their proliferation and differentiation. (A) The effect of SFLLRN 75 μM on CB late EPC proliferation was evaluated by measuring pNPP release at 405 nm in EBM2 medium (mean ± S.E.M.). An IL‐8 blocking antibody had no effect on cell proliferation. *P < 0.05. (B) Quantitative analysis of network length. EPC were stimulated with SFLLRN 75 μM for 4 hrs before being used in the tubule formation assay on Matrigel for 18 hrs, in the presence or absence of a polyclonal antibody against human IL‐8. IL‐8 blockade did not inhibit SFLLRN‐induced pseudotube formation. *P < 0.05. (C) Early‐EPC migration towards conditioned medium (CM) of late EPC activated with SFLLRN for 48 hrs. The control is represented by early‐EPC migration toward CM of untreated late EPC (100% migration). CM of late EPC after PAR‐1 activation enhanced the migration of early EPC. This effect was abrogated by a polyclonal antibody against human IL‐8. The mean and S.E.M. of three experiments are shown. *P < 0.05.
Reversal of SFLLRN‐induced cytokine expression by PAR‐1 silencing
PAR‐1 gene silencing after 48 hrs of transfection of CB‐late EPC with 10 μM specific siRNAs resulted in strong inhibition of PAR‐1 expression on the EPC surface, as shown by flow cytometry (Fig. 6A and B). This was confirmed by a significant decrease in PAR‐1 mRNA, whereas the control scrambled siRNA did not interfere with PAR‐1 mRNA expression (Fig. 6B).
Figure 6.
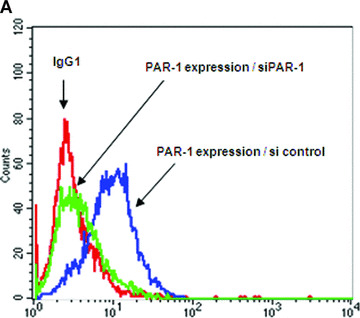
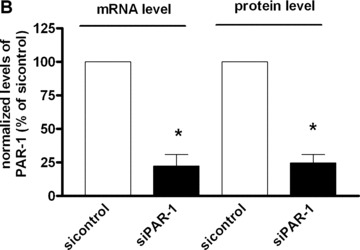

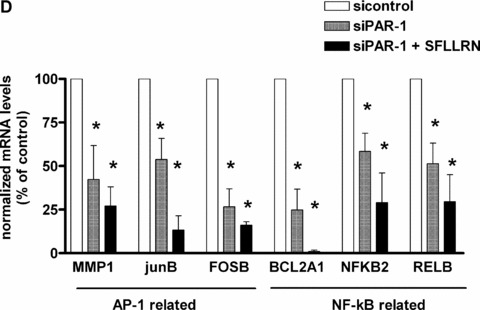
PAR‐1 gene silencing by siRNA reverses SFFLRN‐induced IL‐8 synthesis. (A) Analysis of PAR‐1 expression by flow cytometry on CB late EPC, after 48 hrs of transfection with si control (all star negative control, Qiagen®) and siPAR‐1 (Santacruz Biotechnologies®) with Primefect® (LONZA). (B) Quantitative analysis of PAR‐1 mRNA by RTQ‐PCR and PAR‐1 protein by flow cytometry. The mean and S.E.M. of five experiments are shown. *P < 0.05. (C) Inhibition of IL‐8 expression in siPAR‐1 transfected cells in basal conditions and after SFLLRN 75 μM activation. The mean and S.E.M. of at least three experiments are shown. *P < 0.05. (D): Inhibition of AP‐1 and NF‐κB members expression in siPAR‐1 transfected cells in basal conditions and after SFLLRN 75 μM activation. The mean and S.E.M. of three experiments are shown. *P < 0.05
siRNA‐transfected CB late EPC were incubated with SFLLRN 75 μM for 4 hrs. Suppression of PAR‐1 expression reduced IL‐8 expression in basal conditions (Fig. 6C), compared to cells transfected with the scrambled siRNA, and SFLLRN no longer exerted its stimulating effect on IL‐8 synthesis (Fig. 6C). To confirm suppression of IL‐8 expression after PAR‐1 inhibition, we quantified AP‐1 and NF‐κB members expression in siPAR‐1‐transfected cells in basal conditions and after SFLLRN 75 μM activation. Like observed in IL‐8 level, we also find a significant decrease of AP‐1 and NF‐κB members expression in siPAR‐1‐transfected cells in basal conditions and after SFLLRN 75 μM activation (Fig. 6D).
Discussion
The importance of endothelial precursor cells in the neovascularization of ischaemic tissues is becoming more apparent (for review [9]). Recently, it was shown that IL‐8 is an important chemoattractant for EPC myocardial homing [15], and also a mitogen released by human late EPC [13]. Moreover, the angiogenic effect of IL‐8 on mature endothelial cells [27] is associated with a mitogenic effect [2], and with enhanced cell survival, stimulation of matrix metalloproteinase production, and capillary tube formation in vitro[2]. These angiogenic and mitogenic effects are counterbalanced by a deleterious effect of IL‐8 on the fibrinolytic potential of endothelial cells, resulting from up‐regulation of PAI‐1 and down‐regulation of t‐PA release [28]. IL‐8 is also up‐regulated by thrombin [22]. We have previously shown that activation of the thrombin receptor PAR‐1 confers proangiogenic properties on expanded EPC [18, 19], and that thrombin adsorbed to fibrin clots may contribute to EPC recruitment [26]. Here, we examined the effect of PAR‐1 activation on the IL‐8 pathway in different human EPC subsets.
Since Asahara et al. first reported the existence of EPC in peripheral blood [29], several studies have shown significant heterogeneity among EPC populations. In this study, we used ‘early’ and ‘late’ EPC isolated from cord blood and adult blood. These cells have the same therapeutic potential in vivo[10, 30], whereas differentiated mature endothelial cells do not stimulate neovascularization, possibly owing to a difference in cathepsin L expression [31]. Angiogenic growth factor release by early and late EPC has been reported [10, 12, 32], as well as an autocrine angiogenic effect mediated by the endothelium during tumour neovascularization [33]. However, the respective contributions of autocrine and paracrine mechanisms to the cell cooperation required for neovascularization are unclear. The recent implication of the IL‐8 system in angiogenesis led us to quantify the expression of IL‐8 pathway genes at baseline and upon thrombin receptor activation in EPC populations. We observed marked differences between early and late EPC. By using RTQ‐PCR – currently the most sensitive and accurate method for quantifying gene expression – we found that CXCR1 and CXCR2 transcripts are not expressed in late EPC, contrary to early EPC. Interestingly, in basal conditions, IL‐8 was abundant in the culture medium of early EPC but not of late EPC, whatever their origin (cord or adult blood). We chose to use late EPC from cord and adult blood, given the strong differences in their proliferative potentiel that have been reported elsewhere [20] and are confirmed here (Fig. 1). The small amount of IL‐8 secreted by late EPC is consistent with the report by Hur and colleagues [10], whereas He et al. found high basal IL‐8 secretion by late EPC [13]. Upon PAR‐1 activation, we found that IL‐8 mRNA increased only moderately in AB late EPC, whereas IL‐8 protein secretion increased 17‐fold, pointing to the existence of an intracellular pool. The expression of the IL‐8 receptors CXCR1 and CXCR2 in cultured EPC and in endothelial cells [8] is also a matter of debate. Indeed, Yoon et al. reported CXCR1 and CXCR2 expression by early and late EPC [12] whereas, in our conditions, late EPC expressed neither IL‐8 receptor, at either the mRNA or the protein level. Thus, differences in IL‐8 expression cannot explain the observed difference in proliferative potential between late EPC derived from cord blood and adult blood. In contrast, we found that late EPC secreted significant levels of IL‐8 upon PAR‐1 activation, independently of their proliferative potential, suggesting an important role of IL‐8 during EPC maturation. The absence of IL‐8 receptors on late EPC in our experimental conditions rules out an autocrine effect of IL‐8 in this setting.
This study demonstrates that suppression of PAR‐1 expression by RNA interference, verified at both the mRNA and protein levels, reverses the IL‐8 up‐regulation elicited by SFLLRN peptide, reflecting the essential and exclusive role of PAR‐1 in EPC. Moreover, suppression of PAR‐1 expression reduced IL‐8 expression in basal conditions, suggesting that PAR‐1 plays a major role in the regulation of IL‐8 synthesis and that PAR‐1 activators are steadily secreted by EPC [34, 35].
Yoder et al. recently reported that only late EPC can form vessels in vivo[36]. Inducible IL‐8 production by late EPC might induce the recruitment of both inflammatory cells and early EPC, which express IL‐8 receptors. Recent studies have shown the importance of CXCR2 for circulating EPC homing to sites of arterial injury and for in vivo endothelial repair [37]. Thus, therapeutic injection of PAR‐1‐activated late EPC secreting IL‐8 might increase the recruitment of EPC expressing CXCR1 or CXCR2.
The results of this study demonstrate that the different human EPC subsets with beneficial effect in vivo[10, 30] exhibit different patterns of IL‐8 secretion upon PAR‐1 activation. Indeed, IL‐8 secretion by early EPC is not inducible, contrary to secretion by late EPC, implying that these cells have paracrine effects upon PAR‐1 activation. PAR‐1‐specific antagonists have been developed and tested for their capacity to inhibit platelet aggregation in thrombosis, inflammatory bowel disease and experimental liver fibrosis, and also as anti‐angiogenic agents [38, 39]. EPC increase tumour vascularization [40], and IL‐8 participates in tumour growth and tumour vascularization [6]. Moreover, in tumour environments, PAR‐1 activation is triggered by thrombin adsorbed to fibrin deposits [26] or to tumour‐secreted MMP‐1 [34]. Our findings therefore lend further support to clinical trials of PAR‐1 antagonists in cancer.
Our results are consistent with the view that EPC contribute to regeneration of injured endothelium and to neovascularization of ischaemic tissues by stimulating proliferation of surrounding cells through a paracrine action. The role of IL‐8 in these effects remains to be determined. Our results suggest that PAR‐1 activation could be used to increase IL‐8 secretion by late EPC. In the presence of thrombin generated at a target site, this could promote vasculogenesis and thrombus resorption, although tumour growth might also be stimulated.
Acknowledgements
We thank C. Avignon for technical assistance. This work was supported by the Leducq TransAtlantic Network of Excellence on Atherothrombosis Research (Grant 04CVD01) and Programme Hospitalier de Recherche Clinique OPTIPEC (Ministère Chargé de la Santé, PHRC AOM 03 034, sponsor: AP‐HP). The authors declare no conflict of interest.
References
- 1. Murphy PM, Baggiolini M, Charo IF, et al. International union of pharmacology. XXII. Nomenclature for chemokine receptors. Pharmacol Rev. 2000; 1: 145–76. [PubMed] [Google Scholar]
- 2. Li A, Dubey S, Varney ML, et al. IL‐8 directly enhanced endothelial cell survival, proliferation, and matrix metalloproteinases production and regulated angiogenesis. J Immunol. 2003; 6: 3369–76. [DOI] [PubMed] [Google Scholar]
- 3. Arenberg DA, Kunkel SL, Polverini PJ, et al. Inhibition of interleukin‐8 reduces tumorigenesis of human non‐small cell lung cancer in SCID mice. J Clin Invest. 1996; 12: 2792–802. [DOI] [PMC free article] [PubMed] [Google Scholar]
- 4. Strieter RM, Kunkel SL, Elner VM, et al. Interleukin‐8. A corneal factor that induces neovascularization. Am J Pathol. 1992; 6: 1279–84. [PMC free article] [PubMed] [Google Scholar]
- 5. Galffy G, Mohammed KA, Nasreen N, et al. Inhibition of interleukin‐8 reduces human malignant pleural mesothelioma propagation in nude mouse model. Oncol Res. 1999; 4: 187–94. [PubMed] [Google Scholar]
- 6. Huang S, Mills L, Mian B, et al. Fully humanized neutralizing antibodies to interleukin‐8 (ABX‐IL8) inhibit angiogenesis, tumor growth, and metastasis of human melanoma. Am J Pathol. 2002; 1: 125–34. [DOI] [PMC free article] [PubMed] [Google Scholar]
- 7. Bieche I, Chavey C, Andrieu C, et al. CXC chemokines located in the 4q21 region are up‐regulated in breast cancer. Endocr Relat Cancer. 2007; 4: 1039–52. [DOI] [PubMed] [Google Scholar]
- 8. Petzelbauer P, Watson CA, Pfau SE, et al. IL‐8 and angiogenesis: evidence that human endothelial cells lack receptors and do not respond to IL‐8 in vitro. Cytokine. 1995; 3: 267–72. [DOI] [PubMed] [Google Scholar]
- 9. Smadja DM, Cornet A, Emmerich J, et al. Endothelial progenitor cells: characterization, in vitro expansion, and prospects for autologous cell therapy. Cell Biol Toxicol. 2007; 4: 223–39. [DOI] [PubMed] [Google Scholar]
- 10. Hur J, Yoon CH, Kim HS, et al. Characterization of two types of endothelial progenitor cells and their different contributions to neovasculogenesis. Arterioscler Thromb Vasc Biol. 2004; 2: 288–93. [DOI] [PubMed] [Google Scholar]
- 11. Smadja DM, Bieche I, Helley D, et al. Increased VEGFR2 expression during human late endothelial progenitor cells expansion enhances in vitro angiogenesis with up‐regulation of integrin alpha(6). J Cell Mol Med. 2007; 5: 1149–61. [DOI] [PMC free article] [PubMed] [Google Scholar]
- 12. Yoon CH, Hur J, Park KW, et al. Synergistic neovascularization by mixed transplantation of early endothelial progenitor cells and late outgrowth endothelial cells: the role of angiogenic cytokines and matrix metalloproteinases. Circulation. 2005; 11: 1618–27. [DOI] [PubMed] [Google Scholar]
- 13. He T, Peterson TE, Katusic ZS. Paracrine mitogenic effect of human endothelial progenitor cells: role of interleukin‐8. Am J Physiol Heart Circ Physiol . 2005; 2: H968–72. [DOI] [PubMed] [Google Scholar]
- 14. Schomig K, Busch G, Steppich B, et al. Interleukin‐8 is associated with circulating CD133+ progenitor cells in acute myocardial infarction. Eur Heart J. 2006; 9: 1032–7. [DOI] [PubMed] [Google Scholar]
- 15. Kocher AA, Schuster MD, Bonaros N, et al. Myocardial homing and neovascularization by human bone marrow angioblasts is regulated by IL‐8/Gro CXC chemokines. J Mol Cell Cardiol. 2006; 4: 455–64. [DOI] [PubMed] [Google Scholar]
- 16. Marboeuf P, Corseaux D, Mouquet F, et al. Inflammation triggers colony forming endothelial cell mobilization after angioplasty in chronic lower limb ischemia. J Thromb Haemost. 2008; 1: 195–7. [DOI] [PubMed] [Google Scholar]
- 17. Major CD, Santulli RJ, Derian CK, et al. Extracellular mediators in atherosclerosis and thrombosis: lessons from thrombin receptor knockout mice. Arterioscler Thromb Vasc Biol. 2003; 6: 931–9. [DOI] [PubMed] [Google Scholar]
- 18. Smadja DM, Bieche I, Uzan G, et al. PAR‐1 activation on human late endothelial progenitor cells enhances angiogenesis in vitro with upregulation of the SDF‐1/CXCR4 system. Arterioscler Thromb Vasc Biol. 2005; 11: 2321–7. [DOI] [PubMed] [Google Scholar]
- 19. Smadja DM, Laurendeau I, Avignon C, et al. The angiopoietin pathway is modulated by PAR‐1 activation on human endothelial progenitor cells. J Thromb Haemost. 2006; 9: 2051–8. [DOI] [PubMed] [Google Scholar]
- 20. Ingram DA, Mead LE, Tanaka H, et al. Identification of a novel hierarchy of endothelial progenitor cells using human peripheral and umbilical cord blood. Blood. 2004; 9: 2752–60. [DOI] [PubMed] [Google Scholar]
- 21. Smadja DM, Bieche I, Emmerich J, et al. PAR‐1 activation has different effects on the angiogenic activity of endothelial progenitor cells derived from human adult and cord blood. J Thromb Haemost. 2006; 12: 2729–31. [DOI] [PubMed] [Google Scholar]
- 22. Okada M, Suzuki K, Takada K, et al. Detection of up‐regulated genes in thrombin‐stimulated human umbilical vein endothelial cells. Thromb Res. 2006; 6: 715–21. [DOI] [PubMed] [Google Scholar]
- 23. Ueno A, Murakami K, Yamanouchi K, et al. Thrombin stimulates production of interleukin‐8 in human umbilical vein endothelial cells. Immunology. 1996; 1: 76–81. [DOI] [PMC free article] [PubMed] [Google Scholar]
- 24. Borenstein N, Bruneval P, Hekmati M, et al. Noncultured, autologous, skeletal muscle cells can successfully engraft into ovine myocardium. Circulation. 2003; 24: 3088–92. [DOI] [PubMed] [Google Scholar]
- 25. Liu J, Schuff‐Werner P, Steiner M. Double transfection improves small interfering RNA‐induced thrombin receptor (PAR‐1) gene silencing in DU 145 prostate cancer cells. FEBS Lett . 2004; 1–2: 175–80. [DOI] [PubMed] [Google Scholar]
- 26. Smadja DM, Basire A, Amelot A, et al. Thrombin bound to a fibrin clot confers angiogenic and haemostatic properties on endothelial progenitor cells. J Cell Mol Med. 2008; 3: 975–86. [DOI] [PMC free article] [PubMed] [Google Scholar]
- 27. Heidemann J, Ogawa H, Dwinell MB, et al. Angiogenic effects of interleukin 8 (CXCL8) in human intestinal microvascular endothelial cells are mediated by CXCR2. J Biol Chem. 2003; 10: 8508–15. [DOI] [PubMed] [Google Scholar]
- 28. Cheng M, Li Y, Wu J, et al. IL‐8 induces imbalances between nitric oxide and endothelin‐1, and also between plasminogen activator inhibitor‐1 and tissue‐type plasminogen activator in cultured endothelial cells. Cytokine. 2008; 1: 9–15. [DOI] [PubMed] [Google Scholar]
- 29. Asahara T, Murohara T, Sullivan A, et al. Isolation of putative progenitor endothelial cells for angiogenesis. Science. 1997; 5302: 964–7. [DOI] [PubMed] [Google Scholar]
- 30. Murohara T, Ikeda H, Duan J, et al. Transplanted cord blood‐derived endothelial precursor cells augment postnatal neovascularization. J Clin Invest. 2000; 11: 1527–36. [DOI] [PMC free article] [PubMed] [Google Scholar]
- 31. Urbich C, Heeschen C, Aicher A, et al. Cathepsin L is required for endothelial progenitor cell‐induced neovascularization. Nat Med. 2005; 2: 206–13. [DOI] [PubMed] [Google Scholar]
- 32. Urbich C, Aicher A, Heeschen C, et al. Soluble factors released by endothelial progenitor cells promote migration of endothelial cells and cardiac resident progenitor cells. J Mol Cell Cardiol. 2005; 5: 733–42. [DOI] [PubMed] [Google Scholar]
- 33. Gualandris A, Rusnati M, Belleri M, et al. Basic fibroblast growth factor overexpression in endothelial cells: an autocrine mechanism for angiogenesis and angioproliferative diseases. Cell Growth Differ. 1996; 2: 147–60. [PubMed] [Google Scholar]
- 34. Goerge T, Barg A, Schnaeker EM, et al. Tumor‐derived matrix metalloproteinase‐1 targets endothelial proteinase‐activated receptor 1 promoting endothelial cell activation. Cancer Res. 2006; 15: 7766–74. [DOI] [PubMed] [Google Scholar]
- 35. Boire A, Covic L, Agarwal A, et al. PAR1 is a matrix metalloprotease‐1 receptor that promotes invasion and tumorigenesis of breast cancer cells. Cell. 2005; 3: 303–13. [DOI] [PubMed] [Google Scholar]
- 36. Yoder MC, Mead LE, Prater D, et al. Redefining endothelial progenitor cells via clonal analysis and hematopoietic stem/progenitor cell principals. Blood. 2007; 5: 1801–9. [DOI] [PMC free article] [PubMed] [Google Scholar]
- 37. Hristov M, Zernecke A, Bidzhekov K, et al. Importance of CXC chemokine receptor 2 in the homing of human peripheral blood endothelial progenitor cells to sites of arterial injury. Circ Res. 2007; 4: 590–7. [DOI] [PubMed] [Google Scholar]
- 38. Ahn HS, Chackalamannil S, Boykow G, et al. Development of proteinase‐activated receptor 1 antagonists as therapeutic agents for thrombosis, restenosis and inflammatory diseases. Curr Pharm Des. 2003; 28: 2349–65. [DOI] [PubMed] [Google Scholar]
- 39. Zania P, Kritikou S, Flordellis CS, et al. Blockade of angiogenesis by small molecule antagonists to protease‐activated receptor‐1: association with endothelial cell growth suppression and induction of apoptosis. J Pharmacol Exp Ther. 2006; 1: 246–54. [DOI] [PubMed] [Google Scholar]
- 40. Gao D, Nolan DJ, Mellick AS, et al. Endothelial progenitor cells control the angiogenic switch in mouse lung metastasis. Science. 2008; 5860: 195–8. [DOI] [PubMed] [Google Scholar]