Abstract
Cyclic AMP is a ubiquitous second messenger that orchestrates a variety of cellular functions over different timescales. The mechanisms underlying specificity within this signaling pathway are still not well understood. Several lines of evidence suggest the existence of spatial cAMP gradients within cells, and that compartmentalization underlies specificity within the cAMP signaling pathway. However, to date, no studies have visualized cAMP gradients in three spatial dimensions (3D: x, y, z).This is in part due to the limitations of FRET-based cAMP sensors, specifically the low signal-to-noise ratio intrinsic to all intracellular FRET probes. Here, we overcome this limitation, at least in part, by implementing spectral imaging approaches to estimate FRET efficiency when multiple fluorescent labels are used and when signals are measured from weakly expressed fluorescent proteins in the presence of background autofluorescence and stray light. Analysis of spectral image stacks in two spatial dimensions (2D) from single confocal slices indicates little or no cAMP gradients formed within pulmonary microvascular endothelial cells (PMVECs) under baseline conditions or following 10 min treatment with the adenylyl cyclase activator forskolin. However, analysis of spectral image stacks in 3D demonstrates marked cAMP gradients from the apical to basolateral face of PMVECs. Results demonstrate that spectral imaging approaches can be used to assess cAMP gradients—and in general gradients in fluorescence and FRET—within intact cells. Results also demonstrate that 2D imaging studies of localized fluorescence signals and, in particular, cAMP signals, whether using epifluorescence or confocal microscopy, may lead to erroneous conclusions about the existence and/or magnitude of gradients in either FRET or the underlying cAMP signals. Thus, with the exception of cellular structures that can be considered in one spatial dimension, such as neuronal processes, 3D measurements are required to assess mechanisms underlying compartmentalization and specificity within intracellular signaling pathways. © 2018 International Society for Advancement of Cytometry
Keywords: fluorescence, energy transfer, spectroscopy, hyperspectral, spFRET, cAMP, PKA, Epac, second messenger, spectral imaging
Soon after the discovery of cAMP and protein kinase A (PKA), investigators assumed the existence of cAMP gradients, localized activation of subcellular pools of PKA, and phosphorylation of specific subsets of downstream targets (1). Until recently, cAMP gradients have been inferred based upon distinct effects of different Gs-coupled agonists. Investigators were simply unable to visualize cAMP gradients in single cells. The development of Förster resonance energy transfer (FRET)-based cAMP probes offered great promise for the visualization of cAMP gradients (2–8). These probes are typically comprised a cAMP-binding domain sandwiched between a donor fluorophore and an acceptor fluorophore. Binding of cAMP triggers a conformational change that alters the distance and/or changes the orientation between the donor and acceptor, which in turn alters FRET efficiency. Changes in FRET efficiency can then be measured using a variety of intensity or lifetime imaging approaches (9–11).
However, FRET-based sensors have not fully lived up to their great promise. The primary limitation is the low signal-to-noise ratio (SNR) associated with FRET imaging. The low SNR has precluded measuring cAMP levels at multiple discrete locations within single cells. In addition, the low SNR has effectively prohibited accurate assessment of FRET distribution in 3D (x, y, z), limiting the ability to interpret localized intracellular signaling events. Thus, investigators have chosen to use 1D models such as neuronal processes to examine cAMP gradients or estimate effects of diffusion on intracellular signaling events (12,13).
To overcome the inherent low SNR of FRET probes, we have implemented spectral imaging approaches (14,15). These approaches were developed by NASA to solve remote sensing/satellite imaging problems (16,17) and offer tremendous potential for the study of biological systems (18,19). We have previously demonstrated that spectral imaging offers improved SNR for the quantification of intracellular fluorophores as well as FRET signals (20,21). Here, we demonstrate that the improved SNR allows assessment of the intracellular distribution of multiple membrane labels, non-uniform distributions of background fluorescence, and the distribution of FRET efficiencies in three spatial dimensions (3D) from a FRET-based cAMP probe. Using this 4D approach—three spatial dimensions (x, y, z) and wavelength (λ)—we were able to observe spatial cAMP gradients in three spatial dimensions. Interestingly, spectral imaging approaches reveal forskolin-induced cAMP gradients formed from the apical to basolateral face of pulmonary microvascular endothelial cells (PMVECs). Spectral unmixing of the unevenly distributed background fluorescence further increases the accuracy of FRET/cAMP measurements. Thus, this study outlines an overall approach for spectral image acquisition and image analysis that was used to quantify the 3D spatial distribution of FRET efficiency within single cells. This study also demonstrates the potential to use spectral imaging approaches to assess the intracellular distribution of second messenger signals within single cells.
Materials and Methods
Cell Preparation
Rat PMVECs were isolated from male Sprague Dawley rats by the cell culture core of the University of South Alabama Center for Lung Biology as described previously (22). Briefly, PMVECs were maintained in Dulbecco’s Modified Eagle’s Medium (DMEM; Life Technologies Inc., Carlsbad, CA) supplemented with 10% (vol/vol) fetal bovine serum (Gemini), 100 U/ml penicillin, and 100 μg/ml streptomycin, pH 7.0. Cells were grown in 100 mm culture dishes at 37°C in a humidified atmosphere of 95% air, 5% CO2. Confluent monolayers were passaged using 0.25% trypsin-EDTA (Invitrogen, Carlsbad, CA). PMVECs were seeded onto 25 mm laminin-coated round glass coverslips and were grown to 70–80% confluency (about 24 h). PMVECs were transfected with a FRET sensor, pCDNA3 plasmid encoding H188 FRET-based cAMP probe (23), using 2.5 μg plasmid, 3.75 μl Lipofectamine 3000, and 5 μl P3000 (Invitrogen) per well in serum-free media. The H188 FRET sensor consists of a cAMP-binding domain obtained from exchange protein activated by cAMP (Epac) sandwiched between a donor fluorophore, Turquoise, and an acceptor fluorophore, Venus. Transfected cells were incubated for 48 h at 37° C. For single label controls, cultured PMVECs were transfected with DNA encoding only either Turquoise (donor) fluorophores or Venus (acceptor) fluorophores.
Spectral FRET Imaging
Prior to imaging, coverslips were transferred to Attofluor holders (Thermo Fisher Scientific) and covered with 1 ml of extracellular buffer solution containing 145 mM NaCl, 4 mM KCl, 20 mM HEPES, 10 mM D-glucose, 1 mM MgCl2, and 1 mM CaCl2, at pH 7.3. Cells were labeled with 25 μM DRAQ5 for 10 minutes in order to visualize nuclei. Spectral FRET images were acquired using a Nikon A1R confocal microscope equipped with 60× water immersion objective (Plan Apo VC 60× DIC N2 WI NA-1.2; Nikon Instruments, Melville, New York) and 32 channel photomultiplier tube (PMT) spectral detector. Axially spaced (Z-stack) spectral images were collected at 1 μm intervals with a pinhole of 2 airy disk units (AU). Images were acquired using excitation wavelengths 405 (8% laser intensity = 1.82 μW at the sample stage) and 561 nm (10% intensity = 19. 02 μW at the sample stage) and emission wavelengths ranging from 414 to 724 nm in 10 nm increments. The 405 nm laser line was selected to excite the donor, Turquoise, while the 561 nm laser line was selected to excite the nuclear label, DRAQ5. Both laser lines were illuminated simultaneously for spectral acquisition. Baseline FRET (405 nm excitation) emission spectra were acquired for each Z-slice prior to addition of vehicle or the adenylyl cyclase activator forskolin (Calbiochem). Images were acquired starting at either the apical face of the cell (and stepping down) or the basolateral face of the cell (and stepping up), as indicated. Cells were exposed to vehicle or 50 μM forskolin for 10 min and the same fields of view were re-imaged using identical settings. Acquisition time was 8.7 s per Z-slice; 16–20 slices were acquired per image stack, depending on the height of the cell. The total acquisition time for a single confocal stack was 150–180 s. Experiments were performed at room temperature (20–23°C). Additionally, separate images were acquired using the 488 nm (8% laser intensity = 1.80 μW at the sample stage) laser line to directly excite the acceptor, Venus.
Spectral Library
A spectral library was compiled from individual emission spectra for each endmember (Turquoise, Venus, DRAQ5, and nonuniform background). Two different spectral libraries, a three-component library (containing the spectra of Turquoise, Venus, and DRAQ5) and a six-component library (spectra from three-component library plus spectra corresponding to background signals), were constructed as explained below to show the effect of background signal in FRET calculations.
Three-component library.
Cells expressing the H188 probe (Turquoise-Epac-Venus) were prepared as described earlier. Samples were fixed using ProLong Diamond Antifade Mountant (Thermo Fisher Scientific). Samples were excited with a 488 nm laser and the Venus spectral signature was recorded.
Samples were then excited with a 514 nm laser for 1 h to photobleach the acceptor (Venus). Samples were then excited with a 405 nm laser, and donor (Turquoise) spectral signatures were collected. The optical power output of each laser was measured for both lasers at the sample stage using a fiber-coupled spectrometer (QE65000; Ocean Optics, Inc., Largo, FL), integrating sphere (FOIS-1), and NIST-traceable calibration lamp (LS-1-CAL-INT). The spectral libraries were corrected for laser intensity and excitation efficiency differences to calculate the emission spectrum of the donor and acceptor under equimolar concentration and as would be found if excited at identical excitation wavelength (405 nm) and power settings. The pure spectrum of DRAQ5 was obtained from nontransfected cells labeled with DRAQ5. DRAQ5 spectral data were normalized to a peak intensity of unity. A spectral library containing the spectra of all end-members, Turquoise, Venus, and DRAQ5, was constructed (three-component spectral library).
Six-component library.
The three-component library described earlier was expanded to include three additional components corresponding to background signal (autofluorescence, stray light, and scattering of light). To measure background signal, a sample blank was constructed using a plain glass coverslip marked with permanent felt marker (to provide a target for focusing). The sample blank was mounted in an Attofluor holder, covered with 1 ml of extracellular buffer solution and imaged using identical settings as cultured cells. Two distinct spectral signatures were detected—one with a peak wavelength of 424 nm and a second signature with a peak wavelength at 505 nm. Regions of interest were defined to isolate the two signatures and the average spectrum of each was extracted. Another coverslip containing nonexpressing cells was excited using identical acquisition settings as described above, and a spectral image was acquired at the basolateral face of the cell—near the cell-coverslip junction—as this is where the effect of cellular autofluorescence that is likely due to extracellular matrix or laminin coating is higher. A region of interest was selected to obtain the third background spectral signature, which had a peak wavelength of 575 nm. The background spectral signatures were normalized to a peak value of unity and added to the three-component spectral library (six-component spectral library).
Spectral Analysis and FRET Calculations
The library was used to identify each individual endmember in each spectral image stack on a pixel by pixel basis. Images were unmixed using both three-component and six-component spectral libraries. Non-negatively constrained linear unmixing was implemented using custom scripts written in the MATLAB (Mathworks) programming environment. Unmixed images were smoothed using Gaussian smoothing with a [3 3 3] kernel. 4D image data were reconstructed and subsequently resliced in the XY, XZ, and YZ spatial planes using custom MATLAB scripts.
FRET efficiency was calculated using the approach described in Vogel et al. (24), which is a simplification of the approach described by Thaler et al. (25) under the assumption of 1:1 donor : acceptor stoichiometry. Briefly, when a FRET biosensor having a 1:1 stoichiometry is imaged, a single excitation laser may be used at wavelength λ (in this case, 405 nm) to measure FRET. Linear unmixing yields an unmixed image of the acceptor (aapparent) and donor (dapparent) intensities:
| 1 |
where E is the FRET efficiency, QA and QD are the quantum efficiency of the donor and acceptor. kλ is a correction factor (transfer function) defined as follows for equimolar concentrations of donor and acceptor:
and are equal to the extinction coefficients of donor and acceptor at the selected excitation wavelength (405 nm). These were calculated from the peak values listed on Nikon Microscopy U (www.microscopyu.com) and scaled according to the excitation spectrum of the fluorophore.
For FRET biosensors with a 1:1 donor : acceptor stoichiometry, the acceptor concentration is equal to donor concentration and may be written as a common variable, x:
Substituting x into Eqs. (1) and (2), rearranging and solving for E yields:
Unmixed Turquoise and Venus images were summed to yield an image representative of total fluorescent protein reporter expressing cells, regardless of FRET efficiency. The summed image was segmented using an intensity threshold to create a binary mask to allow identification of all expressing cell regions and removal of non-expressing cell regions. Similarly, the unmixed DRAQ5 image was segmented using an intensity threshold to identify all nuclear regions, which were excluded from further analysis (analysis for this study was restricted to the cell cytoplasm). The expressing cell and nuclear masks were combined to yield a final mask, which was then applied to the corresponding FRET image data. This procedure was repeated for each axial slice. A color map was then applied to visualize FRET efficiencies within the image. In some cases, FRET efficiencies were mapped into cAMP concentrations ([cAMP]) as follows:
where Kd is the cAMP dissociation constant of the FRET reporter.
Results
FRET imaging has become a standard approach for studies of intracellular signaling pathways (19,26,27). However, the inherently low SNR of FRET signals limits their utility and has precluded the evaluation of FRET efficiency in three spatial dimensions. Thus, we have utilized spectral imaging and analysis approaches (Fig. 1) to assess the intracellular distribution of FRET efficiency and cAMP gradients in three spatial dimensions. The overall approach is similar to previous spectral imaging approaches in which both the abundance of FRET donors and acceptors, as well as multiple background spectra, were unmixed to improve the sensitivity and specificity of FRET measurements (28,29). This approach allowed us to determine the spatial distribution of FRET efficiencies within cells and, therefore, to assess the underlying gradients of cAMP in three spatial dimensions.
Figure 1.
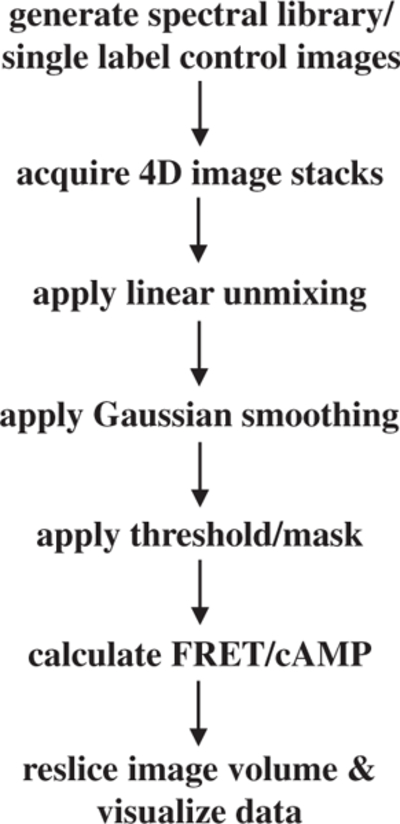
Schematic representation depicting steps involved in determining the spatial distribution of intracellular FRET.
Spectral Libraries
Three-component and six-component spectral libraries containing Turquoise, Venus, and DRAQ5 (Fig. 2A–C) or Turquoise, Venus, DRAQ5, and the three background fluorescence signatures (Fig. 2A–F) were constructed as described in the “Materials and Methods” section. These spectral libraries were used for all subsequent image analyses.
Figure 2.
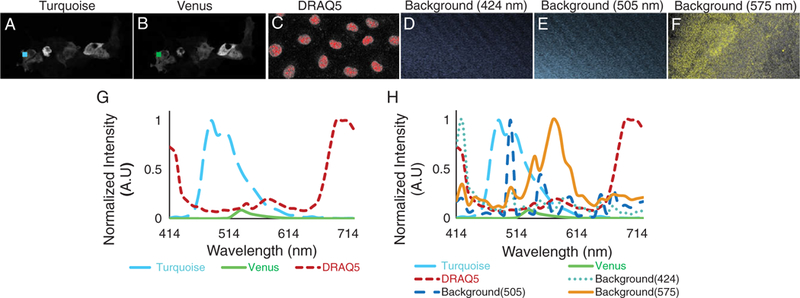
Images of single-labeled control samples of Turquoise (A), Venus (B), and DRAQ5 (C) and corresponding regions of interest (colored regions) were used to construct a three-component spectral library (G). We observed that a sample blank (unlabeled coverslip) exhibited weak background signal with two different spectral signatures—one with a peak wavelength of 424 nm and the other at 505 nm. We selected regions of interest corresponding to these background signatures (D and E), extracted spectra from the regions, and named the background spectra according to their peak wavelength value (424 and 505 nm, respectively). We also observed a fluorescence component with a peak wavelength of 575 nm, likely due to the cellular or matrix autofluorescence (F). Extracted spectra from each region of interest for both single-label controls and background spectra were used to construct the six-component library (H). [Color figure can be viewed at wileyonlinelibrary.com]
Three-component library.
Spectral image data were unmixed to calculate abundances of individual endmembers using the three-component library (Fig. 3). To visually inspect image quality, an image midway through the cell was selected. A region within the cytoplasm was selected, and the average abundance of each endmember was calculated. Abundances were multiplied by pure spectra from the spectral library (Fig. 3D) to obtain the spectral contributions of each component in the region (Fig. 3E). The average measured spectrum of the region was calculated for the raw spectral image data (Fig. 3F), and the measured spectrum was compared with the sum of the unmixed signatures to visualize the goodness of fit for linear unmixing. The root-mean square error (RMSE) was also calculated, as a measure of goodness of fit for the region, and was 12.8 (arbitrary units).
Figure 3.
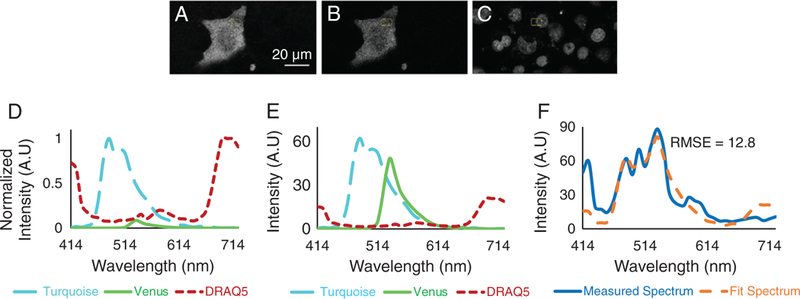
Unmixed Turquoise (A), Venus (B), and DRAQ5 (C) images obtained by non-negatively constrained linear unmixing of raw spectral image data with a three-component library (D). Note that the DRAQ5 unmixed image was linearly scaled to an 8-bit range for visualization purposes only. A region of interest was selected, and average abundances of each endmember were measured. The estimated contributions of each endmember were plotted (E), and the sum of endmember contributions was compared to the measured spectrum (F). The root-mean square error (RMSE) was calculated between the sum of endmember contributions and the measured spectrum (RMSE = 12.8 AU). [Color figure can be viewed at wileyonlinelibrary.com]
Six-component library.
Spectral image data were also unmixed using a six-component library that included background signatures with relative peak intensities at 424, 505, and 575 nm. An image midway through the cell was selected for visual inspection. Unmixing resulted in the following six endmember images: Turquoise (Fig. 4A), Venus (Fig. 4B), DRAQ5 (Fig. 4C), Background—424 nm peak (Fig. 4D), Background—505 nm peak (Fig. 4E), and Background—575 nm peak (Fig. 4F). The region of interest used in the analysis of the three-component library unmixed images (above) was also used for the six-component library unmixed images, and average abundances for each endmember were measured and used to calculate spectral contributions of each endmember (Fig. 4G). The sum of endmember contributions was then compared with the measured spectrum visually (Fig. 4H). The RMSE between measured and fit spectra was 6.8, a twofold decrease in fitting error than was returned with the three-component library. Thus, the six-component library was used to analyze data in subsequent figures.
Figure 4.
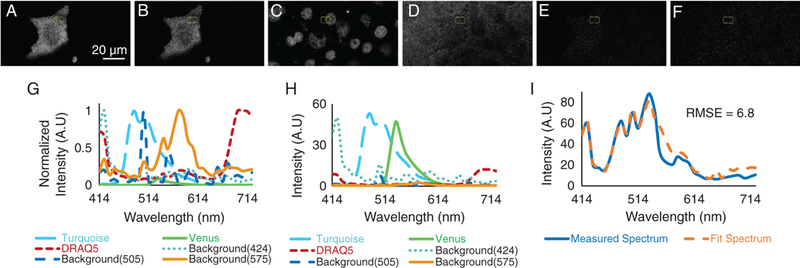
Unmixed images of Turquoise (A), Venus (B), DRAQ5 (C), backgrounds—424 nm peak (D), 505 nm peak (E), and 575 nm peak (F) were obtained by non-negatively constrained linear unmixing of raw spectral image data with a six-component library (G). Note that the DRAQ5 unmixed image was linearly scaled to an 8-bit range for visualization purposes only. The region of interest used in Figure 3 was selected, and average abundances of each endmember were measured. The estimated contributions of each endmember were plotted (H), and the sum of endmember contributions was compared to the measured spectrum (I). The root-mean square error (RMSE) was calculated between the sum of endmember contributions and the measured spectrum (RMSE = 6.8 AU). [Color figure can be viewed at wileyonlinelibrary.com]
The distributions of Turquoise, Venus, DRAQ5, and 424, 505, and 575 nm background signals are depicted in Figure 5, columns A–F, respectively. The eight slices are representative samples of 12 total slices imaged from apical (slice 1) to coverslip (slice 12) at 1 μm intervals. All panels were scaled equally. It is apparent that the background fluorescence signals have nonuniform distributions in plane as well as axially, and hence could not be compensated for by simple background subtraction or a correction factor.
Figure 5.
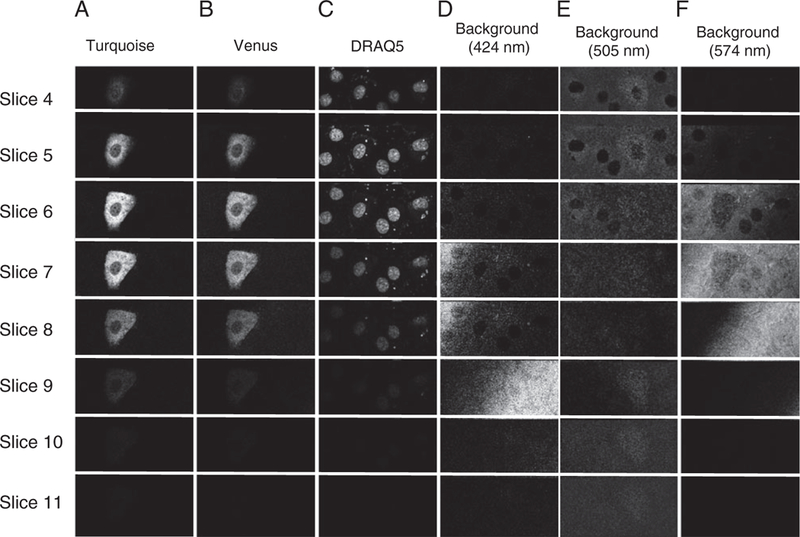
Axial distribution of unmixed fluorescence signals in pulmonary microvascular endothelial cells (PMVECs). Data were acquired at 1 μm axial intervals (z slices) starting above the top of the cell (slice 1) and continuing through the bottom of the cell (slice 12). Slices 4–11 are shown. Columns A–F represent unmixed Turquoise, Venus, DRAQ5, and background signals with peaks at 424, 505, and 575 nm, respectively. Intensity data were visualized using identical look-up tables for each column. These data demonstrate axial variations in intensity for both the exogenous fluorophores and background signals.
3D Construction and Reslicing
Images were visualized in 3D using NIS Elements software, for both raw and unmixed spectral image data (Fig. 6A, B). The increased SNR provided by spectral imaging/linear unmixing is readily apparent (compare Fig. 6A,B). This observation is consistent with prior work in which we demonstrated that the SNR of spectrally unmixed images is typically higher than raw spectral image data (30). We resliced the 3D image in the following three orthogonal planes: XY, XZ, and YZ (Fig. 6C–E, respectively), allowing visualization of the intracellular FRET distribution.
Figure 6.
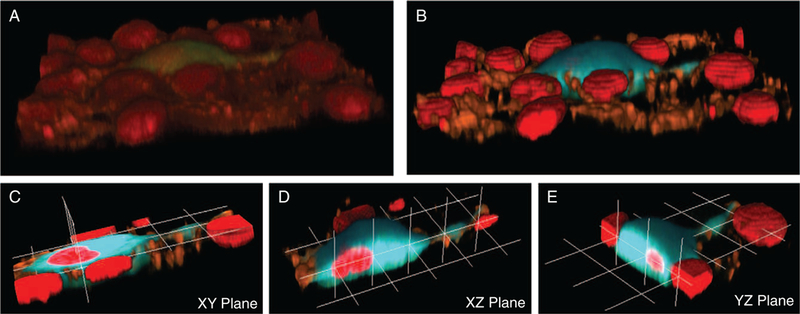
Schematic representation showing the 3D reconstruction and reslicing process. (A) Raw spectral Z-stacks. (B) Unmixed and false-colored image stacks. The unmixed image was then resliced in three orthogonal planes: XY (C), XZ (D), and YZ (E). 3D reconstruction and reslicing were performed using custom made MATLAB scripts. 3D visualization was performed using NIS Elements software. [Color figure can be viewed at wileyonlinelibrary.com]
Estimation of FRET Efficiency
The FRET efficiency was calculated for each pixel in the resliced images using unmixed Turquoise and Venus images (Fig. 7). Calculation of FRET values is ratiometric and very sensitive to background signatures and noise for regions where the FRET reporter is not present—these are regions where any FRET value calculated is in essence an artifact because no FRET reporter is present in these regions (Fig. 7D, regions outside of the expressing cell). Thus, we applied a mask (Fig. 7E) to exclude extracellular and nuclear regions. We excluded the nucleus of the cell, as it is questionable as to whether the FRET reporter diffuses freely across the nuclear membrane. The resulting image of FRET efficiency is represented in Figure 7F. A color map was applied to the FRET efficiencies to facilitate visualization (Fig. 7G).
Figure 7.
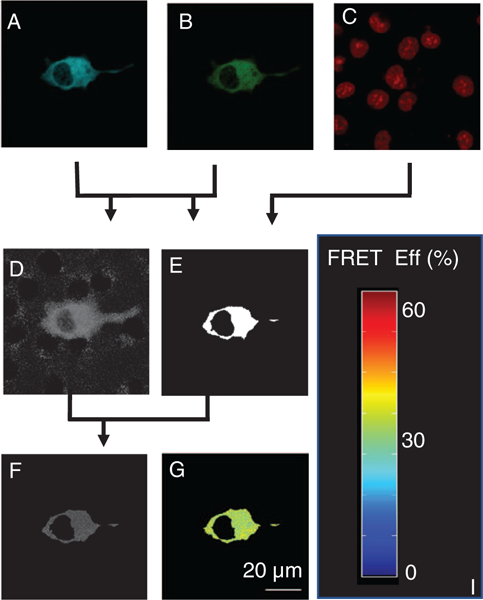
Outline of the process for FRET calculation. Turquoise (A) and Venus (B) images were used to calculate FRET (D), and the sum of Turquoise + Venus images used to calculate the mask (E); DRAQ5 (C) was used to visualize and subsequently mask nuclear regions. (E) The mask was used to exclude extracellular and nuclear regions from the FRET image. (F) The FRET efficiencies were then visualized using a custom colormap (G). [Color figure can be viewed at wileyonlinelibrary.com]
Forskolin-Induced Gradients in FRET Efficiency and [cAMP]
FRET efficiency was calculated for each resliced image. Treatment with 50 μM forskolin for 10 min triggered a decrease in FRET efficiency indicative of increased intracellular [cAMP]. Before treatment, only modest spatial variations (spatial gradients) in FRET efficiency were observed (Fig. 8). However, forskolin-induced changes in FRET efficiency were larger at the apical face than the basolateral face of the cell, indicating an apical-to-basolateral spatial gradient in [cAMP] (Figs. 8 and 9 and Supporting Information Fig. S1). Similar results were obtained regardless of whether images were acquired starting at the basolateral face (bottom) of the cell and moving the image plane up or starting at the apical face (top) and moving the image plane down (Supporting Information Figs. S3 and S4). In addition, unmixed donor images were evaluated for photobleaching as a function of Z-stack acquisition direction and demonstrated negligible effects of photobleaching (Supporting Information Fig. S5). Thus, observed FRET gradients were not artifacts induced by the order in which Z-slices were acquired. We next mapped FRET efficiency into relative units of [cAMP], as described in the “Materials and Methods” section, to visualize underlying cAMP gradients (Fig. 8). These data confirmed that cAMP spatial gradients were formed from the apical to the basolateral face of the cell.
Figure 8.
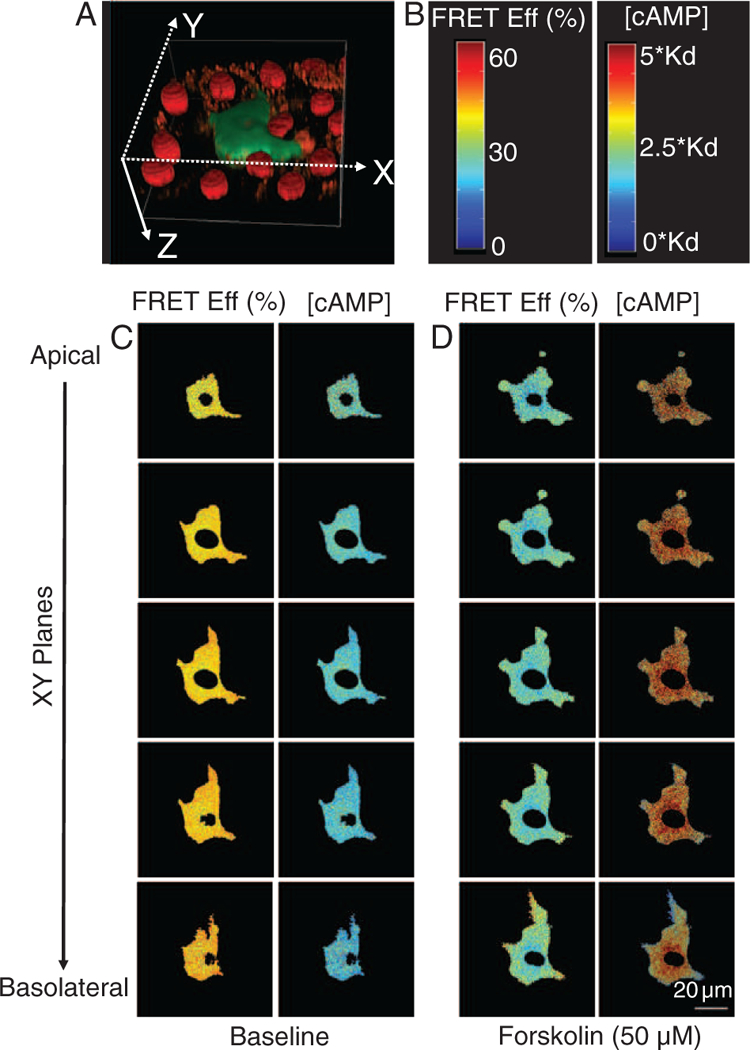
FRET efficiencies and [cAMP] at baseline and after 50 μM forskolin treatment in pulmonary microvascular endothelial cells (PMVECs). (A) Reconstructed 3D shape of a PMVEC. (B) Color bars indicating the magnitude of FRET efficiency (left) and [cAMP] (right). (C) The volume depicted in (A) was resliced in the Z direction to obtain XY planes, arranged from apical (top) to basolateral (bottom). FRET and corresponding cAMP gradients are shown for five contiguous XY slices. The left two columns display FRET efficiency and [cAMP] at baseline conditions while the right two columns display FRET efficiency and [cAMP] 10 minutes after treatment with 50 μM forskolin. At baseline conditions, the FRET efficiency is high and [cAMP] is low, indicating little or no spatial cAMP gradient. (D) Following a 10 minute treatment with 50 μM forskolin, the FRET efficiency was reduced and [cAMP] was increased. In addition, subtle spatial gradients in FRET and [cAMP] were observed in the radial direction, while more pronounced FRET and [cAMP] spatial gradients were observed from the apical to basolateral face of the cell. The scale bar (lower right panel) represents 20 μm. [Color figure can be viewed at wileyonlinelibrary.com]
Figure 9.
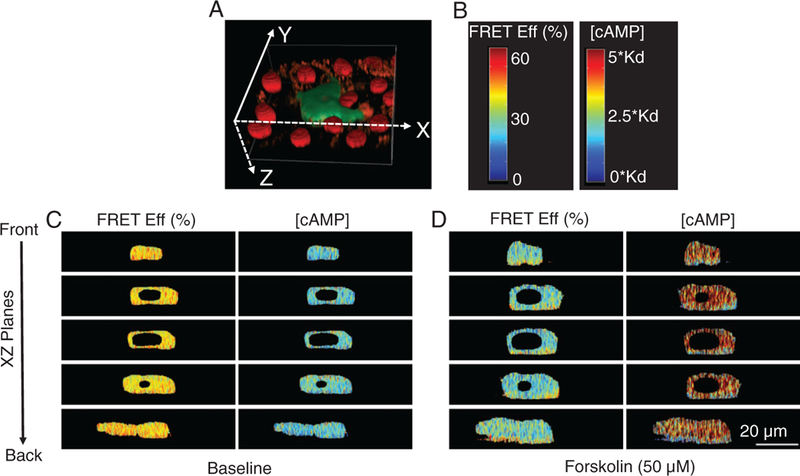
FRET efficiencies and cAMP levels from five slices in the XZ plane through a single pulmonary microvascular endothelial cell (PMVEC). (A) 3D depiction of a cell expressing the H188 cAMP probe. (B) The color bars depicting the FRET efficiency and cAMP color scales for resliced images. (C) XZ slices are displayed from top to bottom corresponding as front to back in the cell. Minimal FRET and cAMP spatial gradients were observed at baseline conditions. (D) Treatment with 50 μM forskolin for 10 minutes triggered pronounced spatial gradients in FRET efficiency and [cAMP] from the apical to basolateral face of the cell. These data demonstrate the potential for 4D spectral approaches to measure the intracellular distribution of second messenger signals. The scale bar (lower right panel) indicates 20 μm. [Color figure can be viewed at wileyonlinelibrary.com]
In order to visualize apical to basolateral spatial gradients in FRET efficiency, we also resliced images in the XZ and YZ planes. Resliced images of single cells at baseline conditions indicate little or no gradient in FRET efficiency and [cAMP]. In contrast, images of resliced XZ planes of forskolin-treated cells display axial spatial gradients in FRET efficiency (Fig. 9). Similarly, resliced images in the YZ plane demonstrate little or no spatial gradient in FRET efficiency or [cAMP] (Supporting Information Fig. S1) at baseline conditions but pronounced gradients following forskolin treatment.
Discussion
FRET measurements have found great utility for the quantitative analysis of intracellular events. This utility has been extended by the development of a wide range of fluorescent proteins, facilitating the use of FRET probes for live cell studies. However, FRET measurements have also been fraught with low SNR when compared with single label measurements (14,15,19,29). SNR may be further reduced when using fluorescent protein-based FRET reporters, due to limitations in expression levels and quantum efficiencies. In this case, measured donor and acceptor signals may be weak, even of similar magnitude as background signals, and changes in noise characteristics or nonuniform background signal can greatly affect the accuracy of FRET measurements.
Here, we have described an approach for measuring FRET signals while accounting for nonuniform background signals when performing spectral imaging FRET microscopy. This approach is especially helpful when donor and acceptor signals are weak or when evaluating localized FRET efficiency in three spatial dimensions. This approach is similar to that previously described by Levy et al. (29), in which the authors accounted for background spectral signatures allowing improved spectral unmixing of donor and acceptor fluorophores. Improved estimation of donor and acceptor abundance images results in improving the ability to segment donor + acceptor images as well as improved reliability of calculated FRET efficiency values.
We have shown that the unmixing error associated with an expanded six-component library was less than the error associated with a three-component library that did not contain the background signatures. Two background spectral signatures from the six-component library were measured from sample blanks (424 and 505 nm) and are likely due to a combination of: coatings on the coverslip, laser backscatter off of the coverslip, and spectral cross-talk. The third “background” spectrum (575 nm) was only observed in coverslips with cells and may be due to the autofluorescence of extracellular matrix deposited by the cells. Reductions in the unmixing error can be seen visually (compare Fig. 3F,H), or by comparing the RMSE and % RMSE values. We did observe a decrease in the accuracy of fit at near the 550 nm range that is likely due to decreased spectral sampling at 560–570 nm. This is because two laser lines were used for sample excitation: 405 and 561 nm. However, when laser lines are used with the spectral detector on the Nikon A1R spectral confocal microscope, there is a mechanical finger that moves in front of each specific detector element corresponding to the laser illumination wavelength. This serves to protect the detector from high-power reflected laser light. This mechanical finger also produces a spectral artifact that appears as a notch in the spectrum at 561 nm. To remove this artifact, we disabled the acquisition of data from the detector element spanning 560–570 nm. Hence, the detected spectral image data skipped from the 550–560 nm channel to the 570–580 nm channel, introducing reduced accuracy around the 550 nm range.
Reductions in unmixing error, associated with the six-component library, were also seen across experiments from multiple cell lines (Supporting Information Fig. S6). This is a mathematically intuitive result: if more diverse signatures are available in the spectral library, the least squares fitting approach should return a fit with reduced error. In fact, this process could easily be taken to the extreme, by trying to account for too many spectra in the spectral library. This would result in a near 0% RMSE but would also likely provide a poor representation of the molecular contributors that generated the measured spectrum, as the solution set would be over-specified and could provide a nonunique solution. However, the converse case is also possible, in which there are not enough components in the spectral library to accurately account for the measured spectral image data. Given the poor fit of the three-component spectral library to measured data (Fig. 3), it is likely that background signals make a non-negligible contribution to the measured spectral data. To further examine the effects of accounting for multiple background signatures, we performed spectral unmixing and FRET analysis using all combinations of 1, 2, or 3 of the background signatures in the spectral library for a single Z-axis slice (Supporting Information Fig. S7). For the selected axial plane, which was near the basolateral surface of the cell, the 575 nm background signature had the highest contribution to the total measured signal. Not accounting for the 575 nm background signature resulted in a decreased image analysis confidence and poor segmentation. Interestingly, when examining images from near the apical surface of the cell, the 505 nm background signature had the highest contribution to total measured signal. To further visualize the effects of including all three background signatures in the spectral library, we compared axial, YZ image reconstructions for a range of X locations (from left to right in the cell) as a function of unmixing with the six-component library that included all three background signatures, a four-component library that included only the most prominent background signature (the signature with a 424 nm peak), and a three-component library that included no background signatures (Supporting Information Fig. S2). We found that in the images generated by unmixing with the four-component and three-component libraries, it was not possible to separate the cells from nearby ECM-associated background autofluorescence, whereas a clean separation of the cells and background autofluorescence was possible when using the six-component library that accounted for multiple background spectral signatures.
To investigate the improvement in 3D spectral FRET measurements when appropriately accounting for background signatures, we calculated FRET efficiency histograms for Z-slices at the apical and basolateral faces of a cell, using unmixed images from either the three-component or the six-component spectral library (Supporting Information Fig. S8). FRET efficiency histograms for the six-component library were unimodal and similar for both the apical and basolateral faces of the cell. However, for the three-component library, autofluorescence signatures near the basolateral face of the cell interfered with FRET calculations and segmentation, producing a bi-modal FRET efficiency histogram. Thus, for these studies, the spectral library that did not account for background signatures was under-defined and resulted in FRET efficiency and segmentation inaccuracies. In addition, when reasonable, it is important to account for more than one background signature, as background contributions may vary laterally and axially within the three spatial dimensions.
We then used the spectral imaging approaches described here to assess spatial gradients in FRET efficiency in three spatial dimensions. The magnitude of these gradients is of particular note because we used a high forskolin concentration (50 μM) to activate adenylyl cyclase, indicating that substantial cAMP gradients are maintained even when particulate adenylyl cyclases are activated throughout the plasma membrane. To our knowledge, these are the first observations of 3D cAMP gradients in live cells. This result is consistent with previous studies in which cAMP spatial gradients in PMVECs (31–34) and other cell types (2–8,35–41) were inferred based upon the measurement of [cAMP] or activity at different subcellular locations. Recently, FRET-based biosensors were used in 2D to target specific macromolecular complexes or subcellular structures allowing measurement of localized cAMP signaling events. In each case, the authors observed significant differences in cAMP signal responses between the different macromolecular/subcellular regions. These results suggest that cAMP signals measured in different cellular locales can vary and that these kinetic variations may be attributed to diffusional restrictions, such as could be caused by intracellular compartments (compartmentalized signaling) (37,38,42). However, targeting a FRET reporter to specific intracellular locations can also result in high localized concentrations of the reporter, which may result in measurement artifacts such as self-quenching and intra- or intermolecular FRET. In light of these limitations, we sought to implement an alternate approach using 3D spectral FRET imaging to visualize spatial variations in cAMP concentrations, while achieving a more uniform distribution of FRET reporter concentrations. Interestingly, we observed that gradients in XZ and YZ planes are as great as or greater than those observed within the XY plane, demonstrating the need for evaluating intracellular signaling pathways in three spatial dimensions. The observation of 3D spatial gradients in cAMP is consistent with cAMP gradients previously predicted by mathematical modeling of PMVECs (31). These results also indicate that previous studies using FRET reporters may have underestimated the magnitude of cAMP gradients.
It is important to note that the acquisition settings used in this study were selected to provide a balance between XY resolution, Z resolution and Z-axis sampling, temporal resolution, spectral resolution, and photobleaching. While enhanced performance could be obtained for any one of these parameters, it would come at the cost of decreased performance for other parameters. For example, the confocal pinhole diameter of 2 AU and Z-axis sampling of 1 μm do not produce diffraction-limited X, Y, or Z resolution. On this instrument, the coarse sampling was necessary to produce minimal photobleaching and a reasonable image acquisition time. In future work, given recent advancements in spectral imaging and analysis approaches, we expect to have the technical ability to assess time-resolved, 3D intracellular signals (19). This will be particularly important in assessing intracellular cAMP gradients within intact tissues.
In conclusion, we have for the first time visualized spectral spatial gradients in FRET efficiency in three spatial dimensions in single cells. These measurements allowed us to calculate the underlying spatial gradients in [cAMP]. These data not only demonstrate the need to assess intracellular signaling systems in three spatial dimensions but also demonstrate that the potential of FRET-based probes to assess spatially encoded signaling information can be greatly exploited. However, care must be taken in assessing gradients in FRET efficiency. Here, we demonstrate the need for a correction approach that includes adding background signatures to the spectral library. Effects of nonuniform background signatures on the estimation of FRET efficiencies are particularly relevant in assessing 3D gradients in FRET efficiency. As expected, the background spectral signatures due to the coverslip were most prevalent in confocal sections near the coverslip. Hence, artifacts associated with the coverslip would substantively alter apparent gradients in FRET efficiency. If implemented appropriately, correctly defining the spectral library will result in increased confidence in the spectral unmixing algorithm, increased reliability of downstream image processing steps such as segmentation, increased accuracy of resultant FRET calculations, and thus, more accurate assessment of intracellular spatial distributions of FRET efficiency.
Supplementary Material
Acknowledgments
We would like to acknowledge use of the vectorized version of the non-negatively constrained linear unmixing algorithm and helpful discussions on the MATLAB code with David Provencher (Université de Sherbrooke). The lsqnonneg MATLAB algorithm is available on the MATLAB Central website (MATLAB Central; https://www.mathworks.com/matlabcentral/).
Grant sponsor: American Heart Association; Grant number: 16PRE27130004; Grant sponsor: National Science Foundation; Grant number: 1725937; Grant sponsor: NIH, Grant numbers: T32HL076125, S100D020149, S10RR027535, R01HL058506, P01HL066299
Footnotes
Additional Supporting Information may be found in the online version of this article.
Literature Cited
- 1.Steinberg SF, Brunton LL. Compartmentation of G protein-coupled signaling pathways in cardiac myocytes. Annu Rev Pharmacol Toxicol 2001;41:751–773. [DOI] [PubMed] [Google Scholar]
- 2.Corbin JD, Sugden P, Lincoln TM, Keely S. Compartmentalization of adenosine 3’: 5’-monophosphate and adenosine 3’:5’-monophosphate-dependent protein kinase in heart tissue. J Biol Chem 1977;252:3854–3861. [PubMed] [Google Scholar]
- 3.Brunton L, Hayes J, Mayer S. Functional compartmentation of cyclic AMP and protein kinase in heart. Adv Cyclic Nucleotide Res 1980;14:391–397. [PubMed] [Google Scholar]
- 4.Jurevicius J, Fischmeister R. cAMP compartmentation is responsible for a local activation of cardiac Ca2+ channels by beta-adrenergic agonists. Proc Natl Acad Sci USA 1996;93:295–299. [DOI] [PMC free article] [PubMed] [Google Scholar]
- 5.Rich TC, Fagan KA, Nakata H, Schaack J, Cooper DMF, Karpen JW. Cyclic nucleotide-gated channels colocalize with adenylyl cyclase in regions of restricted cAMP diffusion. J Gen Physiol 2000;116:147–162. [DOI] [PMC free article] [PubMed] [Google Scholar]
- 6.Rich TC, Fagan KA, Tonia ET, Schaack J, Cooper DM, Karpen JW. A uniform extracellular stimulus triggers distinct cAMP signals in different compartments of a simple cell. Proc Natl Acad Sci USA 2001;98:13049–13054. [DOI] [PMC free article] [PubMed] [Google Scholar]
- 7.Xin W, Feinstein WP, Britain AL, Ochoa CD, Zhu B, Richter W, Leavesley SJ, Rich TC. Estimating the magnitude of near-membrane PDE4 activity in living cells. Am J Physiol Cell Physiol 2015;309:C415–C424. [DOI] [PMC free article] [PubMed] [Google Scholar]
- 8.Mongillo M, McSorley T, Evellin S, Sood A, Lissandron V, Terrin A, Huston E, Hannawacker A, Lohse MJ, Pozzan T. Fluorescence resonance energy transfer-based analysis of cAMP dynamics in live neonatal rat cardiac myocytes reveals distinct functions of compartmentalized phosphodiesterases. Circ Res 2004;95:67–75. [DOI] [PubMed] [Google Scholar]
- 9.Jalink K, van Rheenen J. FilterFRET: Quantitative imaging of sensitized emission. Lab Tech Biochem Mol Biol 2009;33:289–349. [Google Scholar]
- 10.Kedziora KM, Jalink K. Fluorescence resonance energy transfer microscopy (FRET). Adv Fluoresc Microsc Methods Protoc 2015;1251:67–82. [DOI] [PubMed] [Google Scholar]
- 11.Goedhart J, Hink MA, Jalink K. An introduction to fluorescence imaging techniques geared towards biosensor applications. Fluoresc Protein Based Biosens Methods Protoc MIMB 2014;1071:17–28. [DOI] [PubMed] [Google Scholar]
- 12.Neves SR, Tsokas P, Sarkar A, Grace EA, Rangamani P, Taubenfeld SM, Alberini CM, Schaff JC, Blitzer RD, Moraru II. Cell shape and negative links in regulatory motifs together control spatial information flow in signaling networks. Cell 2008;133:666–680. [DOI] [PMC free article] [PubMed] [Google Scholar]
- 13.Li L, Gervasi N, Girault J-A. Dendritic geometry shapes neuronal cAMP signalling to the nucleus. Nat Commun 2015;6:article 6319. [DOI] [PMC free article] [PubMed] [Google Scholar]
- 14.Leavesley SJ, Britain A, Cichon LK, Nikolaev VO, Rich TC. Assessing FRET using spectral techniques. Cytometry Part A 2013;83A:898–912. [DOI] [PMC free article] [PubMed] [Google Scholar]
- 15.Leavesley SJ, Rich TC. Overcoming limitations of FRET measurements. Cytometry Part A 2016;89A:325–327. [DOI] [PMC free article] [PubMed] [Google Scholar]
- 16.Fink DJ. Monitoring earth’s resources from space. Technol Rev 1973;75:32–41. [Google Scholar]
- 17.Goetz AFH, Vane G, Solomon JE, Rock BN. Imaging spectrometry for earth remote sensing. Science 1985;228:1147–1152. [DOI] [PubMed] [Google Scholar]
- 18.Harris AT. Spectral mapping tools from the earth sciences applied to spectral microscopy data. Cytometry Part A 2006;69A:872–879. [DOI] [PubMed] [Google Scholar]
- 19.Rich TC, Webb KJ, Leavesley SJ. Can we decipher the information content contained within cyclic nucleotide signals? J Gen Physiol 2014;143:17–27. [DOI] [PMC free article] [PubMed] [Google Scholar]
- 20.Favreau PF, Hernandez C, Lindsey AS, Alvarez DF, Rich TC, Prabhat P, Leavesley SJ. Thin-film tunable filters for hyperspectral fluorescence microscopy. J Biomed Opt 2014;19:011017–011017. [DOI] [PMC free article] [PubMed] [Google Scholar]
- 21.Leavesley SJ, Annamdevula N, Boni J, Stocker S, Grant K, Troyanovsky B, Rich TC, Alvarez DF. Hyperspectral imaging microscopy for identification and quantitative analysis of fluorescently-labeled cells in highly autofluorescent tissue. J Biophotonics 2012;5:67–84. [DOI] [PMC free article] [PubMed] [Google Scholar]
- 22.King J, Hamil T, Creighton J, Wu S, Bhat P, McDonald F, Stevens T. Structural and functional characteristics of lung macro- and microvascular endothelial cell phenotypes. Microvasc Res 2004;67:139–151. [DOI] [PubMed] [Google Scholar]
- 23.Klarenbeek J, Goedhart J, van Batenburg A, Groenewald D, Jalink K. Fourth-generation Epac-based FRET sensors for cAMP feature exceptional brightness, photostability and dynamic range: Characterization of dedicated sensors for FLIM, for ratiometry and with high affinity. PLoS One 2015;10:e0122513. [DOI] [PMC free article] [PubMed] [Google Scholar]
- 24.Vogel SS, Blank PS, Koushik SV, Thaler C. Spectral imaging and its use in the measurement of Förster resonance energy transfer in living cells. Lab Tech Biochem Mol Biol 2009;33:351–394. [Google Scholar]
- 25.Thaler C, Koushik SV, Blank PS, Vogel SS. Quantitative multiphoton spectral imaging and its use for measuring resonance energy transfer. Biophys J 2005;89:2736–2749. [DOI] [PMC free article] [PubMed] [Google Scholar]
- 26.Oldach L, Zhang J. Genetically encoded fluorescent biosensors for live-cell visualization of protein phosphorylation. Chem Biol 2014;21:186–197. [DOI] [PMC free article] [PubMed] [Google Scholar]
- 27.Giepmans BN, Adams SR, Ellisman MH, Tsien RY. The fluorescent toolbox for assessing protein location and function. Science 2006;312:217–224. [DOI] [PubMed] [Google Scholar]
- 28.Zhang J, Lin F, Chai L, Wei L, Chen T. IIem-spFRET: Improved Iem-spFRET method for robust FRET measurement. J Biomed Opt 2016;21:105003–105003. [DOI] [PubMed] [Google Scholar]
- 29.Levy S, Wilms CD, Brumer E, Kahn J, Pnueli L, Arava Y, Eilers J, Gitler D. SpRET: Highly sensitive and reliable spectral measurement of absolute FRET efficiency. Microsc Microanal 2011;17:176–190. [DOI] [PubMed] [Google Scholar]
- 30.Annamdevula NS, Sweat B, Favreau P, Lindsey AS, Alvarez DF, Rich TC, Leavesley SJ. An approach for characterizing and comparing hyperspectral microscopy systems. Sensors 2013;13:9267–9293. [DOI] [PMC free article] [PubMed] [Google Scholar]
- 31.Feinstein WP, Zhu B, Leavesley SJ, Sayner SL, Rich TC. Assessment of cellular mechanisms contributing to cAMP compartmentalization in pulmonary microvascular endothelial cells. Am J Physiol Cell Physiol 2012;302:C839–C852. [DOI] [PMC free article] [PubMed] [Google Scholar]
- 32.Sayner SL, Balczon R, Frank DW, Cooper DM, Stevens T. Filamin A is a phosphorylation target of membrane but not cytosolic adenylyl cyclase activity. Am J Physiol Lung Cell Mol Physiol 2011;301:L117–L124. [DOI] [PMC free article] [PubMed] [Google Scholar]
- 33.Sayner SL, Alexeyev M, Dessauer CW, Stevens T. Soluble adenylyl cyclase reveals the significance of cAMP compartmentation on pulmonary microvascular endothelial cell barrier. Circ Res 2006;98:675–681. [DOI] [PubMed] [Google Scholar]
- 34.Sayner SL, Frank DW, King J, Chen H, VandeWaa J, Stevens T. Paradoxical cAMP-induced lung endothelial hyperpermeability revealed by Pseudomonas aeruginosa ExoY. Circ Res 2004;95:196–203. [DOI] [PubMed] [Google Scholar]
- 35.Piggott LA, Hassell KA, Berkova Z, Morris AP, Silberbach M, Rich TC. Natriuretic peptides and nitric oxide stimulate cGMP synthesis in different cellular compartments. J Gen Physiol 2006;128:3–14. [DOI] [PMC free article] [PubMed] [Google Scholar]
- 36.Mika D, Leroy J, Vandecasteele G, Fischmeister R. PDEs create local domains of cAMP signaling. J Mol Cell Cardiol 2012;52:323–329. [DOI] [PubMed] [Google Scholar]
- 37.Terrin A, Di Benedetto G, Pertegato V, Cheung Y-F, Baillie G, Lynch MJ, Elvassore N, Prinz A, Herberg FW, Houslay MD. PGE1 stimulation of HEK293 cells generates multiple contiguous domains with different [cAMP]: Role of compartmentalized phosphodiesterases. J Cell Biol 2006;175:441–451. [DOI] [PMC free article] [PubMed] [Google Scholar]
- 38.Agarwal SR, Miyashiro K, Latt H, Ostrom RS, Harvey RD. Compartmentalized cAMP responses to prostaglandin EP2 receptor activation in human airway smooth muscle cells. Br J Pharmacol 2017;174:2784–2796. [DOI] [PMC free article] [PubMed] [Google Scholar]
- 39.Warrier S, Ramamurthy G, Eckert RL, Nikolaev VO, Lohse MJ, Harvey RD. cAMP microdomains and L-type Ca2+ channel regulation in guinea-pig ventricular myocytes. J Physiol 2007;580:765–776. [DOI] [PMC free article] [PubMed] [Google Scholar]
- 40.Iancu RV, Jones SW, Harvey RD. Compartmentation of cAMP signaling in cardiac myocytes: A computational study. Biophys J 2007;92:3317–3331. [DOI] [PMC free article] [PubMed] [Google Scholar]
- 41.Blackman BE, Horner K, Heidmann J, Wang D, Richter W, Rich TC, Conti M. PDE4D and PDE4B function in distinct subcellular compartments in mouse embryonic fibroblasts. J Biol Chem 2011;286:12590–12601. [DOI] [PMC free article] [PubMed] [Google Scholar]
- 42.Surdo NC, Berrera M, Koschinski A, Brescia M, Machado MR, Carr C, Wright P, Gorelik J, Morotti S, Grandi E. FRET biosensor uncovers cAMP nano-domains at β-adrenergic targets that dictate precise tuning of cardiac contractility. Nat Commun 2017;8:15031. [DOI] [PMC free article] [PubMed] [Google Scholar]
Associated Data
This section collects any data citations, data availability statements, or supplementary materials included in this article.


