

Abstract
Objectives
This study investigates whether administration of low doses of Gadolinium-based contrast agent (GBCA) for dynamic contrast enhanced (DCE) MRI can be as effective as a standard dose in distinguishing prostate cancer (PCa) from benign tissue. In addition, we evaluated the combination of kinetic parameters from the low and high dose injection as a new diagnostic marker.
Materials and Methods
Patients (n=17) with histologically confirmed PCa underwent preoperative 3T MRI. DCE-MR images were acquired at 8.3s temporal resolution with a low dose (0.015mmol/kg) and close to the standard dose (0.085mmol/kg) of gadobentate dimeglumine bolus injections. Low dose images were acquired for 3.5 min, followed by a 5 min gap before acquiring standard dose images for 8.3 min. The data was analyzed qualitatively to investigate whether lesions could be detected based on early focal enhancement and quantitatively by fitting signal intensity as a function of time with an empirical mathematical model to obtain a maximum enhancement projection (MEP) and signal enhancement rate (α).
Results
Both low and standard dose DCE-MRI showed similar sensitivity (13/26 = 50%) and lesion conspicuity score (4.0 ± 1.0 vs 4.2 ± 0.9, p = 0.317) for PCa diagnosis on qualitative analysis. PCa showed significantly increased α compared to benign tissue for low (9.98±5.84 vs 5.12±2.95s−1), but not for standard dose (4.27±2.20 vs 3.35±1.48s−1). The ratio of low dose α to standard dose α was significantly greater (p=0.02) for PCa (2.8±2.3) than for normal prostate (1.6±0.9), suggesting changes in water exchange and T2* effects associated with cancer. In addition, decreases in the percentage change in T1 relaxation rate as a function of increasing contrast media concentration (i.e. the ‘saturation effect’) can also contribute to the observed differences in high dose and low dose α. Area under the ROC curve for differentiating PCa from benign tissue using α was higher for low dose (0.769) compared to standard dose (0.625). There were no significant differences between MEP calculated for PCa and normal tissue at the low and standard doses. Moderate significant Pearson correlation for DCE parameters: MEP (r=0.53) and α (r=0.58) was found between low and standard doses of GBCA.
Conclusions
These preliminary results suggest that DCE-MRI with a low GBCA dose distinguishes PCa from benign prostate tissue more effectively than the standard GBCA dose, based on signal enhancement rate. Diagnostic accuracy is similar on qualitative assessment. Prostate cancer diagnosis may be feasible with DCE-MRI with low dose GBCA. In addition, comparison of enhancement kinetics following low and high doses of contrast media may provide diagnostically useful information.
Keywords: prostate cancer, DCE-MRI, low dose, Gadolinium, contrast agent
Introduction
Dynamic contrast-enhanced magnetic resonance imaging (DCE-MRI) is used to diagnose various clinical conditions, especially cancers of the breast, prostate, pancreas, cervix, lungs, and the brain (1–6). DCE-MRI is performed by acquiring serial T1-weighted images before and after the bolus injection of a low molecular weight contrast media, which is generally a chelated gadolinium (Gd) molecule. Despite the effectiveness of DCE-MRI in detecting various pathologies, there are risks associated with Gd injection. Nephrogenic systemic fibrosis, edema, erythema, are associated with the use of Gd based contrast agents (GBCA) (7). Although one study found no significant Gd deposition after the administration of Gd-based contrast agents (8), several studies found evidence of Gd deposition in the body (brain, bone, kidneys, etc) after MRI scans (9–12), and another study showed that unchelated Gd3+ is released into blood after injection (13). The contrast agents are chelated Gd ion, which is not toxic. However, Gd in the free ionic form (Gd3+) is highly toxic in humans (14, 15). In light of these results, the Pharmacovigilance and Risk Assessment Committee for the European Medicines Agency has recommended the suspension of certain contrast agents that may result in higher Gd deposition.
While the deposition of Gd has been demonstrated in numerous studies, the clinical consequences of Gd deposition are unknown (9). At the same time Gd enhanced MRI scans provide crucial medical information. Therefore, American College of Radiology therefore recommends that clinical diagnostic benefits should be considered against the unknown potential risk of Gd deposition.
Multi-parametric MRI (mpMRI) is recommended for diagnosis of prostate disease (16, 17). Importantly, DCE-MRI is an integral part of the mpMRI technique, with cancers showing early focal signal enhancement due to angiogenesis (16, 18). Since patients often undergo multiple MRIs, it is reasonable to test the feasibility of DCE-MRI using a decreased Gd dose for prostate cancer diagnosis to reduce the risks associated with Gd deposition.
In addition to reducing the risk of adverse reactions, low doses of contrast media may have other advantages. Lower doses reduce potentially confounding effects of water exchange (19, 20) and T2* effects (21–23) associated with standard doses, and may allow more accurate measurements of contrast media concentration. In addition, contrast media dose-dependent effects may be different for cancers compared to normal tissue, e.g., due to differences in water exchange across cell membranes, or blood vessel density and leakiness producing differing T2* effects. Therefore, comparison of enhancement kinetics following low v.s. high doses of contrast media may provide diagnostically useful information.
This feasibility study investigated whether administration of low doses of GBCA for dynamic contrast enhanced MRI can be as effective as a standard dose in distinguishing prostate cancer from benign tissue. Additionally, we investigated whether the combination of a low dose followed by a high dose of contrast media is advantageous.
Materials and Methods
This prospective study was conducted after Institutional Review Board approval, informed patient consent and was compliant with HIPAA. Seventeen consecutive patients were recruited in this study, with prior biopsy proven prostate cancer scheduled to undergo radical prostatectomy. No patients with prior radiation or hormonal therapy were scanned. The patients were imaged between February 2014 and August 2014.
MR Imaging
The MR imaging was performed on Philips Achieva 3T-TX scanner (Philips Healthcare, Netherlands) using a 6-channel cardiac phased array coil placed around the pelvis combined with an endorectal coil (Medrad, Bayer Healthcare). Barium sulfate suspension was used to inflate the endorectal coil to squeeze air out to effectively reduce susceptibility and motion artifacts (24). The mpMRI protocol included T2-weighted imaging, diffusion weighted imaging and T1-weighted DCE-MRI. Two sets of axial dual-echo 3D T1-weighted DCE-MRI data were acquired at a temporal resolution of 8.3 seconds with imaging parameters: TR/TE1/TE2 = 4.8/1.7/3.3 ms, flip angle = 10°, field-of-view = 250 × 380 × 84 mm3 (AP × RL × SI extent), slice thickness = 3.5 mm, in-plane resolution = 1.25 × 1.75 mm2, reconstructed resolution = 1.0 × 1.0 mm2, SENSE factor = 1.67, and partial Fourier factor = 0.675. A two-point modified Dixon (mDixon) method was used to produce the ‘water-only’ images for quantitative analysis (25, 26). The total amount of gadobenate dimeglumine (Multihance, Bracco, Minneapolis, USA) injected was based on patient’s weight (0.1 mmol/kg). The dose was divided into two components. First, a low dose of contrast agent 0.015 mmol/kg (15% of total) and second, a dose of 0.085 mmol/kg (85% of the standard dose, but referred to here as the ‘standard’ dose). The injection rate was 0.35 and 2.00 cc/s for low and standard GBCA dose respectively, so that the total injection times were the same for the two doses. Images were acquired for 3.5 min following the low dose, because we were primarily interested in the early uptake kinetics following the low dose. This was followed by a 5 min gap before acquiring images following a standard dose of contrast media for 8.3 min.
Histology-MRI match
All study subjects subsequently underwent radical prostatectomy and whole mount specimen processing of excised prostates was performed by the pathology department at our institution. The whole prostate was fixed in formalin and sectioned in approximately the same plane as MR images using the standard approach. Whole mount sections were hematoxylin-eosin (H&E) stained and mounted on glass slides. Cancer outlines were marked by an expert pathologist (TA, 10 years of experience) on H&E stained histology images. The specimens were compared to the preoperative MR imaging in a retrospective fashion, and the cancerous lesions marked on histological slides were identified on MR imaging. MR images acquired with different pulse sequences and histology images were co-registered to T2W images using rigid registration in 3D Slicer (27). The MR images were analyzed by an expert radiologist (AO, 12 years’ prostate MRI experience). Regions-of-interest (ROIs) were drawn on axial T2W images and transferred to DCE images using “PCampReview”, a custom made module for prostate mpMRI in 3D Slicer (https://github.com/rcc-uchicago/PCampReview). Pathology confirmed cancers on prostatectomy specimens less than 5mm in dimension were not included in the analysis.
Qualitative DCE-MRI analysis
The low and standard dose DCE-MRI images were analyzed retrospectively by an expert radiologist (AO, 15 years’ prostate MRI experience). The PCa lesions were verified to see whether they showed early focal enhancement post contrast injection, which was indicative of PCa presence. PCa lesions detected based on early focal enhancement were assigned a lesion conspicuity score of 1-5 based on the confidence in accurately detecting cancer, with 5 being the highest confidence in accurately differentiating PCa from benign tissue on early phase DCE-MRI images.
Quantitative DCE-MRI analysis
The MR data was analyzed using in-house software written in MATLAB (Mathworks, Natick, MA) to generate DCE parameter maps. DCE-MRI analysis was performed using the empirical mathematical model (EMM) described in Fan et. al (28). The baseline signal intensity value (S0) of each voxel was calculated by averaging the signal intensity (S(t)) of the five pre-contrast time points. Then, the percentage signal enhancement (PSE) as a function of time was calculated as:
The initial time of enhancement for each voxel was found using an iterative method described in a previous study (29). The maximum enhancement projections (MEP) were generated by finding the maximum PSE value of each voxel. The PSE curve of standard dose data was fitted with the EMM on a voxel-by-voxel basis with a nonlinear least-squares algorithm using the following equation:
where A is the amplitude of PSE, α is the uptake rate (s−1) and β is the washout rate (s−1).
As the duration of acquisition following the low dose of contrast media was relatively short (3.5 min), no washout phase was detected. Thus, the low dose PSE curve versus time data was fitted to a truncated (uptake only) EMM using the following equation:
where A is the amplitude of PSE, and α is the uptake rate (s−1).
There were concerns that contrast retention from the low dose injection could interfere with the analysis of the contrast media kinetics following the standard dose injection (~8.5 minutes after the low dose injection). Therefore, we calculated the percentage difference between baseline signal intensity before the low dose (LDbaseline), and signal intensity immediately before the standard dose (SDbaseline) using the following equation:
Statistical analysis
Statistical analysis was performed using SPSS (IBM Corporation, Armonk, NY). The difference in lesion conspicuity score assigned by the radiologist for low and standard dose images was assessed by Wilcoxon signed rank test. Mean and standard deviation for DCE-MRI parameters from the EMM (α, β, MEP) were calculated for all the annotated ROIs for both low dose and standard dose DCE-MRI scans. The differences in means of the DCE parameters for cancer and normal prostatic tissue was assessed by two tail independent sample t-test. Receiver operating characteristic (ROC) analysis was used to evaluate the performance of the quantitative DCE-MRI parameters in differentiating between prostate cancer and normal tissue. The Pearson correlation coefficient between DCE-MRI parameters from the low dose and standard dose scans was estimated.
Results
The mean age of the 17 patients recruited in this study was 55 years (range 43-70 years), and mean PSA level prior to MR imaging was 7.8 ng/mL (range 1.8 – 25.0 ng/mL). Twenty-six ROIs from cancer (6 Gleason score 3+3, 17 Gleason score 3+4, 3 Gleason score 4+3) (21 peripheral zone cancers, 4 transition zone cancers, 1 anterior fibromuscular cancer) and thirty-five ROIs from normal tissue: 11 from peripheral zone, 8 from transition zone, 8 from central zone, and 8 from anterior fibromuscular stroma were analyzed in this study. Mean tumor size at its largest extent in the axial plane was 2.1±1.4 × 1.0±0.5 cm2 (range 0.5-6.9 × 0.3-2.2 cm2).
The qualitative assessment of DCE-MRI images by an expert radiologist showed similar sensitivity for PCa detection using both low and standard dose DCE-MRI. Thirteen out of twenty-six (sensitivity = 13/26 = 50%) PCa lesions showed early focal enhancement on low dose and high dose DCE-MRI, which was considered as indicative of PCa presence. The lesion conspicuity score for lesion detected was only nominally higher (Z = −1.000, p = 0.317) on standard clinical dose images (4.2 ± 0.9) compared to low dose images (4.0 ± 1.0).
Figures 1 and 2 show the voxel-by-voxel representations of quantitative DCE-MRI parameters (enhancement rate or α) and early phase DCE-MRI images from both low and standard GBCA doses, along with the final pathological outcome in corresponding T2-weighted images and histology images with cancer outlined. Prostate cancer is seen as regions of increased signal enhancement rate compared to surrounding benign tissue. The values of DCE-MRI parameters from EMM analysis for low and standard dose Gd administration and the statistical results are shown in Table 1.
Figure 1.
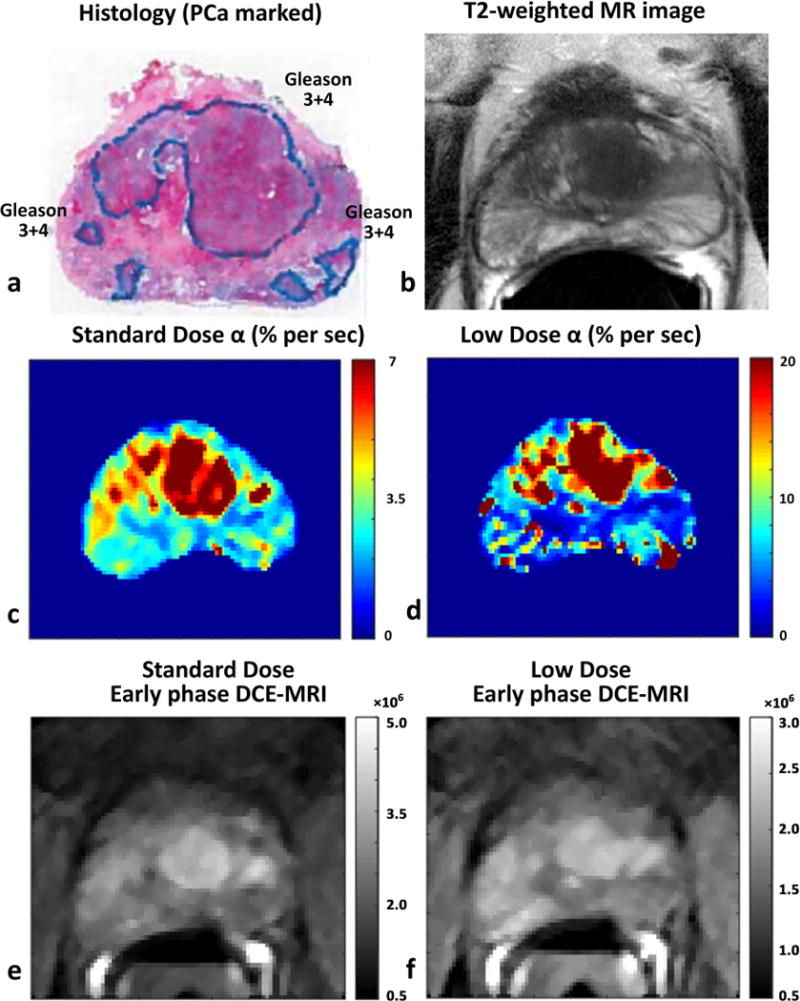
Comparing prostate cancer detection using low and standard Gd dose DCE-MRI in a 67 years old patient with PSA level of 9.45 ng/ml: Histology image with Gleason 3+4 cancers marked (a), corresponding T2-weighted image (b), signal enhancement rate or α using standard dose (c) and low dose (d), and early phase DCE-MRI image post injection of standard dose (e) and low dose (f) GBCA
Figure 2.

Comparing prostate cancer detection using low and standard Gd dose DCE-MRI in a 44 years old patient with PSA level of 25.0 ng/ml: Histology image with Gleason 3+4 cancers marked (a), corresponding T2-weighted image (b), signal enhancement rate or α using standard dose (c) and low dose (d), and early phase DCE-MRI image post injection of standard dose (e) and low dose (f) GBCA
Table 1.
Comparison of low and standard dose DCE-MRI parameters in PCa diagnosis
| MEP (%) | Alpha (% per sec) | |||
|---|---|---|---|---|
| Standard dose | Low dose | Standard dose | Low dose | |
| Normal Tissue | 93.8 ± 42.5 | 28.9 ± 16.3 | 3.35 ± 1.48 | 5.12 ± 2.95 |
| Prostate Cancer | 110.2 ± 49.4 | 33.3 ± 11.6 | 4.27 ± 2.20 | 9.98 ± 5.84 |
| p value (t-test) | 0.17 | 0.24 | 0.06 | < 0.001 |
|
Area under the curve (ROC analysis) |
0.626 p = 0.09 [0.484, 0.769] |
0.629 p = 0.09 [0.489, 0.768] |
0.625 p = 0.10 [0.483, 0.767] |
0.769 p < 0.001 [0.648, 0.890] |
Signal enhancement rate (α)
PCa showed significantly increased α compared to benign tissue for low (9.98 ± 5.84 vs 5.12 ± 2.95 s−1, p < 0.001), but not for standard dose (4.27 ± 2.20 vs 3.35 ± 1.48 s−1, p = 0.06). The rate constants for both PCa and benign tissue are larger for the low dose than the standard dose. Figure 3 summarizes α values from cancer and normal tissue ROIs for standard and low dose DCE-MRI. Additionally, the ratio of low dose α to standard dose α was significantly greater (p = 0.02) for PCa (2.8 ± 2.3) than for normal prostate (1.6 ± 0.9), suggesting changes in water exchange and/or T2* effects associated with cancer. The area under the ROC curve for differentiating PCa from benign tissue using α was nominally (p = 0.14) higher for low dose (0.769, p < 0.001) compared to standard dose (0.625, p = 0.10).
Figure 3.

Prostate cancer detection through signal enhancement rate or α using standard dose(c) and low dose (d) DCE-MRI. The figure shows the distribution of α in the box-plot figure.
Maximum Enhancement Projection
There were no significant differences between MEP calculated for PCa and normal tissue at both low (33.3±11.6 vs 28.9±16.3%, p = 0.24) and standard dose (110.2 ± 49.4 vs 93.8 ± 42.5%, p = 0.17). ROC analysis results in Table 1 also show that MEP values were not effective in differentiating between cancer and benign tissue evidenced by non-significant low AUC values.
Washout rate (β)
This imaging protocol study only followed the washout phase for the standard dose administration. There was no significant difference (p = 0.24) for the washout rate (β) between cancer (0.146 ± 0.545 % per sec) and normal tissue (0.032 ± 0.151 % per sec).
Correlation between low and standard dose DCE-MRI parameters
A modest but statistically significant Pearson correlation for DCE-MRI parameters: MEP (r = 0.53, p < 0.05) and α (r = 0.58, p < 0.05) was found between low and standard doses of Gd. Figure 4 shows the correlation of the DCE-MRI parameters between low and standard dose DCE-MRI.
Figure 4.

Correlation between DCE-MRI parameters (MEP and alpha) using standard dose and low dose Gd administration. Cancers ROIs are denoted by red dots and normal prostate tissue ROIs by green dots.
Contrast retention from low dose
The overall difference in baseline signal intensity between the low and standard dose DCE MRI protocols due to retention of contrast from the low dose injection is 8.9 ± 14.1%. In addition, there is no significant difference (p = 0.08) between contrast media retention in PCa (12.7 ± 11.4%) and normal prostate (6.9 ± 14.9%).
Discussion
While DCE-MRI is an important method for detecting prostate cancer, there are concerns with the potential for adverse reactions and deposition in the body, specifically in the brain and liver. The clinical benefit from DCE-MRI outweighs the unknown potential risk of Gd deposition, but the balance between risk and benefit would improve if the risk could be reduced. Therefore, this study investigated whether administration of low doses of Gd for dynamic contrast enhanced (DCE) MRI can be as effective as a standard dose in distinguishing prostate cancer (PCa) from benign tissue. The results show that prostate cancer diagnosis is feasible with quantitative DCE-MRI with a low dose of Gd-based contrast agent. Surprisingly, a very small contrast agent dose - 15% of the standard clinical dose – provides some advantages in diagnostic performance. This is likely due to the fact that T2* and water exchange effects are much smaller when a lower dose of contrast is used. These effects are large at higher doses and can obscure differences between cancer and normal prostate. In addition, the subsequent percent enhancement produced by additional contrast agent decreases as the tissue concentration of contrast media increases further (and T1 decreases). Thus, larger doses of contrast agent are increasingly inefficient in producing enhancement and improved image contrast, i.e. there is a ‘saturation effect’ at high contrast media concentrations. Smaller doses of contrast agent may produce improved diagnostic benefit per millimole of contrast media.
Both low and standard dose DCE-MRI showed similar sensitivity and lesion conspicuity score for PCa diagnosis on qualitative analysis by an expert radiologist based on early enhancement post injection. Signal enhancement rate (α) is effective in differentiating the PCa and normal tissue. Quantitative DCE-MRI with low Gd dose better distinguishes PCa from benign prostate tissue than standard Gd dose, based on signal enhancement rate, as evidenced by the higher AUC for prostate cancer differentiation using low dose DCE-MRI compared to standard dose. The AUC value for PCa diagnosis with high dose DCE-MRI is similar to those found in other DCE-MRI studies, while the AUC value obtained with low dose DCE-MRI is similar to the highest value reported from previous studies (30–32).
While no previous studies have attempted low dose DCE-MRI in the diagnosis of PCa, the results of our study showing low dose GBCA is as effective as standard dose GBCA for PCa diagnosis are consistent with a study by Huang et. al. (33) that showed comparable contrast enhancement of brain metastases can be achieved with a low dose (50% of standard clinical dose) gadobenate dimeglumine at 3T compared to imaging at 1.5T using standard dose gadopentetate dimeglumine. An older study on the central nervous system by Haustein et. al. (34) showed that a higher dose (3 times standard dose) of GBCA provided better contrast and efficacy, but this may be due to the lower field strength (0.5T) used for this study.
The correlation between DCE-MRI parameters for low and standard doses of Gd was statistically significant but relatively weak. The low-dose α and high-dose α are well correlated for benign ROIs, but poorly correlated for cancer ROIs. This suggests that the low dose of contrast media is providing new information that may compliment rather than duplicate the information from the standard clinical dose. The weak correlation between quantitative DCE-MRI parameters for low and standard dose may be due to the sensitivity to T2* and water exchange effects (21–23) as well as the native T1 and therefore these differences may be diagnostically useful. This study in fact, found the ratio of low dose α to standard dose α to be significantly greater for PCa than for normal prostate which suggests that there should not be a strong correlation between low dose and high dose parameters.
The current results suggest that a lower dose of contrast may provide at least the same diagnostic accuracy as a full dose, based on semi-quantitative analysis of data. But in addition, the results suggest that a protocol that combines a low dose followed by a high dose may provide novel and diagnostically useful information. The ratio of low dose α to standard dose α was significantly greater for PCa than for normal prostate. This difference may reflect water exchange and T2* effects that may be markers for cancer (21–23). In addition, as demonstrated by previous work from this laboratory (26) analysis of the arterial enhancement following the low dose provides an accurate arterial-input-function (AIF), and this AIF can then be used for quantitative analysis of contrast media dynamics in the cancer. Thus, a protocol composed of a low contrast media dose followed, after a washout period, by a high contrast media dose, may provide more benefits for patients than a conventional protocol that delivers the entire dose in a single bolus.
The maximum enhancement projection (MEP) is not significantly different between cancer and benign tissue and therefore is not helpful for prostate cancer detection for both the low and standard dose DCE-MRI. These results are similar to those of the previous study showing that even though the contrast media bolus arrival time and MEP are similar for benign prostatic tissue and PCa; the faster rate of initial enhancement in PCa compared to benign tissue observed in this study, characterized by signal enhancement rate (α), may appear similar to early enhancement in PCa (29). Additionally, the signal washout rate for standard dose DCE-MRI is shown to be ineffective for PCa detection, similar to the results reported in the previous paper from this group.
The choice of Gd based contrast agent should be considered for low dose DCE-MRI studies. The contrast agent used in this study, gadobenate dimeglumine has the highest relaxivity among the clinically approved contrast agents, which makes it the ideal contrast agent for this study investigating the feasibility of low dose DCE-MRI. The high relaxivity comes from weak interactions with albumin and some other macromolecules – mostly in blood. Because of this weak binding, during the first pass of the bolus, the contrast agent remains longer in the blood. The prolonged higher concentrations of contrast media in blood mean larger T2* and water-exchange effects in and near blood vessels. This could have accentuated differences between the low dose and high dose. The DIXON sequence produces additional T2* effects, although other fat suppression methods also produce T2* effects due to spectrally selective pulses. Therefore, it would be interesting to compare low and standard clinical doses with other contrast agents and pulse sequences.
In addition to the imaging pulse sequence, other imaging parameters used for both low and standard dose DCE-MRI protocol were also kept consistent with standard clinical prostate MRI. The flip angle used in this study was the same as the flip angle used for standard clinical exams. A larger pulse angle may have yielded better contrast for the low dose since the low dose produces smaller T1 changes. In addition, the use of high temporal resolution DCE-MRI may improve the diagnostic performance as shown in a previous study (29), particularly in combination with a rapid bolus injection of a low dose GBCA. This preliminary study did not explore optimal parameter settings for the low dose injection but this is an important goal for future work.
There are a few limitations of this study:
The Toft’s model (35) was not used for the analysis presented here to avoid error propagation associated with measurement of the arterial input function and calculation of contrast media concentration in the lesion. However, use of compartmental models to analyze low-dose data will be investigated in the future.
The washout rate (β) for the low dose DCE-MRI could not be accurately measured because the washout phase was sampled for a relatively short period of time.
The analysis of residual enhancement at ~8.5 minutes after the low dose suggests that a small amount of contrast media from the low dose injection remained when the standard dose injection was injected, and this could interfere with the analysis of the uptake and washout kinetics following the standard dose. Despite the small amount of contrast retention, the residual contrast from the low dose may have reduced the dynamic range of enhancement following the standard dose. To reduce these limitations, a longer sampling period following injection of the low dose would be beneficial. However, this would increase scan times, which might not be feasible in clinical practice.
This study only investigated one low dose of contrast media and one injection speed. Further work is needed to determine the dose and injection speed that is optimal for prostate cancer diagnosis, and reduces risk of adverse events.
The differences observed between low and high doses may have been due in part to use of the DIXON technique to separate fat and water signals. This method uses two gradient echoes, and thus is susceptible to T2* effects, especially during the first pass of the contrast media bolus. Other commonly used fat suppression methods based on spectrally selective inversion or saturation are also sensitive to changes in T2*. A systematic evaluation of T2* effects, and a comparison of low-dose DCE-MRI with different fat suppression protocols is needed.
This preliminary study did not investigate whether low-dose DCE has any on effect on the clinical interpretation or PI-RADS scoring due to the small sample size in this study. This is an important topic that future studies will investigate.
In conclusion, prostate cancer diagnosis may be feasible with DCE-MRI using a low dose GBCA. Qualitative assessment yielded similar sensitivity and lesion conspicuity score for PCa diagnosis on qualitative analysis of both low and standard GBCA dose DCE-MRI. However, quantitative analysis of enhancement kinetics distinguished PCa from benign prostate tissue more effectively with the low dose compared to the standard GBCA dose, based on signal enhancement rate in this preliminary study. The potential improvement with low dose may be due to water exchange and T2* effects, as well as ‘saturation effects’ at higher contrast media concentrations. In addition, comparison of contrast media kinetics following the low and high doses may provide useful information. Further study is needed to find the optimal dose and injection protocol for PCa diagnosis using DCE-MRI.
References
- 1.Kuhl CK, Mielcareck P, Klaschik S, et al. Dynamic breast MR imaging: are signal intensity time course data useful for differential diagnosis of enhancing lesions? Radiology. 1999;211(1):101–10. doi: 10.1148/radiology.211.1.r99ap38101. [DOI] [PubMed] [Google Scholar]
- 2.Futterer JJ, Heijmink SW, Scheenen TW, et al. Prostate cancer localization with dynamic contrast-enhanced MR imaging and proton MR spectroscopic imaging. Radiology. 2006;241(2):449–58. doi: 10.1148/radiol.2412051866. [DOI] [PubMed] [Google Scholar]
- 3.Akisik MF, Sandrasegaran K, Bu G, et al. Pancreatic cancer: utility of dynamic contrast-enhanced MR imaging in assessment of antiangiogenic therapy. Radiology. 2010;256(2):441–9. doi: 10.1148/radiol.10091733. [DOI] [PubMed] [Google Scholar]
- 4.Zahra MA, Tan LT, Priest AN, et al. Semiquantitative and quantitative dynamic contrast-enhanced magnetic resonance imaging measurements predict radiation response in cervix cancer. International Journal of Radiation Oncology* Biology* Physics. 2009;74(3):766–73. doi: 10.1016/j.ijrobp.2008.08.023. [DOI] [PubMed] [Google Scholar]
- 5.Naish JH, Kershaw LE, Buckley DL, et al. Modeling of contrast agent kinetics in the lung using T1-weighted dynamic contrast-enhanced MRI. Magnetic resonance in medicine. 2009;61(6):1507–14. doi: 10.1002/mrm.21814. [DOI] [PubMed] [Google Scholar]
- 6.Sourbron S, Ingrisch M, Siefert A, et al. Quantification of cerebral blood flow, cerebral blood volume, and blood–brain-barrier leakage with DCE-MRI. Magnetic resonance in medicine. 2009;62(1):205–17. doi: 10.1002/mrm.22005. [DOI] [PubMed] [Google Scholar]
- 7.Sadowski EA, Bennett LK, Chan MR, et al. Nephrogenic Systemic Fibrosis: Risk Factors and Incidence Estimation. Radiology. 2007;243(1):148–57. doi: 10.1148/radiol.2431062144. [DOI] [PubMed] [Google Scholar]
- 8.Tibussek D, Rademacher C, Caspers J, et al. Gadolinium Brain Deposition after Macrocyclic Gadolinium Administration: A Pediatric Case-Control Study. Radiology. 2017;161151 doi: 10.1148/radiol.2017161151. [DOI] [PubMed] [Google Scholar]
- 9.Huckle JE, Altun E, Jay M, Semelka RC. Gadolinium deposition in humans: when did we learn that gadolinium was deposited in vivo? Investigative radiology. 2016;51(4):236–40. doi: 10.1097/RLI.0000000000000228. [DOI] [PubMed] [Google Scholar]
- 10.Murata N, Gonzalez-Cuyar LF, Murata K, et al. Macrocyclic and other non–group 1 gadolinium contrast agents deposit low levels of gadolinium in brain and bone tissue: preliminary results from 9 patients with normal renal function. Investigative radiology. 2016;51(7):447–53. doi: 10.1097/RLI.0000000000000252. [DOI] [PubMed] [Google Scholar]
- 11.Kanda T, Ishii K, Kawaguchi H, et al. High Signal Intensity in the Dentate Nucleus and Globus Pallidus on Unenhanced T1-weighted MR Images: Relationship with Increasing Cumulative Dose of a Gadolinium-based Contrast Material. Radiology. 2014;270(3):834–41. doi: 10.1148/radiol.13131669. [DOI] [PubMed] [Google Scholar]
- 12.McDonald RJ, McDonald JS, Kallmes DF, et al. Intracranial Gadolinium Deposition after Contrast-enhanced MR Imaging. Radiology. 2015;275(3):772–82. doi: 10.1148/radiol.15150025. [DOI] [PubMed] [Google Scholar]
- 13.Frenzel T, Lengsfeld P, Schirmer H, et al. Stability of Gadolinium-Based Magnetic Resonance Imaging Contrast Agents in Human Serum at 37°C. Investigative Radiology. 2008;43(12):817–28. doi: 10.1097/RLI.0b013e3181852171. [DOI] [PubMed] [Google Scholar]
- 14.Perazella MA. Current status of gadolinium toxicity in patients with kidney disease. Clinical Journal of the American Society of Nephrology. 2009;4(2):461–9. doi: 10.2215/CJN.06011108. [DOI] [PubMed] [Google Scholar]
- 15.Rogosnitzky M, Branch S. Gadolinium-based contrast agent toxicity: a review of known and proposed mechanisms. Biometals. 2016;29:365. doi: 10.1007/s10534-016-9931-7. [DOI] [PMC free article] [PubMed] [Google Scholar]
- 16.de Rooij M, Hamoen EH, Fütterer JJ, et al. Accuracy of multiparametric MRI for prostate cancer detection: a meta-analysis. American Journal of Roentgenology. 2014;202(2):343–51. doi: 10.2214/AJR.13.11046. [DOI] [PubMed] [Google Scholar]
- 17.Weinreb JC, Barentsz JO, Choyke PL, et al. PI-RADS Prostate Imaging – Reporting and Data System: 2015, Version 2. European Urology. 2016;69(1):16–40. doi: 10.1016/j.eururo.2015.08.052. [DOI] [PMC free article] [PubMed] [Google Scholar]
- 18.Kozlowski P, Chang SD, Jones EC, et al. Combined diffusion-weighted and dynamic contrast-enhanced MRI for prostate cancer diagnosis—Correlation with biopsy and histopathology. Journal of Magnetic Resonance Imaging. 2006;24(1):108–13. doi: 10.1002/jmri.20626. [DOI] [PubMed] [Google Scholar]
- 19.Buckley DL, Kershaw LE, Stanisz GJ. Cellular-interstitial water exchange and its effect on the determination of contrast agent concentration in vivo: Dynamic contrast-enhanced MRI of human internal obturator muscle. Magnetic Resonance in Medicine. 2008;60(5):1011–9. doi: 10.1002/mrm.21748. [DOI] [PubMed] [Google Scholar]
- 20.Li X, Priest RA, Woodward WJ, et al. Cell membrane water exchange effects in prostate DCE-MRI. Journal of Magnetic Resonance. 2012;218:77–85. doi: 10.1016/j.jmr.2012.03.019. [DOI] [PMC free article] [PubMed] [Google Scholar]
- 21.Yankeelov TE, Rooney WD, Li X, Springer CS. Variation of the relaxographic “shutter-speed” for transcytolemmal water exchange affects the CR bolus-tracking curve shape. Magnetic Resonance in Medicine. 2003;50(6):1151–69. doi: 10.1002/mrm.10624. [DOI] [PubMed] [Google Scholar]
- 22.Li X, Springer CS, Jerosch-Herold M. First-pass dynamic contrast-enhanced MRI with extravasating contrast reagent: evidence for human myocardial capillary recruitment in adenosine-induced hyperemia. NMR in Biomedicine. 2009;22(2):148–57. doi: 10.1002/nbm.1293. [DOI] [PubMed] [Google Scholar]
- 23.Lee J-H, Springer CS. Effects of equilibrium exchange on diffusion-weighted NMR signals: The diffusigraphic “shutter-speed”. Magnetic Resonance in Medicine. 2003;49(3):450–8. doi: 10.1002/mrm.10402. [DOI] [PubMed] [Google Scholar]
- 24.Rosen Y, Bloch BN, Lenkinski RE, et al. 3T MR of the prostate: Reducing susceptibility gradients by inflating the endorectal coil with a barium sulfate suspension. Magnetic Resonance in Medicine. 2007;57(5):898–904. doi: 10.1002/mrm.21166. [DOI] [PubMed] [Google Scholar]
- 25.Eggers H, Brendel B, Duijndam A, Herigault G. Dual-echo Dixon imaging with flexible choice of echo times. Magnetic resonance in medicine. 2011;65(1):96–107. doi: 10.1002/mrm.22578. [DOI] [PubMed] [Google Scholar]
- 26.Wang S, Fan X, Medved M, et al. Arterial input functions (AIFs) measured directly from arteries with low and standard doses of contrast agent, and AIFs derived from reference tissues. Magnetic Resonance Imaging. 2016;34(2):197–203. doi: 10.1016/j.mri.2015.10.025. [DOI] [PMC free article] [PubMed] [Google Scholar]
- 27.Fedorov A, Beichel R, Kalpathy-Cramer J, et al. 3D Slicer as an Image Computing Platform for the Quantitative Imaging Network. Magnetic Resonance Imaging. 2012;30(9):1323–41. doi: 10.1016/j.mri.2012.05.001. [DOI] [PMC free article] [PubMed] [Google Scholar]
- 28.Fan X, Medved M, River JN, et al. New model for analysis of dynamic contrast-enhanced MRI data distinguishes metastatic from nonmetastatic transplanted rodent prostate tumors. Magnetic resonance in medicine. 2004;51(3):487–94. doi: 10.1002/mrm.10737. [DOI] [PubMed] [Google Scholar]
- 29.Chatterjee A, He D, Fan X, et al. Performance of ultrafast DCE-MRI for diagnosis of prostate cancer. Academic Radiology. 2017 doi: 10.1016/j.acra.2017.10.004. [DOI] [PMC free article] [PubMed] [Google Scholar]
- 30.Langer DL, van der Kwast TH, Evans AJ, et al. Prostate cancer detection with multi-parametric MRI: logistic regression analysis of quantitative T2, diffusion-weighted imaging, and dynamic contrast-enhanced MRI. Journal of magnetic resonance imaging : JMRI. 2009;30(2):327–34. doi: 10.1002/jmri.21824. [DOI] [PubMed] [Google Scholar]
- 31.Isebaert S, De Keyzer F, Haustermans K, et al. Evaluation of semi-quantitative dynamic contrast-enhanced MRI parameters for prostate cancer in correlation to whole-mount histopathology. European Journal of Radiology. 2012;81(3):e217–e22. doi: 10.1016/j.ejrad.2011.01.107. [DOI] [PubMed] [Google Scholar]
- 32.Vos EK, Litjens GJS, Kobus T, et al. Assessment of Prostate Cancer Aggressiveness Using Dynamic Contrast-enhanced Magnetic Resonance Imaging at 3 T. European Urology. 2013;64(3):448–55. doi: 10.1016/j.eururo.2013.05.045. [DOI] [PubMed] [Google Scholar]
- 33.Huang B, Liang CH, Liu HJ, et al. Low-dose contrast-enhanced magnetic resonance imaging of brain metastases at 3.0 T using high-relaxivity contrast agents. Acta Radiol. 2010;51(1):78–84. doi: 10.3109/02841850903350178. [DOI] [PubMed] [Google Scholar]
- 34.Haustein J, Laniado M, Niendorf HP, et al. Triple-dose versus standard-dose gadopentetate dimeglumine: a randomized study in 199 patients. Radiology. 1993;186(3):855–60. doi: 10.1148/radiology.186.3.8430199. [DOI] [PubMed] [Google Scholar]
- 35.Tofts PS, Brix G, Buckley DL, et al. Estimating kinetic parameters from dynamic contrast-enhanced t1-weighted MRI of a diffusable tracer: Standardized quantities and symbols. Journal of Magnetic Resonance Imaging. 1999;10(3):223–32. doi: 10.1002/(sici)1522-2586(199909)10:3<223::aid-jmri2>3.0.co;2-s. [DOI] [PubMed] [Google Scholar]