

Abstract
Scope:
Brown adipose tissue (BAT) dissipates energy through uncoupling protein 1 (UCP1) and has been proposed as an anti-obesity target. We previously reported that high fat (HF) diet enriched in eicosapentaenoic acid (EPA) significantly increased UCP1 and other thermogenic markers in BAT. We hypothesized that these effects are mediated through UCP1-dependent regulation.
Methods and Results:
Wild type (WT) and UCP1 knockout (KO) B6 male mice were housed at thermoneutrality and fed HF, without or with EPA-enriched fish oil. HF-fed KO mice were heavier and had higher BAT lipid content than other groups. Protective effects of EPA in WT, previously observed at 22°C (reduced adiposity, improved glucose tolerance, and increased UCP1), disappeared at thermoneutrality. Mitochondrial proteins, COX I, II and IV were reduced in the KO mice compared to WT. Unexpectedly, EPA attenuated weight and fat mass gain, improved glucose tolerance in the KO mice. Finally, EPA increased BAT PGC1α protein and gene expression, and whole-body oxygen consumption in KO mice, consistent with increased mtDNA/nucDNA ratio.
Conclusions:
EPA rescued the weight gain and glucose intolerance in UCP1 KO mice at thermoneutrality, independent of UCP1; these effects of may be mediated in part via increased oxygen consumption and BAT PGC1α.
Keywords: Brown adipose tissue, Omega 3 fatty acids, Obesity, Thermoneutrality, Uncoupling protein 1
Graphical abstract
The goal of this study is to determine whether protective effects of EPA in obesity and brown adipose tissue thermogenesis is mediated in part through UCP1.
Wild type (WT) and UCP1 knockout (KO) B6 male mice were housed at thermoneutral conditions (28–30⁰C) and fed a HF, either without or with EPA-enriched fish oil for 14 weeks. Metabolic phenotyping was conducted during this time, and blood and brown adipose tissue were collected at the end of the feeding period and analyzed. BAT exhibited white adipose tissue-like morphology with greater lipid content in the KO compared to the WT. EPA reduced lipid content in BAT in both the WT and KO with more pronounced effects in the WT. Mitochondrial proteins, COX I, II and IV were all reduced in the KO mice compared to WT. EPA increased PGC1α gene, protein in BAT, and whole-body oxygen consumption in the KO mice. Overall, EPA rescued the excessive weight gain and glucose intolerance in UCP1 KO mice (not shown in graphical abstract); and these effects may be mediated in part via increased PGC1α and oxygen consumption in BAT.

1. Introduction:
Obesity and its associated metabolic disorders have become a major health problem worldwide [1]. Obesity associated comorbidities include insulin resistance/type II diabetes, dyslipidemia, cardiovascular diseases, and certain types of cancers [2]. During obesity, white adipose tissue (WAT) stores excess energy as triglycerides and is also a major source of inflammation [3]. In contrast to WAT, brown adipose tissue (BAT) is known for its critical role in energy balance through thermogenesis, an effect which is mediated by uncoupling protein 1 (UCP1) [4]. Two types of UCP1 positive adipocytes exist in humans and rodents: classical brown adipocytes located at the interscapular area and beige adipocytes primarily located in subcutaneous depots of WAT under certain conditions such as cold exposure [5].
BAT thermogenesis is crucial for maintaining body temperature in infants, and is therefore considered more essential in prenatal and infant stages of development [6, 7]. Thermogenesis is mainly mediated by UCP1, a protein located in the inner membrane of BAT mitochondria, through activation of catecholamine-mediated lipolysis or cold stimulation [8]. UCP1 uncouples oxidative phosphorylation from ATP synthesis, dissipating energy as heat. This process protects against hypothermia and obesity [9]. Moreover, UCP1 in BAT also contributes to decreased production of reactive oxygen species (ROS) by mitochondria [10]. This is important in obesity, as there are increased circulating levels of glucose and lipids, steering excessive substrates into metabolic pathways, which in turn leads to increased ROS [11]. Transgenic mice overexpressing UCP1 in skeletal muscle show upregulation of fatty acid oxidation markers indicating anti-obesity potential for UCP1 [12]. Moreover, ectopic UCP1 overexpression in WAT improves insulin sensitivity [13]. Additionally, UCP1 content in differentiated adipogenic cells is significantly higher in cells originating from lean than obese individuals [14].
Cold is one of the most potent activators of BAT and UCP1 activity; and environmental temperature is a critical factor that defines the amount of energy used for thermogenesis [15]. At 22°C (common mouse housing temperature), mice are exposed to chronic thermal stress [15]. To maintain body temperature, they increase their heat production and thereby energy expenditure. Thermoneutrality is the temperature for rodents at which energy expenditure is kept minimal to preserve body temperature. Couple of studies have shown that inactivation of UCP1 induces obesity and increases adiposity especially at thermoneutral (28–30°C) environments [16, 17].
With the identification of functional BAT in adults in 2007 [18, 19], several studies have shown that activation of BAT thermogenesis may be an efficient strategy to combat obesity [6, 20, 21]. Results obtained from 18-FDG-PET imaging indicate that exposing humans to a cooler temperature (15°C) significantly increases BAT activity in lean men compared to obese subjects [22]. Another study showed that UCP1 protein content after cold exposure in overweight subjects was much higher in supraclavicular fat compared to abdominal subcutaneous fat [23]. Furthermore, guanosine diphosphate (GDP) which is an inhibitory ligand of UCP1, represses mitochondrial respiration in BAT but not in WAT [23]. These results confirm the critical role of UCP1 in thermogenesis and existence of a functional BAT in human subclavicular region [24].
Long-chain omega 3 polyunsaturated fatty acids (ω−3 PUFA) such as eicosapentaenoic acid (EPA; 20:5; n-3) and docosahexaenoic acid (DHA; 22:6; n-3) are the main components in fish oil [25]. They have beneficial anti-inflammatory, hypotriglyceridemic, cardioprotective, and in some cases anti-obesity properties [26, 27]. We have previously reported that EPA significantly increased BAT UCP1 protein level as well as expression of other master regulators of thermogenesis such as cell death-inducing DFFA-like effector (Cidea), peroxisome proliferator-activated receptor gamma coactivator 1 alpha (Pgc1α) and PR domain containing 16 (Prdm16) [28]. However, the precise mechanisms by which these dietary fatty acids induced these effects remains unknown. We hypothesized that these beneficial metabolic effects of EPA could be mediated through UCP1-induced thermogenesis.
Our main objective here was to investigate the involvement of UCP1 for the beneficial actions of EPA in glucose and energy homeostasis in mice maintained at a thermoneutral conditions. We demonstrated that (1) our previously reported beneficial effects of EPA in wild type (WT) mice, at 22°C, were attenuated at thermoneutral temperatures; and (2) UCP1 inactivation increased body weight, adiposity and glucose intolerance at thermoneutral temperatures, which was rescued by EPA supplementation.
2. Material and Methods:
2.1. Animal studies:
2.1.1. Genotyping
Heterozygous (HET) UCP1 C57BL/6J male mice were purchased from Jackson Laboratory (Bar Harbor, ME). Trio breeding was performed between HETs in our animal facility to produce homozygous UCP1 KO and WT littermates. To confirm the animal genotypes (WT, KO, or HET), we used WT and UCP1 mutant primers: Sequences for WT forward and reverse primers were TCGTCATCAATAAGGGGAAAC and CTTCTTCCCTGATGCTCCAT; respectively; and for KO genotypes, GGTGTTTGGAGCCTGCATTGC and CTT CCTGACTAGGGGAGGAGT respectively. Briefly, alkaline lysis reagent (Sigma-Aldrich, Louis, MO) was added to mice tails, followed by the neutralizing reagent to isolate DNA, which was subsequently used for PCR. Agarose gel electrophoresis was run to determine corresponding genotypes. WT and KO genotypes had only one specific band, while HET showed two bands (Figure 1).
Figure. 1. Genotyping of WT and UCP1 KO mice:

Positive/negative PCR products were measured by gel. Agarose electrophoresis of (A) WT (B) KO products.
2.1.2. Diets and study design
For experimental studies, WT and KO male mice at ~ 5–6 weeks were randomized into different groups (10–12 mice per group) and housed at thermoneutral temperature (28–30°C). Mice were either fed a HF diet (45%, 20%, and 35% of energy from fat, protein, and carbohydrate, respectively) or a HF diet supplemented with 36g/kg of AlaskOmega EPA-enriched fish oil (800mg/g), kindly provided by Organic Technologies (Coshocton, OH) for up to 14 weeks. Diet composition is provided in supplementary table 1. Animals were housed in individual cages with 12-hours light/dark cycle with free access to food and water. Food was replaced two to here times each week to avoid rancidity, and food intake was measured by assessing amount of food consumed. Glucose tolerance test (GTT), insulin tolerance test (ITT), body composition, and energy expenditure were performed during the feeding period, as described below. At the end of the 14 weeks, all animals were euthanized after a 5-hour fast using CO2 inhalation method. Interscapular BAT, located on the dorsal side, between the shoulder blades, as well as other tissues, were collected, snap-frozen in liquid nitrogen and stored at −800C until further analyses. BAT and epididymal adipose tissue (fat pads) were weighed and serum prepared from collected blood. All animal protocols were approved by the Institutional Animal Care and Use Committee of Texas Tech University (TTU-16011–04).
2.1.3. Glucose and Insulin Tolerance Tests
Mice were fasted for 5 hours for GTT, previously established as an appropriate duration of fasting in rodents for insulin resistance studies [29]. Blood glucose levels were measured at 0, 30, 60, 90, and 120 min after intraperitoneal (i.p.) injection of glucose (2 g/kg body weight), using OneTouch Ultra Glucose Meter (AlphaTrack, North Chicago, IL). After 12 weeks of dietary intervention, we conducted ITT, following 5 hours fasting: mice were injected with 1 U/kg insulin (Humulin, Indianapolis, IN). Blood glucose levels were then measured at 0, 15, 30, 45, 60, and 90 mins. Area under the curve was calculated using trapezoidal method.
2.1.4. Body composition
Body fat and lean mass percentage determination was performed using Echo-MRI instrument (EchoMRI LLC, Houston, TX) during the 11th week of dietary intervention.
2.1.5. Energy expenditure
Using a metabolic monitoring system (Omnitech, Columbus, OH), total energy expenditure was measured during 12:12 hours light and dark cycles by monitoring oxygen consumption and carbon dioxide production over 48 hours. Oxygen consumption was calculated in absolute terms relative to body weight.
2.1.6. RNA isolation and quantitative real-time PCR
BAT was homogenized in QIAzol solution using tissue homogenizer (TissueLyser LT, Qiagen, Valencia, CA). Total RNA was isolated using RNeasy kit (Qiagen, Valencia, CA). First-strand cDNA was synthesized using the Maxima kit (Thermo Scientific, Grand Island, NY). Gene expression was performed by quantitative polymerase chain reaction (qPCR). Data were normalized to the housekeeping gene TATA binding protein (TBP), (Sigma-Aldrich, St Louis, MO), ΔΔCt method was used to determine mRNA expression and fold changes. Primers used were designed using Oligoarchitech™ Online (Supplementary table 2), and purchased from Sigma-Aldrich (St Louis, MO). All primers were optimized prior to gene expression.
2.1.7. Immunoblotting
Proteins were extracted from BAT by lysing in modified RIPA buffer, as previously described [28]. Proteins were subjected to electrophoresis on gradient gels (Bio-Rad, Hercules, CA), then transferred to polyvinylidene fluoride (PVDF) membranes. Membranes were incubated in blocking buffer for 1 hour at room temperature, followed by primary antibodies for UCP1 (Thermo Fisher Scientific, Rockford, IL) (1:1000), PGC1α (Abcam, Cambridge, MA) (1:1000), and total OXPHOS cocktail (Abcam, Cambridge, MA) (1:250). Alpha-Tubulin (1:1000), and GAPDH (Cell Signaling, Danvers, MA) (1:1000) were used as the housekeeping control. Next, membranes were incubated in secondary antibodies, rabbit polyclonal (1:20000) and mouse polyclonal (1:20000) respectively and blots were developed using Li-COR Imager System (Lincoln, NE).
2.1.8. Triglyceride assay
Triglycerides colorimetric assay kit (Cayman, Ann Arbor, MI) was used to determine the triglyceride content in BAT protein lysates.
2.1.9. Mitochondria mass quantification (mitochondria DNA)
DNA was isolated from BAT using gene Mammalian DNA Kit (Sigma-Aldrich, Louis, MO). Cytochrome b (Cytb), mitochondrially encoded NADH: ubiquinone oxidoreductase core subunit 1 (Nd1), and Nd2 were used as the mtDNA primers. Pparg and Ucp1 loci were used as the genomic DNA primers. The mtDNA/nucDNA ratio was calculated individually for each primer pair using 2*2^(CTnucDNA-CTmtDNA).
2.1.10. Histological assessments
BAT was fixed in z-fix (Anatech Ltd, Battle Creek, MI), transferred to 70% ethanol, paraffin embedded at 5 μm, and stained with hematoxylin and eosin (H&E) to detect morphology changes. Immunofluorescence was performed with UCP1 (Thermo Fisher Scientific, Rockford, IL) and COX IV (Abcam, Cambridge, MA) in BAT sections and visualized using EVOS XL Microscope (Thermo Fisher Scientific, Rockford, IL) at 20X and 10X magnification for H&E and immunofluorescence respectively.
2.1.11. Statistical analysis
All data are presented as mean ± SEM. For multiple comparisons, one-way ANOVA was performed, followed by Tukey’s post-hoc test (p<0.05). Two-way ANOVA was used to measure effects of diet, genotype, and genotype X diet interaction. All statistical tests were performed using GraphPad Prism software.
3. Results
3.1. Effect of EPA and UCP1 deficiency on food intake and weight gain
Feldmann et al. have shown that UCP1 KO mice fed a HF diet (45% Kcal fat) develop obesity at thermoneutral conditions (28°−30° C) [17]. Moreover, we have previously shown that EPA reduces obesity and increases BAT UCP1 levels in WT mice kept at 22°C [26, 28]. Thus, we tested whether these EPA effects were reproduced in mice kept at thermoneutrality and whether they were dependent on UCP1. Accordingly, we compared the effects of EPA-enriched HF diet on WT and UCP1 KO male mice, all placed at thermoneutrality, for its role in BAT function. Food intake was comparable between HF and EPA diets within each genotype and throughout the feeding period (Figure 2.A.). However, KO-HF group gained significantly more body weight compared to all other groups (Figure 2.B.).
Figure. 2. Body weight and food intake in WT and UCP1 KO mice fed a HF diet vs. EPA.

A: weekly food intake. B: weekly body weight. Data are expressed as mean± SEM. WT, wild-type; KO, knock out; HF, high fat. Groups represented with same letter indicate no difference. p <0.05; n =10–12 mice per group.
3.2. Effects of EPA and UCP1 deficiency on glucose homeostasis
In order to determine the effect of UCP1 deficiency and EPA on glucose homeostasis, we performed GTT and ITT. Glucose intolerance was significantly higher in the KO-HF group compared to the WT-HF (p<0.05) (Figure 3.A.). In WT groups, no difference in glucose tolerance was observed between the EPA and HF fed mice (Figure 3.A. and B.). However, in the KO mice, EPA significantly lowered glucose intolerance (P<0.05) compared to KO mice fed HF (Figure 3.A.). In contrast to the findings of the GTT, there were no differences in ITT between WT and KO mice fed HF. Moreover, EPA did not alter ITT in WT mice (figure 3.C.). However, KO mice fed EPA displayed a significant reduction in glucose levels compared to KO mice fed HF diet (P<0.05), confirming that EPA attenuates glucose intolerance and insulin resistance in UCP1 KO mice (Figure 3.D.).
Figure. 3. The effect of UCP1 and thermoneutral environment on glucose homeostasis in WT and UCP1 KO mice fed a HF diet vs. EPA.

A: glucose tolerance test. B: Area under the curve of GTT. C: insulin tolerance test D: Area under the curve of ITT. Data are expressed as mean± SEM. WT, wild-type; KO, knock out; HF, high fat. Groups represented with same letter indicate no difference. p <0.05; n =10–12 mice per group.
3.3. Effects of EPA and UCP1 deficiency on body and fat pad weights and body fat percentage
When comparing final body weights at the end of the study, KO-HF had the highest body weight among all 4 groups (P<0.05) (Figure 4.A). There was no effect of EPA on final body weights in the WT group (Figure 4.A). More importantly, KO-EPA mice displayed significantly lower body weight compared to KO-HF mice (P<0.05). Epididymal fat pad and fat percentage were not different between WT mice fed HF or the EPA diet, however, KO mice fed EPA had significantly lower values in both these variables compared to KO mice fed HF diet (Figure 4.B. and C.). No difference was observed in lean mass percentage among all four groups (Figure 4.D.) Taken together, this suggests that EPA prevents weight gain and excessive adiposity in UCP1 KO mice. However, no interaction between genotype and diet was observed (Table 1).
Figure. 4. Final body weight, epididymal fat pad weight, fat percentage, and lean percentage in WT and UCP1 KO mice fed a HF diet vs. EPA.

A: final body weight. B: epididymal fat pad weight. C: fat percentage. D: lean percentage. Data are expressed as mean± SEM. WT, wild-type; KO, knock out; HF, high fat. Groups represented with same letter indicate no difference. p <0.05; n =10–12 mice per group.
Table 1. Effects of diet, genotype, and interaction on body weight and metabolic characteristics in male mice in thermoneutral environment.
WT, wild-type; KO, knock out; HF, high fat. Significant P values (0.05); n 5–10 mice per group.
| P-value |
|||
|---|---|---|---|
| Variable | Geno (WT&KO) |
Diet (HF&EPA) |
Geno X Diet |
| Final body weight (g) | 0.0001 | 0.0005 | NS |
| Epididymal fat pad (g) | NS | 0.0002 | NS |
| Fat percentage | 0.0001 | 0.0001 | NS |
| Interscapular BAT weight (g) | 0.0001 | 0.0002 | 0.01 |
| GTT (area under the curve) (AU) | 0.002 | 0.0009 | NS |
| Insulin (pg/ml) | 0.0006 | 0.001 | NS |
|
Oxygen consumption
(Vo2/ml kg-1- H-1) |
0.0001 | 0.0001 | 0.0007 |
| mtDNA/nucDNA | NS | 0.03 | NS |
3.4. Ablation of UCP1 causes whitening of brown adipose tissue
Since UCP1 is the master thermogenic protein in BAT, we examined the effect of UCP1 deficiency and EPA in thermoneutral environments on interscapular BAT weight and morphology. Histology images showed higher lipid deposition in the BAT of KO mice (figure 5.A.) which was confirmed by the significant (p<0.05) higher triglyceride levels in the KO mice compared to WT group (figure 5.B.). Overall, BAT mass was significantly higher in KO mice when compared to WT (P<0.05) (figure 5.C.) EPA did not affect BAT mass in the WT genotype. However, in KO mice, EPA significantly reduced BAT mass (P<0.05) compared to the HF diet. A significant interaction was observed between genotype and diet, for interscapular BAT weight (Table 1).
Figure. 5. Histology of interscapular BAT, triglyceride content, and BAT weight in WT and UCP1 KO male mice fed a HF diet vs. EPA.

A: histology images (20X) of interscapular BAT, B: triglyceride content, C: interscapular BAT weight. Data are expressed as mean± SEM. WT, wild-type; KO, knock out; HF, high fat. Groups represented with same letter indicate no difference. p <0.05; n 6–10 mice per group.
3.5. Effects of EPA and UCP1 deficiency on thermogenic markers
We previously reported that EPA increased UCP1 and other thermogenic markers such as Prdm16 and Pgc1α at 22°C [28]. In this study we examined effects of EPA and UCP1 deficiency on BAT mRNA levels of thermogenic markers. In the KO genotype, Pgc1α mRNA expression was significantly higher in the EPA group. Sirt1 showed significant higher expression in the WT-EPA group compared to the other three groups. Moreover, as expected, Ucp1 mRNA was undetectable in the KO but was highly expressed in the WT, while Ucp2 mRNA was expressed more in the KO compared to WT (Figure 6. A.–D). We also measured gene expression of other thermogenic markers such as Cidea and Prdm16 and found no differences across groups (Supplementary Figure 1.A. and B.). Additionally, we measured UCP1-independent genes such as klotho beta (Klb) and sarcoplasmic/endoplasmic reticulum calcium ATPase 2b (Serca2b) and observed no differences. (Supplementary Figure 1.C. and D.). Furthermore, several mitochondria biogenesis markers were measured beside Pgc1α such as Pgc1β, Sirt3, receptor interacting protein 140 (Rip140), mitogen-activated protein kinase (Mapk), transcription factor A (Tfam), 5’ AMP-activated protein kinase (Ampk), nuclear respiratory factor 1 (Nfr1), and Nfr2. No significant differences were observed across groups in these genes (Supplementary Figure 2.). It was recently shown that ablation of UCP1 in cold temperature reduced calcium buffering and calcium overload in mice [30]. Moreover, UCP1-independent thermogenic mechanisms which involve enhanced ATP-dependent calcium cycling have been discovered recently [31]. Thus, we measured the expression of several genes involved in calcium cycling. Transient receptor potential vanilloid 2 (Trpv2), a calcium cycling gene, was expressed higher in KO mice fed the HF diet when compared to WT mice fed HF, with no effect of EPA in both WT and KO genotypes (Figure 6.E.). We also measured other calcium cycling genes such as sarcolipin, and ryanodine receptor 1 (Ryr), but the expression was lower than the detection limit (data not shown).
Figure. 6. Gene expression of thermogenic and calcium cycling markers in interscapular BAT in WT and UCP1 KO mice fed a HF diet vs. EPA. Thermogenic markers:

A: Pgc1α, B: Sirt1, C: Ucp1, D: Ucp2, E: Trpv2. Data are expressed as mean± SEM. WT, wild-type; KO, knock out; HF, high fat. Groups represented with same letter indicate no difference. p <0.05; n =10 mice per group.
To confirm the changes identified in gene expression, we examined protein levels of UCP1 and PGC1α. There was no difference in UCP1 levels between HF and EPA in the WT group, (Figure 7.A. and B.), and as expected, UCP1 was undetectable in both KO groups. PGC1α protein levels were comparable between WT-HF and KO-HF (Figure 7.A. and C.). However, in the KO genotype, EPA significantly increased (P<0.05) PGC1α at protein level compared to the HF diet.
Figure. 7. Interscapular BAT protein content in WT and UCP1 KO mice fed a HF diet vs. EPA.
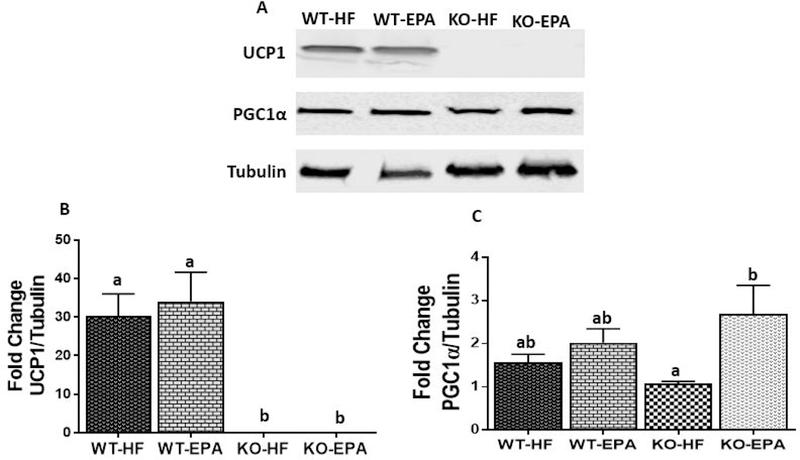
A: UCP1 and Pgc1α protein content. B and C: Blots were normalized to α-Tubulin. Data are expressed as mean± SEM. WT, wild-type; KO, knock out; HF, high fat. Groups represented with same letter indicate no difference. p <0.05; n =6 mice per group.
3.6. Loss of UCP1 decreased oxygen consumption, which was rescued by EPA feeding
Omega 3 fatty acids have previously been reported to increase energy expenditure and oxygen consumption at 22°C in mice [32]. In our studies, oxygen consumption was significantly lower in the KO-HF compared to WT-HF mice (P<0.05). No effect of EPA was observed in the WT mice; however, EPA significantly increased oxygen consumption in the KO mice. These data demonstrate that at thermoneutrality, EPA did not increase oxygen consumption in the WT mice but increased it in the KO mice, demonstrating that effects of EPA may be independent of UCP1 (Figure 8.A.).
Figure. 8. (A) Oxygen consumption rate, (B) mitochondria DNA (mtDNA).

measured as a ratio of mtDNA to nuclear DNA (nucDNA) in WT and UCP1 KO mice fed a HF diet vs. EPA. Data are expressed as mean± SEM. WT, wild-type; KO, knock out; HF, high fat. Groups represented with same letter indicate no difference. p <0.05; n= 4–6 mice per group.
As BAT has tremendous amounts of mitochondria, we determined overall mitochondrial health based on mitochondrial/nucleic DNA ratio. WT mice fed EPA had no differences in mtDNA/nucDNA ratio compared to WT mice fed HF. However, KO mice fed EPA showed significant increase in mtDNA/nucDNA ratio compared to KO-HF group and levels were comparable to WT groups (Figure 8.B). Significant effect of genotype and diet interaction was observed for oxygen consumption, as KO genotype in both diets displayed significantly decreased oxygen consumption (Table 1).
3.7. Effect of EPA and UCP1 ablation on mitochondria markers in thermoneutral environment
The respiratory chain complexes (component I, II, III, IV, and V) were measured at thermoneutrality (Figure 9. A.–F). In both groups of KO genotype (HF and EPA), COX I and COX IV protein levels were significantly decreased compared to the WT genotype (Figure 9, B. and E.). For COX II and COX III, only KO-HF group showed significant decreased levels compared to WT mice fed EPA group. COX V levels did not differ between the 4 groups (Figure 9. C. D. and F.). No interaction between genotype and diet was observed (Table 2). We also performed immunofluorescent staining with UCP1 and mitochondrial marker COX IV to examine mitochondrial changes, which showed UCP1 and COX IV positive staining in BAT sections in both WT and KO genotypes with two different diets (HF and EPA) in Fig 10. A. and Fig 10.B.. WT genotypes showed stronger staining of UCP1 and COX IV compared to KO genotypes consistent with higher protein expression in wildtype mice.
Figure. 9. Interscapular BAT OXPHOS protein content in WT and UCP1 KO mice, fed a HF diet vs. EPA.

(A) COX I, II, III, IV, V protein content. (B-F) blots were normalized to GAPDH. Data are expressed as mean± SEM. WT, wild-type; KO, knock out; HF, high fat. Groups represented with same letter indicate no difference. p <0.05, n= 6 mice per group.
Table 2. Effects of diet, genotype, and interaction on gene and protein expression in male mice in thermoneutral environment.
WT, wild-type; KO, knock out; HF, high fat. Significant P values (0.05); n 5–10 mice per group.
| P-value |
|||
|---|---|---|---|
| Variable | Geno (WT&KO) |
Diet (HF&EPA) |
Geno X Diet |
| Pgc1α (mRNA) | NS | 0.001 | NS |
| Ucp1 (mRNA) | 0.0001 | NS | NS |
| Ucp2 (mRNA) | 0.0001 | NS | NS |
| Sirt1 (mRNA) | 0.0001 | 0.01 | NS |
| Fgfr1 (mRNA) | 0.0001 | 0.04 | NS |
| Trpv2 (mRNA) | 0.005 | NS | NS |
| PGC1α (protein) | NS | 0.01 | NS |
| UCP1 (protein) | 0.0001 | NS | NS |
| COX I (protein) | 0.0003 | NS | NS |
| COX II (protein) | 0.008 | NS | NS |
| COX III (protein) | 0.002 | NS | NS |
| COX IV (Protein) | 0.0001 | NS | NS |
Figure. 10. Immunofluorescence analysis (10×) of UCP1 and COX IV expression.
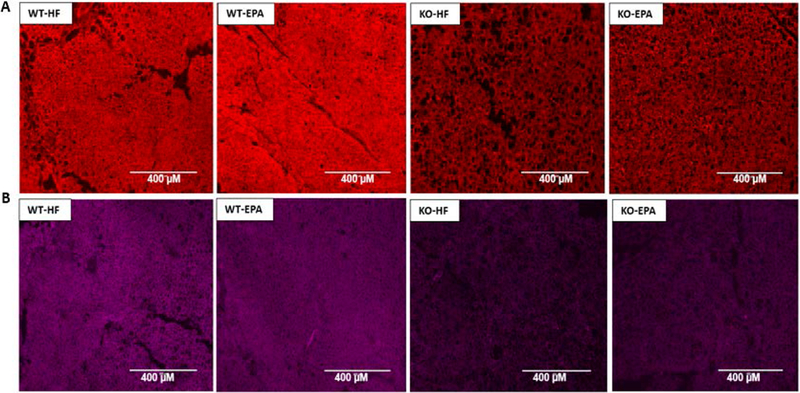
of interscapular BAT in WT and UCP1 KO mice sections, fed a HF diet vs. EPA in thermoneutral environment. WT, wild-type; KO, knock out; HF, high fat, n=3.
4. Discussion
Activation of brown or beige adipocytes has been proposed as a promising approach to combat obesity. This is due to their ability to increase thermogenesis and energy expenditure, which has been primarily shown in rodents [21]. Recent studies have also confirmed that a metabolically active BAT exists in adult humans [18, 33]. These findings provide new insights into mechanisms that control energy expenditure in humans and have identified novel targets to prevent and treat obesity [34]. With respect to thermogenesis-related energy expenditure, environmental temperature is a crucial factor that determines the amount of energy that is used for thermogenesis [35, 36]. By increasing environmental temperature, especially in winter, as a comfortable state in modern society, the amount of heat that the body dissipates to maintain temperature is minimized [37]. By contrast, lower ambient temperatures (15–16°C) can induce BAT/beige fat activation and enhance non-shivering thermogenesis and reduce weight in both mice and humans [37, 38]. Most studies have used cold exposure (4°C) to activate thermogenesis in BAT/beige fat [35, 39, 40]. However, the metabolic outcomes of thermoneutrality on brown or beige adipose tissue function and obesity are less clear.
UCP1 is the major master regulator of thermogenesis, responsible for cold-induced BAT activation and thermogenesis, and studies have shown that UCP1 deficiency in rodents induces obesity at thermoneutrality [15, 17]. Moreover, we have previously shown that EPA activates BAT at ambient temperature [28]. Whether these effects of EPA are UCP1 dependent have not been explored. Thus, to address these questions, we maintained WT and UCP1 KO mice at thermoneutrality and fed them a HF diet with or without EPA, to determine whether EPA-induced BAT activation requires UCP1 and whether this occurs at thermoneutrality.
Ablation of UCP1 caused significantly increase in weight gain, higher fat percentage compared to WT mice, despite their comparable food intake, indicating UCP1 KO mice to be energy efficient and have reduced energy expenditure, which is expected to be in part affected by the thermoneutral environment. Winn et al. have previously reported that UCP1 KO mice gained more weight compared to WT mice when fed western diets (45% kcal fat) or control diet, (10% kcal fat) consistent with our results, but those studies were performed at 25°C [41]. Therefore, it seems that loss of UCP1 causes weight gain regardless of environmental temperature. Moreover, a negative association between thermoneutrality and the thermogenic program was reported [15, 17]. Our findings demonstrate that UCP1 deficiency exacerbated the effects of HF diet at thermoneutrality, as KO mice gained more weight and adiposity than WT mice fed HF. Consistent with our results, UCP1 deficient mice fed HF diet had WAT-like unilocular adipocytes appearing in BAT depots at 25°C [41]. On the other hand, BAT in WT mice stained darker with H&E with higher mitochondrial content compared to KO mice [41, 42]. Previous studies have also shown that thermoneutrality increases BAT mass in obesity-resistant strain A/J male mice fed a HF diet (60% kcal fat) giving rise to a pale color, indicating that increased environmental temperature triggers BAT whitening [15]. In line with these studies, several studies have reported increased adiposity in HF-fed mice at thermoneutral conditions, [15, 17, 43], while others did not [44, 45]. In respect to human studies, combination of HF diet with high indoor temperature, often used in developed countries, especially in winter, may be important factors that contribute to obesity [36, 39]. Tibetan subjects living at higher altitude with lower temperature (10–15°C) showed lower BMI, waist circumference, and waist-to-height compared to subjects living in lower altitude with higher temperature (22–33°C) [46]. Our results showed that UCP1 KO mice fed EPA had significant increase in Pgc1α expression, a factor important for mitochondrial biogenesis. Other studies have shown that UCP1 deficiency is compensated through increase in levels of other thermogenic genes to protect against energy imbalance [41, 47, 48]. Furthermore, as we reported here, ablation of UCP1 significantly decreased oxygen consumption in other studies, which were conducted at 22–25° suggestive of lower fat oxidation [30, 41, 49, 50].
Oxidative phosphorylation (OXPHOS) enzymes produce the majority of cellular energy in the form of ATP in mitochondria [51]. UCP1 KO mice fed HF diet at thermoneutrality showed a significant decrease in protein levels of COX I, COX II, and COX IV compared to WT in BAT which is consistent with our data [30, 41, 52]. Furthermore, while EPA did not significantly increase COX II protein levels in the KO mice compared to KO fed HF diets, it brought the levels up to that of the WT mice. These findings suggest potential protective effects of EPA on these mitochondria markers in the absence of UCP1. COX V have not shown any difference across the groups which is consistent with other studies [30, 41].
While BAT primary function is thermogenesis, several studies in animals and humans have reported its involvement in regulating glucose homeostasis and insulin sensitivity [53, 54]. BAT content and its activity are inversely associated with insulin resistance and type II diabetes [54]. One interpretation is that lower amount of BAT will lead to reduced glucose uptake, thus increasing the risk for type II diabetes [55]. UCP1 is required for glucose uptake by BAT and its deficiency in the KO mice prevents adrenergic stimulation of glucose utilization [56]. These findings are supported by results from Thoonen et al. showing that glucose intolerance in UCP1 KO mice was restored by BAT transplantation [57]. In line with these studies, we demonstrated that KO HF fed mice exhibited impaired glucose clearance compared to WT mice. Given the excessive whitening of BAT in KO mice, this glucose intolerance may be mediated by white fat in the BAT [41].
Ablation of UCP1 causes reduced calcium buffering and is highly sensitive to mitochondria permeability transition by reactive oxygen species (ROS) and calcium overload in mice at cold temperature [30]. As a surrogate for calcium influx, we measured expression of Trpv2 expression. TRP ion channels consist of major class of calcium-permeable channels (TRPV1, TRPV2, TRPV3, TRPV4) [58]. Intake of fish oil activates Trpv1 and UCP1 in BAT and WAT of mice and enhances energy expenditure at ambient temperature [32]. In our current study, we measured the expression of Trpv2, since it is highly expressed in mouse brown adipocytes and involved in thermogenesis. Trpv2 mediates calcium influx by β-adrenergic receptor activation [58]. We observed significant upregulation of Trpv2 in KO-HF group which is in line with the study which show upregulation of Trpv2 expression in BAT from HF diet induced obesity suggesting that Trpv2 induces thermogenesis at ambient temperature [59].
mtDNA number is a fundamental element of overall mitochondrial health and a component of the electron transport chain (ETC), which is critical for oxidative phosphorylation (OXPHOS) [60]. Kazak et. al, have shown that mtDNA-encoded transcripts were significantly reduced in BAT of UCP1-KO mice after cold exposure, however, at 30°C, no change was observed between WT and KO genotypes [30]. This data is consistent with our findings which show no differences in mtDNA observed between two genotypes (WT and KO). However, UCP1 KO mice fed EPA had significant higher levels of mtDNA compared to UCP1 KO mice fed HF, suggesting protective effect of EPA in UCP1 knockout mice. This corroborates with Pgc1a data, as well as oxygen consumption, which was also upregulated in the UCP1 KO mice fed EPA compared to KO mice fed HF. Nathan et al, have investigated the effect of diets (western and low fat diets) and genotypes (WT and UCP1 KO) and their interaction in mice [41]. They found a significant effect of diet on final body weight, VAT weight and fat percentage and significant effect of diet and genotype interaction on BAT weight and energy expenditure. Also, they found significant effect of genotype only in OXPHOS enzymes [41]. All of these results are consistent with our findings, however, it is worth noting that they used ambient temperature.
In previous studies, EPA and DHA increased UCP levels in tissues such as BAT, liver and muscle [61–63]. Moreover, recently we showed that HF diet enriched in EPA (> 90% purity) significantly increased BAT UCP1 protein as well as expression of several other thermogenic markers in mice maintained at ambient temperature, with no detected browning of subcutaneous fat [28]. Kim et al, also reported that mice supplemented with fish oil at 23°C induced UCP1 in both brown and beige adipocytes, however, they used fish oil (EPA 28%, DHA 12% or DHA 25%, EPA 8%) instead of pure EPA [32]. In line with this study, Ghandour et al., showed that the thermogenic activity of brown and beige adipocytes is also influenced by the dietary intake of omega 3 fatty acids in mice [64]. However, all of these studies were performed at ambient temperatures ranging from 22 to 25°C, rather than thermoneutral environment (28–30°). used in our study.
In our current study, we demonstrated that at thermoneutral environment, most metabolic effects of EPA were abolished in the WT mice but not in the KO mice. One interpretation is that EPA exerts its protective effects to reduce weight and increase thermogenesis at 22°C, which induces thermal stress in rodents [15]. In contrast, EPA significantly improved glucose homeostasis in KO groups, confirming that the protective effect of EPA against glucose intolerance is independent of UCP1 and environmental temperature. Furthermore, while UCP1 inactivation reduced oxygen consumption compared to WT, EPA significantly rescued this oxygen consumption to the level observed in the WT mice. Given that these EPA protective effects only occurred in KO groups, it is plausible that alternate mechanisms mediating regulation of BAT by EPA in absence of UCP1 may operate, possibly through increasing PGC1α and UCP2 in adipose or muscle [41, 65].
In some studies, fish oil intake prevented the development of obesity in rodents [66, 67]. It also reduced body fat accumulation in rodents more effectively than other dietary oils [68], through different mechanisms, such as proliferation and differentiation of fat cells [69], and metabolic changes in adipose tissue [64], and small intestines [70]. Bargut et al. have reported that C57BL/6 male mice fed HF diet supplemented with fish oil showed less body mass, triglycerides, CD36 and elevated thermogenic markers such as Pgc1α and Ucp1 in BAT in ambient temperature, compared to diet without fish oil [61]. Another study showed that fish oil intake elevated oxygen consumption, Ucp1, Pgc1α, Cpt1b, Cidea, Prdm16, Fgf21 at gene levels in BAT and inguinal WAT in mice to attenuate fat storage, body weight gain and increase energy expenditure at ambient temperature [32].
Previous studies from our lab demonstrated that feeding mice high-fat (HF) diets enriched with EPA, 36 g/kg (same amount as current study), decreased inflammation, adiposity and insulin resistance in mice maintained at 22°C, independent of energy intake [26]. This amount is equivalent to 6.75% of energy intake in diet. In comparison, the intakes of EPA and DHA in the United States are low for omega 3 long chain PUFAs ranging between ~0.1–0.2 g/d [71] and the current recommendations vary from 1 g/d to 4 g/d [72] with the upper levels necessary to reduce hypertriglyceridemia. Higher doses of PUFAs have been used in human studies ranging from 4.2 g/day [73] to15 g/day as reported in a meta-analysis study [74, 75]. However, in these human studies, the effect of fish oil on obesity and related metabolic conditions such as insulin resistance is inconsistent. Some factors responsible for these inconclusive results include usage of lower doses in human studies compared to animal studies, genetic variabilities in humans compared to animal models and different types of fatty acids and treatment durations, used for clinical research [76, 77].
5. Conclusion
In summary, our study for the first time provided detailed analysis of the metabolic phenotype of the UCP1 KO compared to WT male mice housed in a thermoneutral environment, while fed isocaloric HF or HF-enriched EPA diets. Ablation of UCP1 aggravated HF diet-induced glucose intolerance in UCP1 KO mice. Notably, we found that the beneficial effects of EPA in obesity and insulin resistance are independent of UCP1.
WT-HF mice had comparable body weight, BAT weight, oxygen consumption, glucose tolerance, and thermogenic markers including Ucp1 and Pgc1α, compared to WT-EPA mice. Thus, response of WT mice to EPA was attenuated at thermoneutrality. By contrast, in UCP1 KO mice, EPA significantly decreased body weight, BAT weight, glucose intolerance, while increasing thermogenic markers, such as Pgc1α, mtDNA/nucDNA ratio, and oxygen consumption. These effects may reflect compensatory mechanisms that the body developed when UCP1 is absent and demonstrate UCP1-independent protective effects of EPA. Additional cell and molecular studies are necessary to dissect the mechanisms underlying these differential effects of EPA, and compensatory mechanisms of BAT in UCP1 deficient mice, as well as those mechanisms mediating the response of BAT metabolism and function at thermoneutrality. It would be worthwhile to determine the effects of DHA, omega 3 fatty acid lipid mediators vs whole fish oil on thermogenesis at thermoneutral environment and in absence of UCP1; and whether these findings can be translated in clinical studies.
Supplementary Material
Acknowledgements/funding
We thank members of the Dr. Moustaid-Moussa’s lab for their assistance with this project, namely London Mena and Dr. Iurii Koboziev. This research was supported primarily by NIH/NCCIH grant #R15AT008879–01A1 (NMM) and startup funds from Texas Tech University, and the Obesity Research Cluster. WF was supported by funds from São Paulo Research Foundation (FAPESP #2015/19530–5).
Abbreviations:
- 2-DG
2-deoxyglucose
- Ampk
5’ AMP-activated protein kinase
- AUC
area under the curve
- BAT
brown adipose tissue
- Cidea
cell death-inducing DFFA-like effector A
- COX
cyclooxygenase
- Cytb
cytochrome b
- DHA
docosahexaenoic acid
- EPA
eicosapentaenoic acid
- ETC
electron transport chain
- FDG
fluorodeoxyglucose
- GDP
guanosine diphosphate
- GTT
glucose tolerance test
- HET
heterozygote
- HF
high-fat
- IL
interleukin
- ITT
insulin tolerance test
- Klb
Klotho Beta
- KO
knockout
- Mapk
mitogen-activated protein kinase
- mtDNA
mitochondria DNA
- Nd
mitochondrially encoded
- NADH
ubiquinone oxidoreductase core subunit
- Nrf
nuclear respiratory factor 1
- nucDNA
nuclear DNA
- PET
positron emission tomography
- PGC1α
peroxisome proliferator-activated receptor gamma coactivator 1 alpha
- Prdm16
PR domain containing 16
- PUFA
polyunsaturated fatty acid
- PVDF
polyvinylidene fluoride
- qPCR
quantitative polymerase chain reaction
- Rip140
receptor interacting protein 140
- ROS
reactive oxygen species
- Ryr
ryanodine receptor 1
- TBP
TATA binding protein
- Tfam
transcription factor A, mitochondrial
- Trpv2
transient receptor potential vanilloid 2
- Serca2b
sarcoplasmic/endoplasmic reticulum calcium ATPase 2b
- Sirt1
sirtuin 1
- SNS
sympathetic nervous system
- UCP
uncoupling protein
- VAT
visceral adipose tissue
- WAT
white adipose tissue
- WT
wild type
Footnotes
Conflict of interest
There is no conflict of interest for this study.
References:
- [1].Hales CM, Carroll MD, Fryar CD, Ogden CL, Prevalence of Obesity Among Adults and Youth: United States, 2015–2016. NCHS data brief 2017, 1–8. [PubMed] [Google Scholar]
- [2].Ogden CL, Carroll MD, Flegal KM, Prevalence of obesity in the United States. Jama 2014, 312, 189–190. [DOI] [PubMed] [Google Scholar]
- [3].Cummins TD, Holden CR, Sansbury BE, Gibb AA, Shah J, Zafar N, Tang Y, Hellmann J, Rai SN, Spite M, Bhatnagar A, Hill BG, Metabolic remodeling of white adipose tissue in obesity. American journal of physiology. Endocrinology and metabolism 2014, 307, E262–277. [DOI] [PMC free article] [PubMed] [Google Scholar]
- [4].Wu J, Cohen P, Spiegelman BM, Adaptive thermogenesis in adipocytes: is beige the new brown? Genes Dev 2013, 27, 234–250. [DOI] [PMC free article] [PubMed] [Google Scholar]
- [5].Symonds ME, Brown Adipose Tissue Growth and Development. Scientifica 2013, 2013, doi: 10.1155/2013/305763. [DOI] [PMC free article] [PubMed] [Google Scholar]
- [6].Harms M, Seale P, Brown and beige fat: development, function and therapeutic potential. Nat Med 2013, 19, 1252–1263. [DOI] [PubMed] [Google Scholar]
- [7].Symonds ME, Mostyn A, Pearce S, Budge H, Stephenson T, Endocrine and nutritional regulation of fetal adipose tissue development. The Journal of endocrinology 2003, 179, 293–299. [DOI] [PubMed] [Google Scholar]
- [8].Cannon B, Nedergaard J, Brown adipose tissue: function and physiological significance. Physiological reviews 2004, 84, 277–359. [DOI] [PubMed] [Google Scholar]
- [9].Pfeifer A, Hoffmann LS, Brown, beige, and white: the new color code of fat and its pharmacological implications. Annual review of pharmacology and toxicology 2015, 55, 207–227. [DOI] [PubMed] [Google Scholar]
- [10].Jastroch M, Uncoupling protein 1 controls reactive oxygen species in brown adipose tissue. Proceedings of the National Academy of Sciences of the United States of America 2017, 114, 7744–7746. [DOI] [PMC free article] [PubMed] [Google Scholar]
- [11].Furukawa S, Fujita T, Shimabukuro M, Iwaki M, Yamada Y, Nakajima Y, Nakayama O, Makishima M, Matsuda M, Shimomura I, Increased oxidative stress in obesity and its impact on metabolic syndrome. J Clin Invest 2004, 114, 1752–1761. [DOI] [PMC free article] [PubMed] [Google Scholar]
- [12].Dalgaard LT, Pedersen O, Uncoupling proteins: functional characteristics and role in the pathogenesis of obesity and Type II diabetes. Diabetologia 2001, 44, 946–965. [DOI] [PubMed] [Google Scholar]
- [13].Poher A-L, Veyrat-Durebex C, Altirriba J, Montet X, Colin DJ, Caillon A, Lyautey J, Rohner-Jeanrenaud F, Ectopic UCP1 Overexpression in White Adipose Tissue Improves Insulin Sensitivity in Lou/C Rats, a Model of Obesity Resistance. Diabetes 2015, 64, 3700. [DOI] [PubMed] [Google Scholar]
- [14].Carey AL, Vorlander C, Reddy-Luthmoodoo M, Natoli AK, Formosa MF, Bertovic DA, Anderson MJ, Duffy SJ, Kingwell BA, Reduced UCP-1 content in in vitro differentiated beige/brite adipocytes derived from preadipocytes of human subcutaneous white adipose tissues in obesity. PLoS One 2014, 9, e91997. [DOI] [PMC free article] [PubMed] [Google Scholar]
- [15].Cui X, Nguyen NL, Zarebidaki E, Cao Q, Li F, Zha L, Bartness T, Shi H, Xue B, Thermoneutrality decreases thermogenic program and promotes adiposity in high-fat diet-fed mice. Physiological reports 2016, 4. [DOI] [PMC free article] [PubMed] [Google Scholar]
- [16].Kozak LP, Anunciado-Koza R, UCP1: its involvement and utility in obesity. International journal of obesity (2005) 2008, 32, S32–S38. [DOI] [PMC free article] [PubMed] [Google Scholar]
- [17].Feldmann HM, Golozoubova V, Cannon B, Nedergaard J, UCP1 ablation induces obesity and abolishes diet-induced thermogenesis in mice exempt from thermal stress by living at thermoneutrality. Cell Metab 2009, 9, 203–209. [DOI] [PubMed] [Google Scholar]
- [18].Nedergaard J, Bengtsson T, Cannon B, Unexpected evidence for active brown adipose tissue in adult humans. American journal of physiology. Endocrinology and metabolism 2007, 293, E444–452. [DOI] [PubMed] [Google Scholar]
- [19].Virtanen KA, Lidell ME, Orava J, Heglind M, Westergren R, Niemi T, Taittonen M, Laine J, Savisto NJ, Enerback S, Nuutila P, Functional brown adipose tissue in healthy adults. The New England journal of medicine 2009, 360, 1518–1525. [DOI] [PubMed] [Google Scholar]
- [20].Carey AL, Kingwell BA, Brown adipose tissue in humans: Therapeutic potential to combat obesity. Pharmacol Ther 2013, 140. [DOI] [PubMed] [Google Scholar]
- [21].Chechi K, Nedergaard J, Richard D, Brown adipose tissue as an anti-obesity tissue in humans. Obesity reviews : an official journal of the International Association for the Study of Obesity 2014, 15, 92–106. [DOI] [PubMed] [Google Scholar]
- [22].Marken Lichtenbelt WD, Vanhommerig JW, Smulders NM, Drossaerts JM, Kemerink GJ, Bouvy ND, Cold-activated brown adipose tissue in healthy men. The New England journal of medicine 2009, 360. [DOI] [PubMed] [Google Scholar]
- [23].Chondronikola M, Annamalai P, Chao T, Porter C, Saraf MK, Cesani F, Sidossis LS, A percutaneous needle biopsy technique for sampling the supraclavicular brown adipose tissue depot of humans. International journal of obesity 2015, 39, 1561–1564. [DOI] [PMC free article] [PubMed] [Google Scholar]
- [24].Porter C, Herndon DN, Chondronikola M, Chao T, Annamalai P, Bhattarai N, Saraf MK, Capek KD, Reidy PT, Daquinag AC, Kolonin MG, Rasmussen BB, Borsheim E, Toliver-Kinsky T, Sidossis LS, Human and Mouse Brown Adipose Tissue Mitochondria Have Comparable UCP1 Function. Cell Metab 2016, 24, 246–255. [DOI] [PMC free article] [PubMed] [Google Scholar]
- [25].Wortman P, Miyazaki Y, Kalupahana NS, Kim S, Hansen-Petrik M, Saxton AM, Claycombe KJ, Voy BH, Whelan J, Moustaid-Moussa N, n3 and n6 polyunsaturated fatty acids differentially modulate prostaglandin E secretion but not markers of lipogenesis in adipocytes. Nutrition & metabolism 2009, 6, 5. [DOI] [PMC free article] [PubMed] [Google Scholar]
- [26].Kalupahana NS, Claycombe K, Newman SJ, Stewart T, Siriwardhana N, Matthan N, Lichtenstein AH, Moustaid-Moussa N, Eicosapentaenoic acid prevents and reverses insulin resistance in high-fat diet-induced obese mice via modulation of adipose tissue inflammation. The Journal of nutrition 2010, 140, 1915–1922. [DOI] [PubMed] [Google Scholar]
- [27].Swanson D, Block R, Mousa SA, Omega-3 Fatty Acids EPA and DHA: Health Benefits Throughout Life. Advances in nutrition 2012, 3, 1–7. [DOI] [PMC free article] [PubMed] [Google Scholar]
- [28].Pahlavani M, Razafimanjato F, Ramalingam L, Kalupahana NS, Moussa H, Scoggin S, Moustaid-Moussa N, Eicosapentaenoic acid regulates brown adipose tissue metabolism in high-fat-fed mice and in clonal brown adipocytes. Journal of Nutritional Biochemistry 2016, 39, 101–109. [DOI] [PubMed] [Google Scholar]
- [29].Ayala JE, Samuel VT, Morton GJ, Obici S, Croniger CM, Shulman GI, Wasserman DH, McGuinness OP, Standard operating procedures for describing and performing metabolic tests of glucose homeostasis in mice. Disease models & mechanisms 2010, 3, 525–534. [DOI] [PMC free article] [PubMed] [Google Scholar]
- [30].Kazak L, Chouchani ET, Stavrovskaya IG, Lu GZ, Jedrychowski MP, Egan DF, Kumari M, Kong X, Erickson BK, Szpyt J, Rosen ED, Murphy MP, Kristal BS, Gygi SP, Spiegelman BM, UCP1 deficiency causes brown fat respiratory chain depletion and sensitizes mitochondria to calcium overload-induced dysfunction. Proceedings of the National Academy of Sciences of the United States of America 2017, 114, 7981–7986. [DOI] [PMC free article] [PubMed] [Google Scholar]
- [31].Ikeda K, Kang Q, Yoneshiro T, Camporez JP, Maki H, Homma M, Shinoda K, Chen Y, Lu X, Maretich P, Tajima K, Ajuwon KM, Soga T, Kajimura S, UCP1-independent signaling involving SERCA2b-mediated calcium cycling regulates beige fat thermogenesis and systemic glucose homeostasis. Nat Med 2017, 23, 1454–1465. [DOI] [PMC free article] [PubMed] [Google Scholar]
- [32].Kim M, Goto T, Yu R, Uchida K, Tominaga M, Kano Y, Takahashi N, Kawada T, Fish oil intake induces UCP1 upregulation in brown and white adipose tissue via the sympathetic nervous system. Scientific reports 2015, 5, 18013. [DOI] [PMC free article] [PubMed] [Google Scholar]
- [33].Muzik O, Mangner TJ, Granneman JG, Assessment of oxidative metabolism in brown fat using PET imaging. Frontiers in endocrinology 2012, 3, 15. [DOI] [PMC free article] [PubMed] [Google Scholar]
- [34].Lee P, Swarbrick MM, Ho KK, Brown adipose tissue in adult humans: a metabolic renaissance. Endocr Rev 2013, 34, 413–438. [DOI] [PubMed] [Google Scholar]
- [35].Chen KY, Brychta RJ, Linderman JD, Smith S, Courville A, Dieckmann W, Herscovitch P, Millo CM, Remaley A, Lee P, Celi FS, Brown fat activation mediates cold-induced thermogenesis in adult humans in response to a mild decrease in ambient temperature. The Journal of clinical endocrinology and metabolism 2013, 98, E1218–1223. [DOI] [PMC free article] [PubMed] [Google Scholar]
- [36].Moellering DR, Smith DL, Ambient Temperature and Obesity. Current obesity reports 2012, 1, 26–34. [DOI] [PMC free article] [PubMed] [Google Scholar]
- [37].Yang HK, Han K, Cho JH, Yoon KH, Cha BY, Lee SH, Ambient Temperature and Prevalence of Obesity: A Nationwide Population-Based Study in Korea. PLoS One 2015, 10, e0141724. [DOI] [PMC free article] [PubMed] [Google Scholar]
- [38].Ravussin Y, LeDuc CA, Watanabe K, Leibel RL, Effects of ambient temperature on adaptive thermogenesis during maintenance of reduced body weight in mice. Am J Physiol Regul Integr Comp Physiol 2012, 303, R438–448. [DOI] [PMC free article] [PubMed] [Google Scholar]
- [39].Lichtenbelt W, Kingma B, van der Lans A, Schellen L, Cold exposure--an approach to increasing energy expenditure in humans. Trends in endocrinology and metabolism: TEM 2014, 25, 165–167. [DOI] [PubMed] [Google Scholar]
- [40].Rosell M, Kaforou M, Frontini A, Okolo A, Chan Y-W, Nikolopoulou E, Millership S, Fenech ME, MacIntyre D, Turner JO, Brown and white adipose tissues: intrinsic differences in gene expression and response to cold exposure in mice. Am J Physiol-Endoc M 2014, 306, E945–E964. [DOI] [PMC free article] [PubMed] [Google Scholar]
- [41].Winn NC, Vieira-Potter VJ, Gastecki ML, Welly RJ, Scroggins RJ, Zidon TM, Gaines TL, Woodford ML, Karasseva NG, Kanaley JA, Sacks HS, Padilla J, Loss of UCP1 exacerbates Western diet-induced glycemic dysregulation independent of changes in body weight in female mice. Am J Physiol Regul Integr Comp Physiol 2017, 312, R74–r84. [DOI] [PMC free article] [PubMed] [Google Scholar]
- [42].Kontani Y, Wang Y, Kimura K, Inokuma KI, Saito M, Suzuki-Miura T, Wang Z, Sato Y, Mori N, Yamashita H, UCP1 deficiency increases susceptibility to diet-induced obesity with age. Aging Cell 2005, 4, 147–155. [DOI] [PubMed] [Google Scholar]
- [43].van der Stelt I, Hoevenaars F, Široká J, de Ronde L, Friedecký D, Keijer J, van Schothorst E, Metabolic Response of Visceral White Adipose Tissue of Obese Mice Exposed for 5 Days to Human Room Temperature Compared to Mouse Thermoneutrality. Frontiers in Physiology 2017, 8. [DOI] [PMC free article] [PubMed] [Google Scholar]
- [44].Castillo M, Hall JA, Correa-Medina M, Ueta C, Kang HW, Cohen DE, Bianco AC, Disruption of thyroid hormone activation in type 2 deiodinase knockout mice causes obesity with glucose intolerance and liver steatosis only at thermoneutrality. Diabetes 2011, 60, 1082–1089. [DOI] [PMC free article] [PubMed] [Google Scholar]
- [45].Veniant MM, Sivits G, Helmering J, Komorowski R, Lee J, Fan W, Moyer C, Lloyd DJ, Pharmacologic Effects of FGF21 Are Independent of the “Browning” of White Adipose Tissue. Cell Metab 2015, 21, 731–738. [DOI] [PubMed] [Google Scholar]
- [46].Sherpa LY, Deji, Stigum H, Chongsuvivatwong V, Thelle DS, Bjertness E, Obesity in Tibetans aged 30–70 living at different altitudes under the north and south faces of Mt. Everest. International journal of environmental research and public health 2010, 7, 1670–1680. [DOI] [PMC free article] [PubMed] [Google Scholar]
- [47].Keipert S, Kutschke M, Ost M, Schwarzmayr T, van Schothorst EM, Lamp D, Brachthauser L, Hamp I, Mazibuko SE, Hartwig S, Lehr S, Graf E, Plettenburg O, Neff F, Tschop MH, Jastroch M, Long-Term Cold Adaptation Does Not Require FGF21 or UCP1. Cell Metab 2017, 26, 437–446.e435. [DOI] [PubMed] [Google Scholar]
- [48].Keipert S, Kutschke M, Lamp D, Brachthäuser L, Neff F, Meyer CW, Oelkrug R, Kharitonenkov A, Jastroch M, Genetic disruption of uncoupling protein 1 in mice renders brown adipose tissue a significant source of FGF21 secretion. Molecular metabolism 2015, 4, 537–542. [DOI] [PMC free article] [PubMed] [Google Scholar]
- [49].Grimpo K, Volker MN, Heppe EN, Braun S, Heverhagen JT, Heldmaier G, Brown adipose tissue dynamics in wild-type and UCP1-knockout mice: in vivo insights with magnetic resonance. J Lipid Res 2014, 55, 398–409. [DOI] [PMC free article] [PubMed] [Google Scholar]
- [50].Dlasková A, Clarke KJ, Porter RK, The role of UCP 1 in production of reactive oxygen species by mitochondria isolated from brown adipose tissue. Biochimica et Biophysica Acta (BBA) - Bioenergetics 2010, 1797, 1470–1476. [DOI] [PubMed] [Google Scholar]
- [51].Reinecke F, Smeitink JAM, van der Westhuizen FH, OXPHOS gene expression and control in mitochondrial disorders. Biochimica et Biophysica Acta (BBA) - Molecular Basis of Disease 2009, 1792, 1113–1121. [DOI] [PubMed] [Google Scholar]
- [52].Zietak M, Kozak LP, Bile acids induce uncoupling protein 1-dependent thermogenesis and stimulate energy expenditure at thermoneutrality in mice. American journal of physiology. Endocrinology and metabolism 2016, 310, E346–E354. [DOI] [PMC free article] [PubMed] [Google Scholar]
- [53].Stanford KI, Middelbeek RJ, Townsend KL, An D, Nygaard EB, Hitchcox KM, Markan KR, Nakano K, Hirshman MF, Tseng YH, Goodyear LJ, Brown adipose tissue regulates glucose homeostasis and insulin sensitivity. J Clin Invest 2013, 123, 215–223. [DOI] [PMC free article] [PubMed] [Google Scholar]
- [54].Chondronikola M, Volpi E, Børsheim E, Porter C, Annamalai P, Enerbäck S, Lidell ME, Saraf MK, Labbe SM, Hurren NM, Yfanti C, Chao T, Andersen CR, Cesani F, Hawkins H, Sidossis LS, Brown Adipose Tissue Improves Whole-Body Glucose Homeostasis and Insulin Sensitivity in Humans. Diabetes 2014, 63, 4089–4099. [DOI] [PMC free article] [PubMed] [Google Scholar]
- [55].Nedergaard J, Bengtsson T, Cannon B, Three years with adult human brown adipose tissue. Annals of the New York Academy of Sciences 2010, 1212, E20–36. [DOI] [PubMed] [Google Scholar]
- [56].Inokuma K. i., Ogura-Okamatsu Y, Toda C, Kimura K, Yamashita H, Saito M, Uncoupling Protein 1 Is Necessary for Norepinephrine-Induced Glucose Utilization in Brown Adipose Tissue. Diabetes 2005, 54, 1385–1391. [DOI] [PubMed] [Google Scholar]
- [57].Thoonen R, Ernande L, Cheng J, Nagasaka Y, Yao V, Miranda-Bezerra A, Chen C, Chao W, Panagia M, Sosnovik DE, Puppala D, Armoundas AA, Hindle A, Bloch KD, Buys ES, Scherrer-Crosbie M, Functional brown adipose tissue limits cardiomyocyte injury and adverse remodeling in catecholamine-induced cardiomyopathy. Journal of molecular and cellular cardiology 2015, 84, 202–211. [DOI] [PMC free article] [PubMed] [Google Scholar]
- [58].Uchida K, Sun W, Yamazaki J, Tominaga M, Role of Thermo-Sensitive Transient Receptor Potential Channels in Brown Adipose Tissue. Biological & pharmaceutical bulletin 2018, 41, 1135–1144. [DOI] [PubMed] [Google Scholar]
- [59].Sun W, Uchida K, Suzuki Y, Zhou Y, Kim M, Takayama Y, Takahashi N, Goto T, Wakabayashi S, Kawada T, Iwata Y, Tominaga M, Lack of TRPV2 impairs thermogenesis in mouse brown adipose tissue. EMBO reports 2016, 17, 383–399. [DOI] [PMC free article] [PubMed] [Google Scholar]
- [60].Rooney JP, Ryde IT, Sanders LH, Howlett EH, Colton MD, Germ KE, Mayer GD, Greenamyre JT, Meyer JN, PCR based determination of mitochondrial DNA copy number in multiple species. Methods Mol Biol 2015, 1241, 23–38. [DOI] [PMC free article] [PubMed] [Google Scholar]
- [61].Bargut TC, Silva-e-Silva AC, Souza-Mello V, Mandarim-de-Lacerda CA, Aguila MB, Mice fed fish oil diet and upregulation of brown adipose tissue thermogenic markers. Eur J Nutr 2016, 55, 159–169. [DOI] [PubMed] [Google Scholar]
- [62].de Castro GS, Deminice R, Simoes-Ambrosio LM, Calder PC, Jordao AA, Vannucchi H, Dietary docosahexaenoic acid and eicosapentaenoic acid influence liver triacylglycerol and insulin resistance in rats fed a high-fructose diet. Marine drugs 2015, 13, 1864–1881. [DOI] [PMC free article] [PubMed] [Google Scholar]
- [63].Gerling CJ, Whitfield J, Mukai K, Spriet LL, Variable effects of 12 weeks of omega-3 supplementation on resting skeletal muscle metabolism. Applied physiology, nutrition, and metabolism = Physiologie appliquee, nutrition et metabolisme 2014, 39, 1083–1091. [DOI] [PubMed] [Google Scholar]
- [64].Ghandour RA, Colson C, Giroud M, Maurer S, Rekima S, Ailhaud G, Klingenspor M, Amri EZ, Pisani DF, Impact of dietary omega3 polyunsaturated fatty acid supplementation on brown and brite adipocyte function. J Lipid Res 2018, 59, 452–461. [DOI] [PMC free article] [PubMed] [Google Scholar]
- [65].Brand MD, Esteves TC, Physiological functions of the mitochondrial uncoupling proteins UCP2 and UCP3. Cell Metabolism 2005, 2, 85–93. [DOI] [PubMed] [Google Scholar]
- [66].Sadurskis A, Dicker A, Cannon B, Nedergaard J, Polyunsaturated fatty acids recruit brown adipose tissue: increased UCP content and NST capacity. The American journal of physiology 1995, 269, E351–360. [DOI] [PubMed] [Google Scholar]
- [67].Flachs P, Horakova O, Brauner P, Rossmeisl M, Pecina P, Franssen-van Hal N, Ruzickova J, Sponarova J, Drahota Z, Vlcek C, Keijer J, Houstek J, Kopecky J, Polyunsaturated fatty acids of marine origin upregulate mitochondrial biogenesis and induce beta-oxidation in white fat. Diabetologia 2005, 48, 2365–2375. [DOI] [PubMed] [Google Scholar]
- [68].Neschen S, Moore I, Regittnig W, Yu CL, Wang Y, Pypaert M, Petersen KF, Shulman GI, Contrasting effects of fish oil and safflower oil on hepatic peroxisomal and tissue lipid content. American journal of physiology. Endocrinology and metabolism 2002, 282, E395–401. [DOI] [PMC free article] [PubMed] [Google Scholar]
- [69].Puglisi MJ, Hasty AH, Saraswathi V, The role of adipose tissue in mediating the beneficial effects of dietary fish oil. The Journal of nutritional biochemistry 2011, 22, 101–108. [DOI] [PMC free article] [PubMed] [Google Scholar]
- [70].Kimura R, Takahashi N, Lin S, Goto T, Murota K, Nakata R, Inoue H, Kawada T, DHA attenuates postprandial hyperlipidemia via activating PPARalpha in intestinal epithelial cells. J Lipid Res 2013, 54, 3258–3268. [DOI] [PMC free article] [PubMed] [Google Scholar]
- [71].Papanikolaou Y, Brooks J, Reider C, Fulgoni VL, U.S. adults are not meeting recommended levels for fish and omega-3 fatty acid intake: results of an analysis using observational data from NHANES 2003–2008. Nutrition Journal 2014, 13, 31. [DOI] [PMC free article] [PubMed] [Google Scholar]
- [72].Jain AP, Aggarwal KK, Zhang PY, Omega-3 fatty acids and cardiovascular disease. European review for medical and pharmacological sciences 2015, 19, 441–445. [PubMed] [Google Scholar]
- [73].Krebs JD, Browning LM, McLean NK, Rothwell JL, Mishra GD, Moore CS, Jebb SA, Additive benefits of long-chain n-3 polyunsaturated fatty acids and weight-loss in the management of cardiovascular disease risk in overweight hyperinsulinaemic women. International journal of obesity 2006, 30, 1535–1544. [DOI] [PubMed] [Google Scholar]
- [74].Du S, Jin J, Fang W, Su Q, Does Fish Oil Have an Anti-Obesity Effect in Overweight/Obese Adults? A Meta-Analysis of Randomized Controlled Trials. PLoS One 2015, 10, e0142652. [DOI] [PMC free article] [PubMed] [Google Scholar]
- [75].Miller PE, Van Elswyk M, Alexander DD, Long-chain omega-3 fatty acids eicosapentaenoic acid and docosahexaenoic acid and blood pressure: a meta-analysis of randomized controlled trials. American journal of hypertension 2014, 27, 885–896. [DOI] [PMC free article] [PubMed] [Google Scholar]
- [76].Pedersen MH, Mølgaard C, Hellgren LI, Matthiessen J, Holst JJ, Lauritzen L, The Effect of Dietary Fish Oil in addition to Lifestyle Counselling on Lipid Oxidation and Body Composition in Slightly Overweight Teenage Boys. Journal of nutrition and metabolism 2011, 2011, 348368. [DOI] [PMC free article] [PubMed] [Google Scholar]
- [77].DeFina LF, Marcoux LG, Devers SM, Cleaver JP, Willis BL, Effects of omega-3 supplementation in combination with diet and exercise on weight loss and body composition. Am J Clin Nutr 2011, 93, 455–462. [DOI] [PubMed] [Google Scholar]
Associated Data
This section collects any data citations, data availability statements, or supplementary materials included in this article.