Abstract
Objective
To investigate the association between mineral intake (potassium, magnesium, calcium, phosphorus, iron, zinc, manganese, copper) and multiple sclerosis (MS) risk.
Methods
In a prospective cohort study, we assessed dietary and supplemental mineral intake by a validated food frequency questionnaire administered every 4 years to 80,920 nurses in the Nurses' Health Study (1984–2002) and 94,511 in the Nurses' Health Study II (1991–2007). There were 479 new MS cases during follow-up. We estimated hazard ratios and 95% confidence intervals for the association of energy-adjusted mineral intake with MS risk using Cox regression, adjusting for age, residence latitude at age 15, ancestry, body mass index at age 18, supplemental vitamin D, smoking, and total energy intake.
Results
We did not find any association between the minerals and MS risk, either for baseline or cumulative intake during follow-up. The associations were null comparing women with highest to those with lowest intakes in quintiles or deciles and there was no significant trend for higher intakes (ptrend across baseline quintiles: potassium 0.35, magnesium 0.13, calcium 0.22, phosphorus 0.97, iron 0.85, zinc 0.67, manganese 0.48, copper 0.59).
Conclusions
Our findings suggest that mineral intake is not an important determinant of MS risk.
Higher vitamin D intake from multivitamins has been associated with a lower multiple sclerosis (MS) risk, but an additional beneficial effect of other multivitamin components could not be excluded.1 Minerals may play a role in MS pathogenesis due to their involvement in cell function, enzymatic activity, and immunobiological and antioxidative mechanisms.2,3
Results of previous studies suggest that minerals could play a role in MS activity and progression.4–7 In one study, imbalances in serum trace elements and decreased serum antioxidant capacity were related to conversion to definite MS after a first clinical event.5 Yet, disease-related mechanisms or treatment after disease onset could underlie these changes and the evidence for a role of minerals in MS pathogenesis is scarce and preliminary, as based on ecological, cross-sectional, and retrospective studies.8–12 Zinc has been of particular interest due to its immune-regulating anti-inflammatory and antioxidant potential.2,13 While zinc levels seemed to be lower in patients with MS6 and zinc may ameliorate experimental autoimmune encephalomyelitis, an MS animal model,14,15 its role in MS etiology is unclear.
We therefore investigated prospectively whether intake of the minerals potassium, magnesium, calcium, phosphorus, iron, zinc, manganese, and copper were associated with MS risk in the Nurses' Health Study (NHS) and the Nurses' Health Study II (NHSII), 2 large US cohorts of women with a long follow-up.
Methods
Study design
The NHS and NHSII are prospective cohort studies that started in 1976 (NHS, 121,700 participants) and 1989 (NHSII, 116,671 participants), including female registered nurses who lived in 11 (NHS) or 14 (NHSII) US states, and were 30–55 (NHS) and 25–42 (NHSII) years old at inclusion. They are followed over time with biennial self-administered questionnaires collecting information on a variety of lifestyle exposures and health-related outcomes, with a high response rate (about 90%) in both cohorts in each questionnaire cycle.
Standard protocol approvals, registrations, and patient consents
The institutional review board of Brigham and Women's Hospital approved these cohort studies. The return of a completed questionnaire implied informed consent by the participants.
Assessment of total intake of different minerals
Diet was assessed every 4 years in 80,920 women in NHS (1984–2002) and 94,511 women in NHSII (1991–2007), using a validated semiquantitative food frequency questionnaire (FFQ), described in detail elsewhere.16,17 The FFQs collected information on average portion sizes (e.g., 1 slice of bread, 2 slices of bacon, 1 8-oz glass of milk) and frequency of usual consumption (“never or less than once per month,” “1–3 per month,” “1 per week,” “2–4 per week,” “5–6 per week,” “1 per day,” “2–3 per day,” “4–5 per day,” or “6+ per day”) over the previous year of about 130 different food items covering dairy products, fruits, vegetables, breads/cereals/starches, eggs/meats, beverages, and sweets/baked goods/miscellaneous. In addition, participants were asked about their supplement use. Follow-up questions inquired about brands and frequency (multivitamins) and daily supplementation doses (e.g., zinc: <25, 25–74, 75–100, >100 mg).
Minerals are essential nutrients, some of which are needed in small amounts (trace elements). The FFQ covers the major contributing food and supplemental sources.18 In this study, the main potassium sources (adequate intake [AI]19: 4,700 mg/d) were coffee (contributing 4.0%–8.8% of total intake depending on the year and the cohort), milk (3.6%–9.3%), and potatoes (4.2%–7.3%); the main magnesium sources (Recommended Daily Allowance [RDA]19: 320 mg/d) were multivitamins/magnesium supplements (3.8%–13.6%), coffee (4.0%–10.0%), milk (4.5%–10.1%), and cold cereals (3.5%–5.6%); the main calcium sources (RDA: 1,000 mg/d) were dairy products (17.3%–80.5%) and multivitamins/calcium supplements (9.6%–36.5%); phosphorus (RDA: 700 mg/d) came primarily from dairy products (16.7%–22.5%) and meat (3.3%–7.7%). Top iron sources (RDA: 18 mg/d in women) were multivitamins/iron supplements (22.3%–42.0%), cold cereals (10.2%–17.8%), and beef (2.5%–7.0%); top zinc sources (RDA: 8 mg/d) were multivitamins (10.5%–36.9%), zinc supplements (6.2%–16.2%), beef (3.8%–14.9%), and cold cereals (4.9%–6.9%); top manganese sources (AI: 1.8 mg/d) were multivitamins (9.6%–34.9%), cold cereals (7.5%–12.3%), tea (4.1%–9.8%), and oats (3.1%–7.3%); copper (RDA: 0.9 mg/d) came primarily from multivitamins (13.5%–39.6%), liver (2.4%–8.1%), and potatoes (3.1%–7.2%). The FFQ neither captures copper in drinking water derived from water pipes nor selenium as the amount in plants depends primarily on soil enrichment and varies thus by location.20
The mineral content in different food items and supplements was determined using the Harvard21 FFQ Nutrient Database, which is regularly updated and expanded for average nutrient content. Intakes of each mineral were estimated by multiplying the content of each source by the woman's reported frequency of intake, with frequency weighted such that “1 per day” equaled 1. Total intake of a specific mineral was calculated by summing intake across the different sources. Subsequently, we adjusted the mineral intake for energy intake using the residual method to isolate each mineral's contribution to risk independent of total caloric intake or food quantity consumed.22
The measurement of these minerals by FFQ has been validated in the context of the Women's Lifestyle Validation Study (WLVS), conducted among participants in the NHS and NHSII with data collection over an approximately 1-year period in 2010–2012 to assess the measurement error that can occur when dietary exposures are self-reported.23 Using a slightly expanded version of the FFQ used in the original nurses cohorts with in total 152 food items to include newer foods, the energy-adjusted de-attenuated (random error–corrected) Spearman correlations between the assessment by FFQ with that from 7-day dietary records including foods and supplements were overall strong (potassium: r = 0.65, magnesium: r = 0.75, calcium: r = 0.74, phosphorus: r = 0.67, iron: r = 0.58, zinc: r = 0.68, copper: r = 0.63), as were the correlations with that from 24-hour dietary recalls (potassium: r = 0.64, magnesium: r = 0.73, calcium: r = 0.68, phosphorus: r = 0.68, iron: r = 0.55, zinc: r = 0.53, copper: r = 0.52). Manganese was not assessed in the WLVS, but within a previous study using NHSII data collected by FFQs, manganese intake highly correlated with that of magnesium (r = 0.65) and copper (r = 0.62),24 arguing that FFQs are likely to well capture manganese.
Case ascertainment
Women reported their diagnosis of MS on the biennial questionnaires. We subsequently asked them for permission to contact their treating neurologist and review their medical record. Since 2003, our study neurologist (T.C.) has been reviewing all medical records for confirmation. In this study, we defined the outcome as neurologist-confirmed probable or definite MS diagnosis according to date of diagnosis. Cases of possible MS were not included. There were 479 new cases of probable or definite MS diagnosed during follow-up (130 in NHS, 349 in NHSII) among women who also completed the FFQs. In secondary analyses, we defined the outcome according to date of first symptom. There were overall 289 new cases (59 in NHS, 230 in NHSII) diagnosed with probable or definite MS during follow-up with information on date of onset and diet.
Covariates
We categorized ancestry, reported in 1992 (NHS) and 1989 (NHSII), into Southern European, Scandinavian, Other Caucasian, or Other in this study. Women reported their state of residence at age 15 in 1992 (NHS) and 1993 (NHSII). The states were categorized into northern, middle, and southern tier, as previously described.25 Smoking status was updated biennially including information on number of cigarettes smoked per day, categorized subsequently into pack-years: never, <10, 10–24, and ≥25. Women reported their height at baseline and their weight at age 18 in 1980 (NHS) and 1989 (NHSII). We calculated their body mass index (BMI) in kg/m2 using these measures, and categorized them as underweight, normal, overweight, or obese (<18.5, 18.5 to <25.0, 25 to <30, and ≥30 kg/m2) according to the cutoffs suggested by the WHO. Supplemental vitamin D intake was categorized into none, <400, and ≥400 international units per day. Total energy intake was calculated from the FFQ.
Statistical analyses
We estimated the association between total intakes of different minerals and MS risk during follow-up using Cox proportional hazards regression. To optimize power, we used the date of diagnosis to define the outcome in the main analyses, as fewer cases had a certain date of onset. Study participants contributed, therefore, time at risk (person-years) from date of return of the baseline diet questionnaire (NHS: 1984, NHSII: 1991) to date of MS diagnosis, date of death, or loss to or end of follow-up (NHS: June 2004, NHSII: June 2009), whichever occurred first. We used 1986 as baseline for copper as the assessment in 1984 was incomplete in the NHS. We included the energy-adjusted minerals as exposure in all the analyses and replaced missing exposures with last available values if the participant was not lost to follow-up. We assessed age- and total energy–adjusted as well as multivariable-adjusted hazard ratios (HR) and 95% confidence interval (CI) at a significance level of 0.05. Women with daily caloric intake of below 500 or above 3,500 kcal and those who returned only the baseline questionnaire were excluded from the analyses.
We assessed the total intake at baseline continuously by incremental steps of 100 mg/d for potassium, magnesium, calcium, and phosphorus, and 1 mg/d for iron, zinc, manganese, and copper. For the categorical analyses, we ranked participants into quintiles according to their (1) baseline and (2) cumulative average intake. We also examined whether more extreme exposures were associated with MS risk by ranking participants in deciles according to their baseline total mineral intake. In all categorical analyses, we also assessed whether there was a statistically significant linear trend across the medians within each quantile. The multivariable models were adjusted for ancestry, latitude of residence at age 15, BMI at age 18, pack-years of smoking, supplemental vitamin D, and total energy intake. The latter 3 were updated biennially and introduced into the models as time-varying covariates. We conducted analyses separately for each cohort and then pooled the results using fixed-effects models with the inverse of the variance of the risk estimates as the weight, and a Q statistic to assess heterogeneity.26 Mantel extension tests were performed to examine the trend across the pooled categories.
In secondary analyses, we used date of onset instead of diagnosis to define the outcome and repeated the analyses of continuous and categorical exposures in quintiles (baseline and cumulative intake). Differences in the findings could indicate reverse causation when using diagnosis date, i.e., that the disease or related behavioral changes affected mineral intake after disease onset. As we found an inverse association between zinc intake and MS risk in these secondary analyses, we explored whether changes in zinc intake from diet or supplements after clinical disease onset could explain the discrepancy between results based on date of diagnosis and those based on date of first symptom. To examine this hypothesis, we predated the outcome by 6 years from diagnosis date among MS cases to approximate first symptom. We additionally compared the results for total zinc intake to intake from food only. Further, we assessed whether pre-onset intake, derived from information on the last FFQ prior to first symptom, was important, considering the suggested antimicrobial effects of zinc13,27 and the possible role of viral infections in triggering MS symptoms.28 For this we used total and supplemental intake (including multivitamins) in quintiles and zinc-only supplement use (yes–no). We adjusted these pre-onset analyses also for α-linolenic acid (ALA) intake (in quintiles) based on a previously reported inverse association between ALA and MS in these cohorts.29 For purposes of comparison, last FFQ analyses were also conducted for the other minerals.
Data availability
The datasets analyzed in the current study are not publicly available because of restricted access, but further information about the datasets is available from the corresponding author on reasonable request.
Results
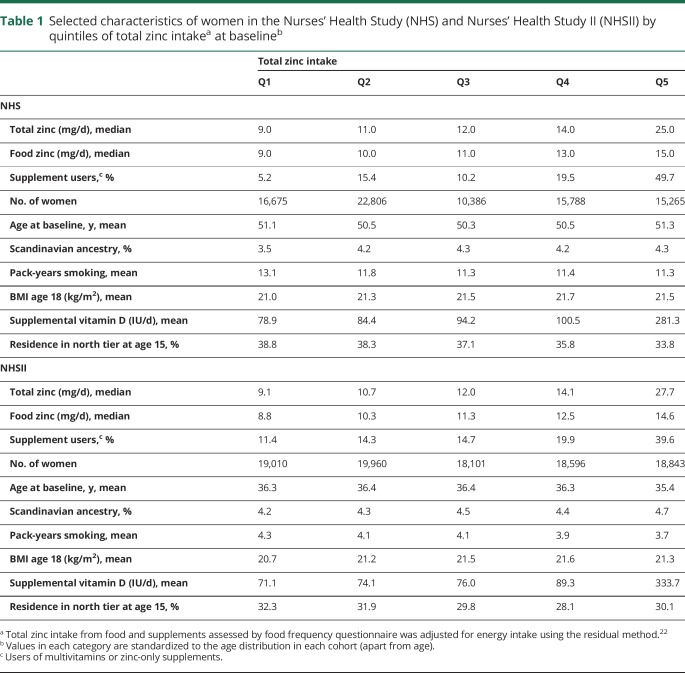
Womens' intake of potassium was on average below RDA while the intake of other minerals was on average at (magnesium, calcium, iron) or above (phosphorus, manganese, zinc, copper) RDA. Women with higher total zinc intake at baseline (table 1) had on average fewer pack-years of smoking, a higher BMI at age 18, and a higher supplementation of vitamin D, and were less likely to have lived in the northern tier at age 15 in both cohorts. Total follow-up amounted to 3,096,941 person-years.
Table 1.
Selected characteristics of women in the Nurses' Health Study (NHS) and Nurses' Health Study II (NHSII) by quintiles of total zinc intakea at baselineb
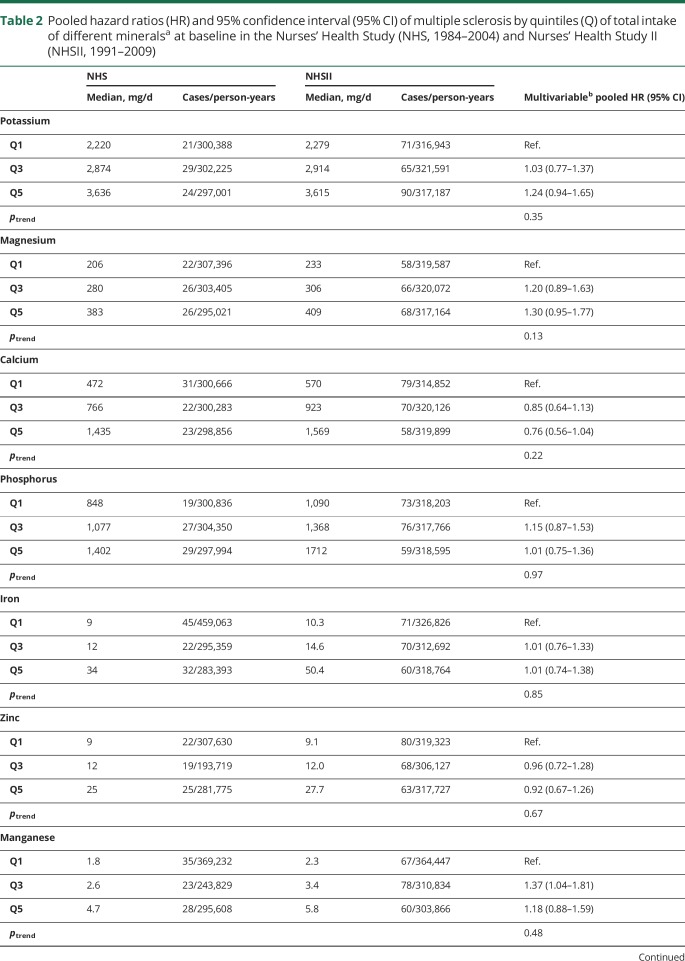
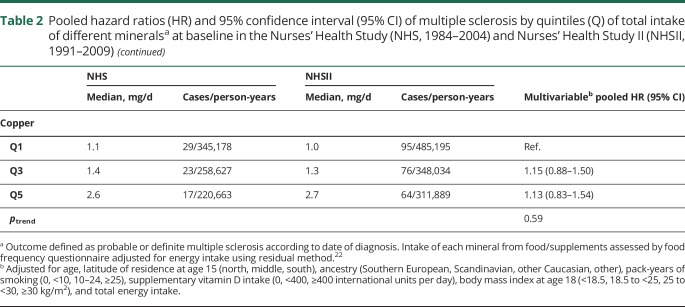
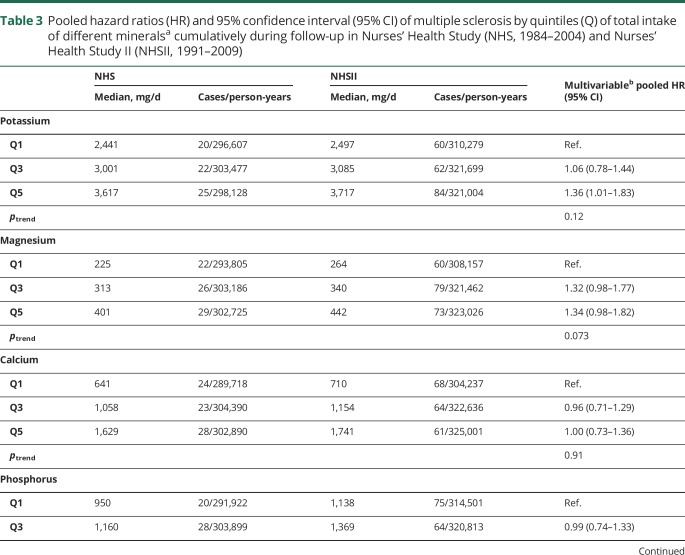
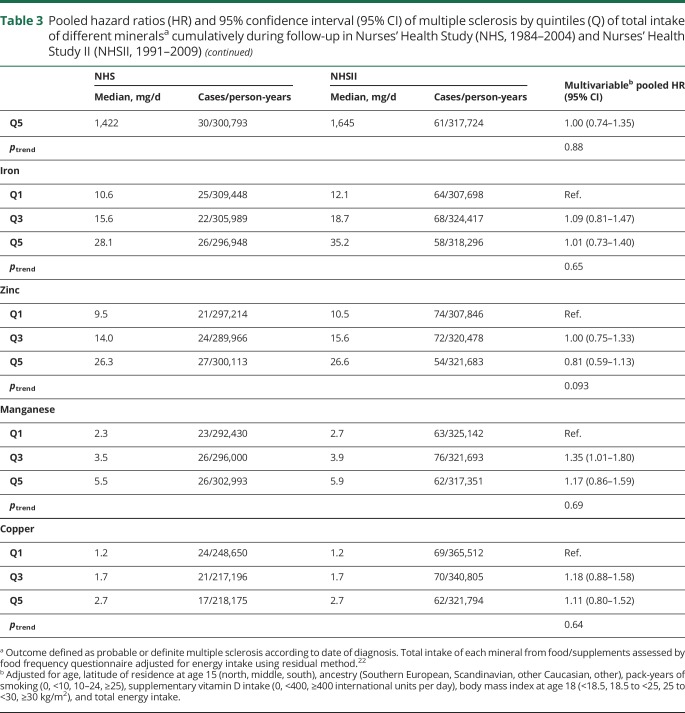
There was no association between mineral intake and MS risk (multivariable HRpooled and 95% CI for 100 mg daily increases in potassium: 1.01, 0.99–1.03, magnesium: 1.08, 0.96–1.22, calcium: 0.99, 0.97–1.02, phosphorus: 1.01, 0.97–1.05; 1 mg daily increases in iron: 1.00, 0.99–1.01, zinc: 1.00, 0.99–1.01, manganese: 1.01, 1.00–1.02, copper: 1.08, 0.95–1.22). We also found no clear association between total mineral intakes at baseline (table 2) as well as cumulatively during follow-up (table 3), when comparing women ranking in the top to those in the bottom quintile. Adjusting the age- and total energy only–adjusted models further for ancestry, latitude of residence at age 15, BMI at age 18, pack-years of smoking, supplemental vitamin D, and total energy intake did not result in any meaningful changes in the effect estimates. Total baseline mineral intakes in deciles were also not related to MS comparing highest to lowest intake and there was no evidence for linear trends across deciles (data not shown). The results were not significantly different between the cohorts, as indicated by probability values from the Q-statistic.
Table 2.
Pooled hazard ratios (HR) and 95% confidence interval (95% CI) of multiple sclerosis by quintiles (Q) of total intake of different mineralsa at baseline in the Nurses' Health Study (NHS, 1984–2004) and Nurses' Health Study II (NHSII, 1991–2009)
Table 3.
Pooled hazard ratios (HR) and 95% confidence interval (95% CI) of multiple sclerosis by quintiles (Q) of total intake of different mineralsa cumulatively during follow-up in Nurses' Health Study (NHS, 1984–2004) and Nurses' Health Study II (NHSII, 1991–2009)
In secondary analyses using date of first symptom as outcome, the results were, similarly, null for these minerals, with the exception of zinc (comparing top to bottom quintile and ptrend across quintiles of cumulative intake, potassium: HRpooled = 1.24, 95% CI 0.85–1.82, ptrend = 0.53; magnesium: HRpooled = 1.07, 95% CI 0.71–1.62, ptrend = 0.63; calcium: HRpooled = 1.18, 95% CI 0.79–1.78, ptrend = 0.96; phosphorus: HRpooled = 0.86, 95% CI 0.58–1.29, ptrend = 0.45; iron: HRpooled = 0.97, 95% CI 0.63–1.50, ptrend = 0.99; manganese: HRpooled = 1.35, 95% CI 0.88–2.06, ptrend = 0.30; copper: HRpooled = 0.75, 95% CI 0.47–1.18, ptrend = 0.25). As opposed to the main findings, women with higher total cumulative zinc intake had a lower MS risk compared to those in the lowest quintile (quintile Q2: HRpooled = 0.80, 95% CI 0.57–1.13; Q3: HRpooled = 0.91, 95% CI 0.64–1.28; Q4: HRpooled = 0.72, 95% CI 0.52–1.08; Q5: HRpooled = 0.52, 95% CI 0.34–0.80, ptrend = 0.004). However, we could not reproduce this finding when using diagnosis date as outcome and, simultaneously, predating end of follow-up by 6 years to exclude the period in which changes in dietary habits and thus, reverse causality were most likely (top to bottom quintile, cumulative intake: HRpooled = 0.87, 95% CI 0.58–1.31, ptrend = 0.67). Further, high cumulative intake of zinc from food only was not associated with MS, both when using diagnosis date (HRpooled = 0.90, 95% CI 0.67–1.21, ptrend = 0.43) and first symptom as outcome (HRpooled = 0.81, 95% CI 0.56–1.18, ptrend = 0.22). Women with the highest total zinc intake (in quintiles) as assessed from last FFQ before onset of symptoms showed a significantly lower MS risk (HRpooled = 0.57, 95% CI 0.38–0.86, ptrend = 0.005); a similar result was obtained for supplemental zinc including multivitamins (HRpooled = 0.60, 95% CI 0.38–0.93, ptrend = 0.008), but no association was found between use of zinc-only supplements and MS (HRpooled comparing use to no use = 1.25, 95% CI 0.87–1.79). Adjusting these multivariable models also for ALA did not change the results. Finally, there was no association between the other minerals' intakes in the years preceding the disease and MS risk (data not shown).
Discussion
In this prospective study, we found no evidence that intake of minerals is related to MS risk. Although we did observe an inverse association between zinc intake and MS risk in secondary analyses that could imply a protective effect, the overall inconsistent results for this mineral and especially the lack of association between the intake of zinc-only supplements contributing the highest doses suggests that zinc alone is unlikely to reduce MS risk. Other factors in diet or related to the intake of multivitamins might be driving the associations seen for some of the zinc exposures, or these may have occurred by chance.
Although in experimental models zinc may induce a more anti-inflammatory immune response by inhibiting the development of pathogenic TH17- and promoting Treg-lymphocytes,13,14,30 these effects could be too subtle within the range of intakes common in the US population to modify MS risk.5
Serum zinc levels are tightly regulated through buffering by protein binding and, provided that dietary intake is sufficient, cellular zinc or the flux across compartments could be more relevant than total intake.13,31,32
This study has several strengths. Information on intake of different minerals was collected prospectively as retrospective studies on dietary exposures are especially prone to biased results.22 FFQs measure mineral intake reasonably well as evidenced by the high correlations with those measured by 7-day diet records and 24-hour dietary recalls.23 Moreover, this method allows ranking of participants according to their mineral intake without relying on exact calculation of absolute intake, which makes misclassification of exposures less likely. Further, we adjusted the analyses for many important MS risk factors and were thus able to examine whether negative confounding underlies the null associations.
Our study has some limitations. It includes only women, mainly of Caucasian descent. The findings cannot be directly generalized to men or individuals of another race or ethnicity. We did not measure mineral levels in the blood, but there are so far no reliable biomarkers of zinc nutritional status as serum levels do not reflect intracellular status.13 Further, exposures were assessed in adulthood and early life exposures that could differ from those in early adulthood might be more relevant.33 Adolescence has been proposed as a susceptibility period for MS risk modification for established risk factors like vitamin D deficiency and symptomatic Epstein-Barr virus infection,34–36 and could extend to other factors. Moreover, the between-person variation of mineral intake in these cohorts might be too small. For example, zinc deficiency is rare in the United States, and more extreme exposures could yield different results. However, the intakes did cover a relatively wide range and more extreme differences in deciles indicated, similarly, no trend. If severe zinc deficiency was associated with MS, then this might have less public health relevance in countries with a high MS burden, in which zinc deficiency is unusual in young adults.31 While the lack of association for use of zinc-only supplements argues against a protective effect of zinc on MS risk, we could not assess a potential dose–response relationship and there might be a beneficial effect for very high doses. Finally, although we could adjust for many important factors, residual negative confounding cannot be excluded.
This study provides evidence that variations in intake of minerals within the range that is common among US women are not associated with MS risk.
Glossary
- AI
adequate intake
- ALA
α-linolenic acid
- BMI
body mass index
- CI
confidence interval
- FFQ
food frequency questionnaire
- HR
hazard ratio
- MS
multiple sclerosis
- NHS
Nurses' Health Study
- NHSII
Nurses' Health Study II
- RDA
Recommended Daily Allowance
- WLVS
Women's Lifestyle Validation Study
Author contributions
M. Cortese contributed to data analysis and interpretation and to drafting and revising the manuscript and figures. T. Chitnis contributed to data acquisition and interpretation and to revising the manuscript and figures. A. Ascherio contributed to obtaining funding, study concept and design, data analysis and interpretation, and revising the manuscript and figures. K.L. Munger contributed to obtaining funding, study concept and design, data analysis and interpretation, and drafting and revising the manuscript and figures.
Study funding
This study was supported by a research grant from the National Multiple Sclerosis Society (PI: Dr. Munger). This work was also supported by the NIH (grants UM1 CA186107, UM1 CA176726).
Disclosure
The authors report no disclosures relevant to the manuscript. Go to Neurology.org/N for full disclosures.
References
- 1.Munger KL, Zhang SM, O'Reilly E, et al. Vitamin D intake and incidence of multiple sclerosis. Neurology 2004;62:60–65. [DOI] [PubMed] [Google Scholar]
- 2.Bredholt M, Frederiksen JL. Zinc in multiple sclerosis: a systematic review and meta-analysis. ASN Neurol 2016;8. [DOI] [PMC free article] [PubMed] [Google Scholar]
- 3.Choi BY, Jung JW, Suh SW. The emerging role of zinc in the pathogenesis of multiple sclerosis. Int J Mol Sci 2017;18. [DOI] [PMC free article] [PubMed] [Google Scholar]
- 4.Ferreira KPZ, Oliveira SR, Kallaur AP, et al. Disease progression and oxidative stress are associated with higher serum ferritin levels in patients with multiple sclerosis. J Neurol Sci 2017;373:236–241. [DOI] [PubMed] [Google Scholar]
- 5.Ristori G, Brescianini S, Pino A, et al. Serum elements and oxidative status in clinically isolated syndromes: imbalance and predictivity. Neurology 2011;76:549–555. [DOI] [PubMed] [Google Scholar]
- 6.Sanna A, Firinu D, Zavattari P, Valera P. Zinc status and autoimmunity: a systematic review and meta-analysis. Nutrients 2018;10. [DOI] [PMC free article] [PubMed] [Google Scholar]
- 7.Hametner S, Wimmer I, Haider L, Pfeifenbring S, Bruck W, Lassmann H. Iron and neurodegeneration in the multiple sclerosis brain. Ann Neurol 2013;74:848–861. [DOI] [PMC free article] [PubMed] [Google Scholar]
- 8.Ghadirian P, Jain M, Ducic S, Shatenstein B, Morisset R. Nutritional factors in the aetiology of multiple sclerosis: a case-control study in Montreal, Canada. Int J Epidemiol 1998;27:845–852. [DOI] [PubMed] [Google Scholar]
- 9.Monti MC, Guido D, Montomoli C, et al. Is geo-environmental exposure a risk factor for multiple sclerosis? A population-based cross-sectional study in south-western Sardinia. PLoS One 2016;11:e0163313. [DOI] [PMC free article] [PubMed] [Google Scholar]
- 10.Nicoletti A, Bruno E, Nania M, et al. Multiple sclerosis in the Mount Etna region: possible role of volcanogenic trace elements. PLoS One 2013;8:e74259. [DOI] [PMC free article] [PubMed] [Google Scholar]
- 11.Pakpoor J, Seminatore B, Graves JS, et al. Dietary factors and pediatric multiple sclerosis: a case-control study. Mult Scler 2018;24:1067–1076. [DOI] [PMC free article] [PubMed] [Google Scholar]
- 12.Schiffer RB. Zinc and multiple sclerosis. Neurology 1994;44:1987–1988. [DOI] [PubMed] [Google Scholar]
- 13.Wessels I, Maywald M, Rink L. Zinc as a gatekeeper of immune function. Nutrients 2017;9. [DOI] [PMC free article] [PubMed] [Google Scholar]
- 14.Rosenkranz E, Maywald M, Hilgers RD, et al. Induction of regulatory T cells in Th1-/Th17-driven experimental autoimmune encephalomyelitis by zinc administration. J Nutr Biochem 2016;29:116–123. [DOI] [PubMed] [Google Scholar]
- 15.Schubert C, Guttek K, Grungreiff K, et al. Oral zinc aspartate treats experimental autoimmune encephalomyelitis. Biometals 2014;27:1249–1262. [DOI] [PubMed] [Google Scholar]
- 16.Salvini S, Hunter DJ, Sampson L, et al. Food-based validation of a dietary questionnaire: the effects of week-to-week variation in food consumption. Int J Epidemiol 1989;18:858–867. [DOI] [PubMed] [Google Scholar]
- 17.Willett WC, Sampson L, Browne ML, et al. The use of a self-administered questionnaire to assess diet four years in the past. Am J Epidemiol 1988;127:188–199. [DOI] [PubMed] [Google Scholar]
- 18.US Department of Agriculture; Agricultural Research Service. USDA food composition databases [online]. Available at: ndb.nal.usda.gov/ndb/nutrients/index. Accessed October 20, 2018.
- 19.US Department of Health & Human Services; National Institutes of Health. Nutrient recommendations: dietary reference intakes [online]. Available at: ods.od.nih.gov/Health_Information/Dietary_Reference_Intakes.aspx. Accessed October 20, 2018.
- 20.US Department of Health & Human Services; National Institutes of Health. Selenium-fact sheet for health professionals [online]. Available at: ods.od.nih.gov/factsheets/Selenium-HealthProfessional/. Accessed October 20, 2018.
- 21.Harvard's TH. School of public health nutrition department's food composition tables [online]. Available at: regepi.bwh.harvard.edu/health/nutrition/repeatUser.html. Accessed October 20, 2018.
- 22.Willett W. Nutritional Epidemiology, 3rd ed. Oxford: Oxford University Press; 2013. [Google Scholar]
- 23.Yuan C, Spiegelman D, Rimm EB, et al. Validity of a dietary questionnaire assessed by comparison with multiple weighed dietary records or 24-hour recalls. Am J Epidemiol 2017;185:570–584. [DOI] [PMC free article] [PubMed] [Google Scholar]
- 24.Chocano-Bedoya PO, Manson JE, Hankinson SE, et al. Intake of selected minerals and risk of premenstrual syndrome. Am J Epidemiol 2013;177:1118–1127. [DOI] [PMC free article] [PubMed] [Google Scholar]
- 25.Hernan MA, Olek MJ, Ascherio A. Geographic variation of MS incidence in two prospective studies of US women. Neurology 1999;53:1711–1718. [DOI] [PubMed] [Google Scholar]
- 26.DerSimonian R, Laird N. Meta-analysis in clinical trials. Control Clin Trials 1986;7:177–188. [DOI] [PubMed] [Google Scholar]
- 27.Qiu M, Chen Y, Chu Y, et al. Zinc ionophores pyrithione inhibits herpes simplex virus replication through interfering with proteasome function and NF-kappaB activation. Antivir Res 2013;100:44–53. [DOI] [PubMed] [Google Scholar]
- 28.Steelman AJ. Infection as an environmental trigger of multiple sclerosis disease exacerbation. Front Immunol 2015;6:520. [DOI] [PMC free article] [PubMed] [Google Scholar]
- 29.Bjornevik K, Chitnis T, Ascherio A, Munger KL. Polyunsaturated fatty acids and the risk of multiple sclerosis. Mult Scler 2017;23:1830–1838. [DOI] [PMC free article] [PubMed] [Google Scholar]
- 30.Kitabayashi C, Fukada T, Kanamoto M, et al. Zinc suppresses Th17 development via inhibition of STAT3 activation. Int Immunol 2010;22:375–386. [DOI] [PubMed] [Google Scholar]
- 31.US Department of Health & Human Services; National Institutes of Health. Zinc: fact sheet for health professionals [online]. Available at: ods.od.nih.gov/factsheets/Zinc-HealthProfessional/. Accessed October 20, 2018.
- 32.Gammoh NZ, Rink L. Zinc in infection and inflammation. Nutrients 2017;9. [DOI] [PMC free article] [PubMed] [Google Scholar]
- 33.Handel AE, Giovannoni G, Ebers GC, Ramagopalan SV. Environmental factors and their timing in adult-onset multiple sclerosis. Nat Rev Neurol 2010;6:156–166. [DOI] [PubMed] [Google Scholar]
- 34.Munger KL, Levin LI, Hollis BW, Howard NS, Ascherio A. Serum 25-hydroxyvitamin D levels and risk of multiple sclerosis. JAMA 2006;296:2832–2838. [DOI] [PubMed] [Google Scholar]
- 35.Salzer J, Hallmans G, Nystrom M, Stenlund H, Wadell G, Sundstrom P. Vitamin D as a protective factor in multiple sclerosis. Neurology 2012;79:2140–2145. [DOI] [PubMed] [Google Scholar]
- 36.Ascherio A, Munger KL. Epidemiology of multiple sclerosis: from risk factors to prevention: an update. Semin Neurol 2016;36:103–114. [DOI] [PubMed] [Google Scholar]
Associated Data
This section collects any data citations, data availability statements, or supplementary materials included in this article.
Data Availability Statement
The datasets analyzed in the current study are not publicly available because of restricted access, but further information about the datasets is available from the corresponding author on reasonable request.


