Abstract
Objective
To perform an individual patient–level data (IPLD) analysis and to determine the relationship between haptoglobin (HP) genotype and outcomes after aneurysmal subarachnoid hemorrhage (aSAH).
Methods
The primary outcome was favorable outcome on the modified Rankin Scale or Glasgow Outcome Scale up to 12 months after ictus. The secondary outcomes were occurrence of delayed ischemic neurologic deficit, radiologic infarction, angiographic vasospasm, and transcranial Doppler evidence of vasospasm. World Federation of Neurological Surgeons (WFNS) scale, Fisher grade, age, and aneurysmal treatment modality were covariates for both primary and secondary outcomes. As preplanned, a 2-stage IPLD analysis was conducted, followed by these sensitivity analyses: (1) unadjusted; (2) exclusion of unpublished studies; (3) all permutations of HP genotypes; (4) sliding dichotomy; (5) ordinal regression; (6) 1-stage analysis; (7) exclusion of studies not in Hardy-Weinberg equilibrium (HWE); (8) inclusion of studies without the essential covariates; (9) inclusion of additional covariates; and (10) including only covariates significant in univariate analysis.
Results
Eleven studies (5 published, 6 unpublished) totaling 939 patients were included. Overall, the study population was in HWE. Follow-up times were 1, 3, and 6 months for 355, 516, and 438 patients. HP genotype was not associated with any primary or secondary outcome. No trends were observed. When taken through the same analysis, higher age and WFNS scale were associated with an unfavorable outcome as expected.
Conclusion
This comprehensive IPLD analysis, carefully controlling for covariates, refutes previous studies showing that HP1-1 associates with better outcome after aSAH.
Aneurysmal subarachnoid hemorrhage (aSAH) survivors experience significant morbidity.1 The strongest predictor of long-term outcome is the World Federation of Neurological Surgeons (WFNS) grade,2 but it explained only 12% of the variance in outcome as determined by the Glasgow Outcome Scale (GOS)3 in the largest study of outcome prediction in aSAH.4 Some studies have suggested that haptoglobin (HP) genotype may also influence outcome,5–9 but results are conflicting.10 A recent meta-analysis found that the HP2 allele was associated with a worse short-term but not long-term outcome.11 This meta-analysis had limitations, including small study sizes, heterogeneity in outcome classification, and inability to control for covariates. The relative contribution of HP genotype to outcome after aSAH in a large cohort, relative to the WFNS and other covariates, remains unknown.
In humans, there are 2 HP alleles, HP1 and HP2, and an individual can be 1 of 3 genotypes: HP1-1, HP2-1, and HP2-2. The main potential mechanism of the HP effect is through the function of its protein (Hp) as a scavenger of extracellular hemoglobin (Hb).10 Because the Hp-Hb scavenging system is active in the CNS after aSAH,12 there is a strong biological rationale to hypothesize that HP genetic variation influences aSAH outcome. We therefore conducted an individual patient–level data (IPLD) analysis of all identified published and unpublished studies to investigate the relationship between HP genotype and outcome after aSAH.
Methods
The IPLD analysis was conducted in accordance with Preferred Reporting Items for Systematic Reviews and Meta-Analyses–Individual Participant Data (PRISMA-IPD) guidelines.13 To ensure rigor, we enrolled early professional statistical input, publicly deposited a protocol defining a priori the outcomes and analytic strategy in June 2017,14 and included all published and unpublished studies identified before analysis. All individual studies had approval from the respective institutions, and the overall IPLD analysis had institutional ethics approval from the University of Southampton.
Search strategy
Published studies were identified by PubMed and Web of Science searches conducted in January 2017 with the key words subarachnoid hemorrhage or subarachnoid hemorrhage and haptoglobin, including reference lists within publications. Abstracts were screened and then full articles were reviewed for eligibility according to the inclusion/exclusion criteria. Two study investigators (B.G. and I.G.) conducted the search. Unpublished studies were identified with the same search terms in Google and via the professional network of the authors in 3 continents (United Kingdom, United States, and Japan).
Inclusion/exclusion criteria
Published and unpublished studies were eligible for inclusion, and there were no restrictions on study design. Inclusion criteria consisted of (1) confirmed aSAH at age >18 years; (2) HP genotype or phenotype available; (3) all essential covariates available (see below); (4) data available and contractual agreement reached by March 31, 2017; and (5) primary outcome measures available at 1 month (±2 weeks) and/or 3 months (±1.5 months) and/or 6 months (4.5–12 months) of aSAH. If >1 outcome was available within each of these time frames, the one closest to 1, 3, or 6 months was used. The only exclusion criterion was non-aSAH.
Data collection and management
The lead authors of all published and unpublished studies identified with the search strategy were contacted verbally or by e-mail and were invited to join the study. IPLD for patients meeting the inclusion/exclusion criteria was requested in spreadsheet format and was stored on a secure server at the University of Southampton, UK. The type of data requested has been published14 (additional Methods available from Eprints, eprints.soton.ac.uk/426525/). Data were collated according to study center and encoded with study and patient identifiers to blind the statistical team.
Quality control
Studies were assessed for risk of bias with the Newcastle-Ottawa Scale. The data underwent a number of quality control checks. Automated screens were conducted to identify nonsensical values (e.g., out-of-range modified Rankin Scale [mRS] and GOS scores, impossible age) and to check internal consistency (e.g., mRS and GOS scores). Data descriptives were used to compare with the expected norm and thereby identify potential errors. Hardy-Weinberg equilibrium (HWE) was assessed as a marker for case missingness. Manual data checks were performed by 4 authors (B.G., D.O.B, D.R., and I.G.) independently. If any inconsistency or missing data were identified or if further clarification was required, the individual study lead was contacted.
Primary outcome
The per-protocol primary outcome was the mRS15 or GOS score,3 dichotomized into favorable and unfavorable. This outcome was selected because it was deemed to be the most clinically relevant outcome and was the most consistently recorded among the studies analyzed. If both mRS and GOS scores were available for the same dataset, the mRS score was used. The GOS score was dichotomized into favorable (GOS score 4–5 [good recovery or moderate disability]) or unfavorable (GOS score 1–3 [severe disability, vegetative state, or death]). The mRS score was dichotomized into favorable (mRS score 0–2 [good recovery, no significant disability, slight disability]) or unfavorable (mRS score 3–6 [moderate disability, moderately severe disability, severe disability, or death]).
Secondary outcomes
The secondary outcomes were delayed cerebral ischemia (DCI), radiologic infarction, angiographic evidence of vasospasm, and transcranial Doppler (TCD) evidence of vasospasm, defined as velocity >200 cm/s. The secondary outcomes could have been at any time during admission for aneurysm rupture. If a secondary outcome variable was not collected in a specific study, that study was not included in the meta-analysis of that secondary outcome.
Covariates
A minimum set of essential covariates was identified a priori to minimize sample size attrition while retaining the strongest known predictors of outcome after aSAH.16 These essential covariates were used for both primary and secondary outcomes: (1) age; (2) Fisher grade, dichotomized into grades 1 + 2 and 3 + 4; (3) admission WFNS or Hunt and Hess grade dichotomized into good (grades 1–3) and poor (grades 4–5); and (4) treatment, categorized into endovascular and surgical. Aneurysms treated conservatively were excluded due to small numbers. If both WFNS and Hunt and Hess grades were available, the WFNS grade was used. For the primary outcome, follow-up time was used as a covariate using longitudinal modeling. During the analysis, subsequent to publication of the protocol, it became apparent that some of these essential covariates resulted in highly sparse cells, especially in small studies. Because WFNS grade is by far the most influential predictor among the minimum essential covariates,4 studies in which WFNS grade could not be included as a covariate were excluded from the analysis. For both primary and secondary outcomes when possible, allowing for sample size and data availability (table e-1available from Eprints, eprints.soton.ac.uk/426525/), additional covariates were used and prioritized in the following order: diabetes mellitus, hypertension, race, and aneurysm site. If additional covariates were used, the same covariates were used in all studies.
Data analysis
The primary analytic strategy was a 2-stage IPLD study design; we also planned a secondary 1-stage IPLD analysis because it is thought that both designs have their individual strengths.17 The primary study statistician (D.R.) mainly conducted the statistical analysis , and a second statistician in the team (T.H.) confirmed the results. The statisticians were blinded to the identification of the studies and patients throughout the analysis. HWE was assessed for all studies included. Two primary comparisons were planned: a binary comparison of HP2-2 vs HP2-1 and HP1-1 (because the previous meta-analysis showed that HP2-1 is similar to HP1-1 with respect to outcome) and a multicategorical comparison of HP1-1 vs HP2-1 vs HP2-2. The primary 2-stage IPLD analysis was performed for the primary and all secondary outcomes as follows. In the first stage, the analysis was conducted for each individual study to estimate the association of outcome with Hp, adjusting for the baseline covariates and time point. Given the binary nature of primary outcomes measured at time points of 1-, 3-, and 6-month follow-up (with studies having 1, 2, or 3 of these time points), generalized estimating equation models with logit link were implemented to account for the correlation between different time points within the same subject for each individual study. The interaction between time point and HP was also checked. Binary logistic regression models were used for all the secondary outcomes because they were associated with only 1 time point. Odds ratios (ORs) and 95% confidence intervals (CIs) from each individual study were estimated from the above models. Cases with missing data were excluded; that is, data were not imputed. In the second stage, ORs from the individual studies were combined by the use of random-effects meta-analysis. Results are reported as ORs with their 95% CIs and corresponding p values. Heterogeneity was assessed with the Higgins and Thompson I2 statistic and Cochrane Q test, and publication bias (small-study effects) was examined with funnel plots and the Egger test. All hypotheses were tested at a nominal significance level of 0.05; that is, the probability of a type I error (α) was 5%. SAS (version 9.4, SAS Institute, Inc, Cary, NC) and STATA (version 14, StataCorp, College Station, TX) were used for all the analyses.
To assess the robustness of results from the above primary analysis, extensive sensitivity and/or subgroup analyses were conducted. We first replicated the analysis using the 1-stage approach with random-effect logistic regression modeling for all outcomes including site as random effect. Next, several subgroup analyses were performed, including exclusion of those studies not in HWE or at high risk of bias, inclusion of studies that do not have all the essential covariates, exclusion of essential covariates, and inclusion of additional covariates as defined above. We also coded GOS or mRS scores in 2 other ways. In the above analysis, we used the traditional approach of dichotomizing of GOS and mRS scores into 2 categories, namely favorable and unfavorable (i.e., GOS scores 1–3 vs 4–5; mRS scores 0–2 vs 3–6), to render statistical analysis and interpretation of results more straightforward and identical to most other published studies. However, this approach poses disadvantages: it discards valuable information of the full ordinal nature of outcome measures and ignores initial prognostic risk of patients.18–21 Hence, 2 alternative approaches were used as part of a sensitivity analysis for the primary outcome. First, in the sliding dichotomy method, the cutoff point for binarization of GOS and mRS scores is differentiated by the predicted baseline prognosis risk.18,21 Instead of defining good or bad outcome for all patients using a single dichotomization point, the sliding dichotomy approach customizes the definition of good outcome according to the baseline prognosis risk of each patient (additional Methods available from Eprints, eprints.soton.ac.uk/426525/). Second, the proportional odds model (also referred to as shift analysis or ordinal logistic regression) was used to analyze the ordinal outcomes. This method is sensitive for detecting a shift of the entire ordinal outcome distribution and estimates a common OR for each of the possible cutoff points of the outcome scale. The common OR is formally valid if the ORs for each cut point are the same (the proportional odds assumption).
Data availability
Anonymized aggregate data will be shared after formal request to the corresponding author in accordance with the University of Southampton's data-sharing policies and contracts with the coauthors and their institutions.
Results
Study inclusion
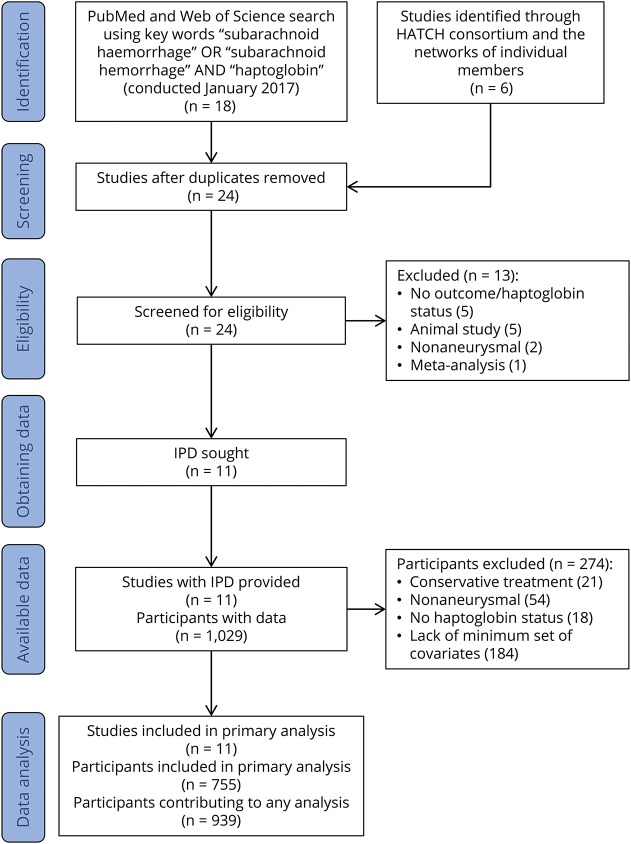
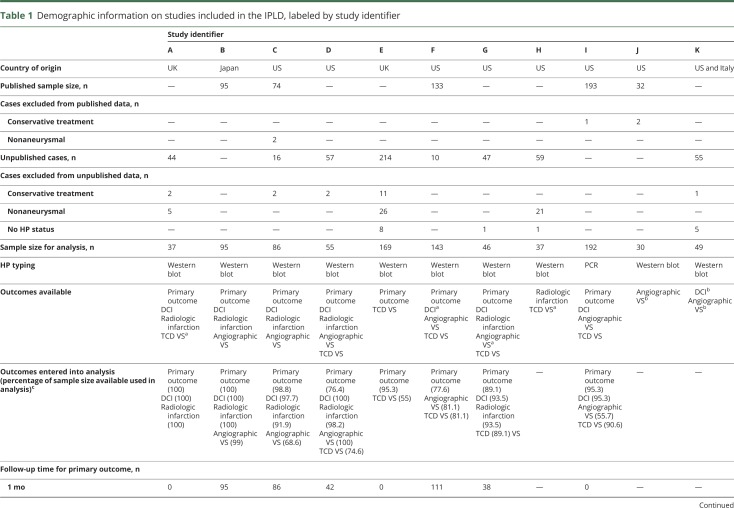
A PRISMA-IPD flow diagram details how studies were identified (figure 1). Of 18 published studies identified in the literature search, 5 were eligible for inclusion in the meta-analysis5–9,22 (table e-2 available from Eprints, eprints.soton.ac.uk/426525/). A further 6 unpublished studies were identified through the Haemoglobin after Intracranial Haemorrhage (HATCH) Consortium (www.southampton.ac.uk/hatch). The lead authors of these 11 eligible studies were invited to join the study, and all provided IPLD. The study characteristics of published and unpublished studies are summarized in table 1. For blinding purposes, each study was allocated a study identifier and is referred to by this identifier throughout the article. Across the 11 studies, 939 patients had IPLD available. Published studies were assessed for risk of bias and attained a score of 5 (of a total of 9 maximum points) with the Newcastle-Ottawa Scale.
Figure 1. Preferred Reporting Items for Systematic Reviews and Meta-Analyses–Individual Patient Data (IPD) flow diagram.
Table 1.
Demographic information on studies included in the IPLD, labeled by study identifier
Demographics
Table 1 summarizes the demographics of the 11 studies included in the meta-analysis. Only 1 study (study I) was significantly out of HWE (p = 0.018). Overall, the IPLD was in HWE (p = 0.663).
Primary outcome
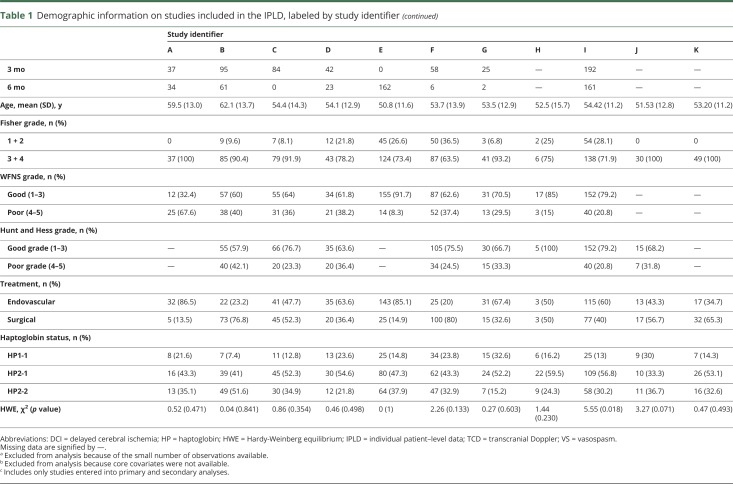
Eight studies (A–G and I), with a total sample size of 755, were included in the primary outcome analysis due to data availability (table e-1 available from Eprints, eprints.soton.ac.uk/426525/). Age, Fisher grade, WFNS grade, treatment, and hypertension were controlled for in all studies except studies B and G, in which inclusion of Fisher grade resulted in highly sparse cells. Follow-up times were as follows: 1, 3, and 6 months for 355, 516, and 438 patients (table 1 for individual studies). Using the 2-stage approach, we identified no association between HP genotype and unfavorable outcome when comparing HP2-2 vs HP2-1 and HP1-1 (OR 0.977, 95% CI 0.672–1.421, p = 0.905) (figure 2A). When taken through the same multivariate analysis, higher age (OR 1.05, 95% CI 1.02–1.08) and WFNS grade (OR 8.4, 95% CI 4.4–15.9) were associated with an unfavorable outcome. Higher Fisher grade was associated with poor outcome (OR 2.6, 95% CI 1.3–5.3), and a trend for hypertension was seen (OR 1.5, 95% CI 0.9–2.4) in univariate analysis only. Treatment was not significant (table e-3 available from Eprints, eprints.soton.ac.uk/426525/). No significant association was identified in subgroup analysis of HP2-2 vs HP1-1, HP2-1 vs HP1-1, HP2-2 vs HP2-1, and HP2-2 and 2-1 vs HP1-1 (table 2 and figure e-1 available from Eprints, eprints.soton.ac.uk/426525/).
Figure 2. Forest plots for 2-stage individual patient–level data analysis for primary outcome (dichotomized modified Rankin Scale score in HP2-2 vs HP2-1 and HP1-1).
An odds ratio (OR) >1 denotes a higher probability of poor outcome. (A) Adjusted for covariates, (B) same as A but including published studies only, and (C) unadjusted for covariates. CI = confidence interval; HP = haptoglobin; ID = identifier.
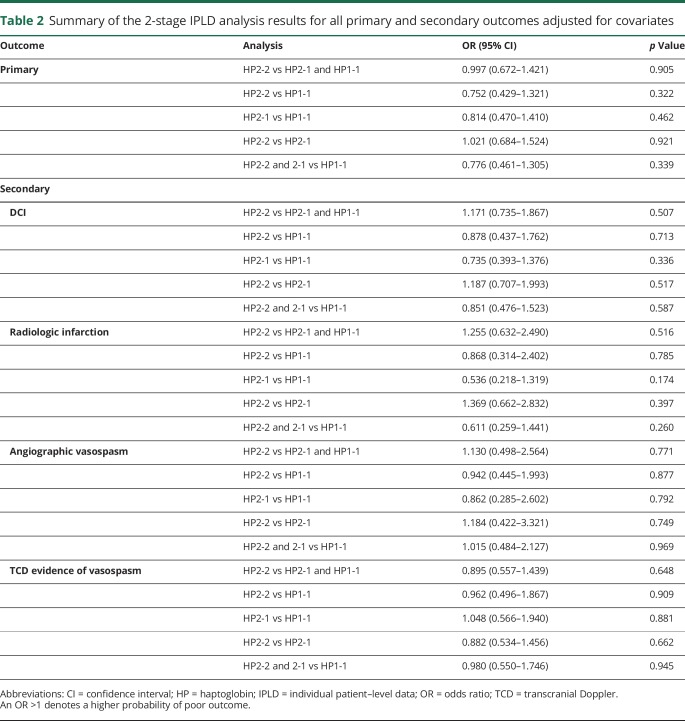
Table 2.
Summary of the 2-stage IPLD analysis results for all primary and secondary outcomes adjusted for covariates
Because not all patients were included in the primary outcome analysis due to data availability, we assessed selection bias in these patients (i.e., only those included in this analysis). With respect to HP genotype, patients were overall in HWE (p = 0.671). Compared to a typical hospital population,23 patients in the primary outcome analysis of this IPLD had similar WFNS grades (grades 4–5, 27.3% vs 24.7%, p = 0.143), similar age (median 54.9 vs 55 years), lower coiling rate compared to clipping (55.8% vs 81.4%, p < 0.001), and a higher incidence of DCI (37.2% vs 21.7%, p < 0.001). Compared to a typical randomized controlled trial population,24 patients in the primary outcome analysis of this IPLD had similar WFNS grades (grades 4–5, 27.3% vs 22.9%, p = 0.05), lower Fisher grade (grades 3–4, 77.3% vs 84.2%, p = 0.001), higher age (mean 54.7 vs 50 years, p < 0.001), lower coiling rate compared to clipping (55.8% vs 66.9%, p < 0.001), higher incidence of DCI (37.2% vs 16%, p < 0.001), and similar favorable dichotomized mRS score at 6 months (74% vs 71.7%, p = 0.353).
Secondary outcomes
The preplanned secondary outcomes were DCI, radiologic infarction, angiographic vasospasm, and TCD evidence of vasospasm. All analyses were conducted comparing HP2-2 vs HP2-1 and HP1-1, HP2-2 vs HP1-1, HP2-1 vs HP1-1, HP2-2 vs HP2-1, and HP2-2 and 2-1 vs HP1-1. Only results for HP2-2 vs HP2-1 and HP1-1 are detailed in the text below; the other comparisons are summarized in table 2 (and their forest plot data, figures e-2–e-5 available from Eprints, eprints.soton.ac.uk/426525/).
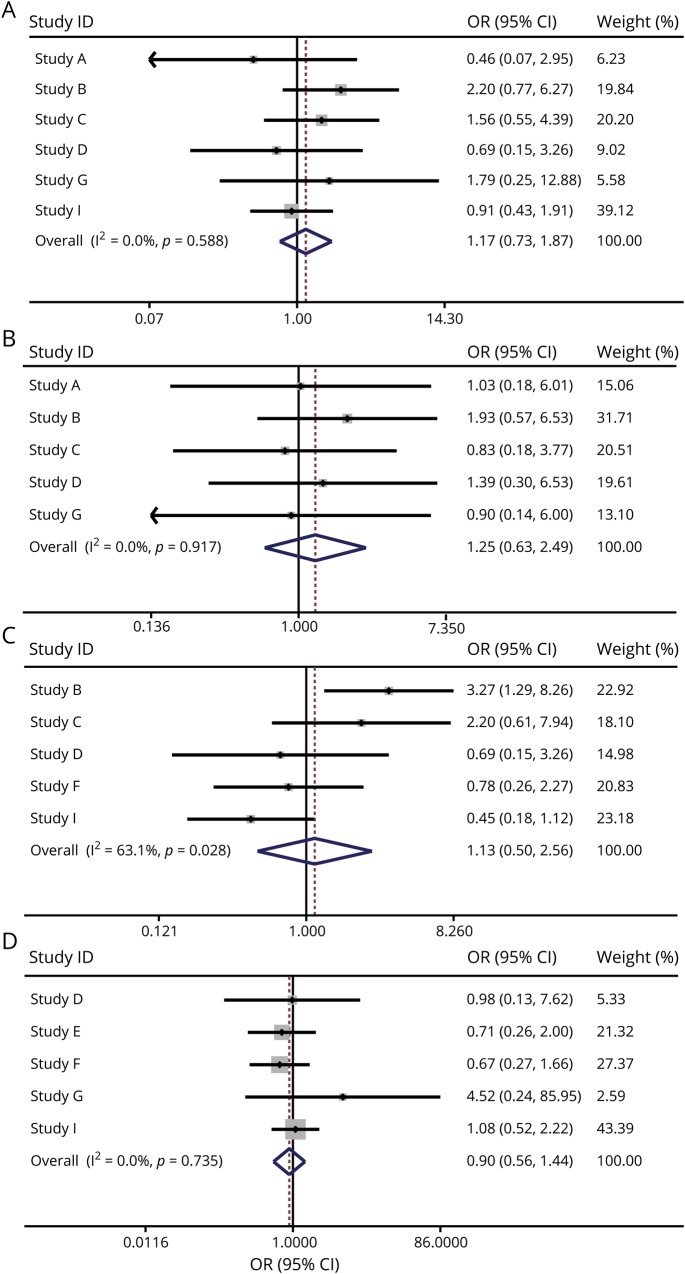
Six studies (A–C, D, G, and I), with a total sample size of 497, were included in the secondary outcome analysis for DCI. Age, Fisher grade, WFNS grade, treatment, and hypertension were controlled for in all studies except studies B, C, and G. Fisher grade was not controlled for in studies B, C, and G due to highly sparse cells. Using the 2-stage approach, we identified no association between HP genotype and DCI when comparing HP2-2 vs HP2-1 and HP1-1 (OR 1.171, 95% CI 0.735–1.867, p = 0.507) or other permutations of HP subgroups (figure 3A and table 2).
Figure 3. Forest plots for 2-stage individual patient–level data analysis for secondary outcomes adjusted for covariates (HP2-2 vs HP2-1 and HP1-1).
An odds ratio (OR) >1 denotes a higher probability of poor outcome. (A) Delayed cerebral ischemia, (B) radiologic infarction, (C) angiographic evidence of vasospasm, and (D) transcranial Doppler evidence of vasospasm. CI = confidence interval; HP = haptoglobin; ID = identifier.
Five studies (A–D and G), with a total sample size of 308, were included in the secondary outcome analysis for radiologic infarction. Age, Fisher grade, WFNS grade, treatment, hypertension, and aneurysm location were controlled for in all studies except studies B and C. Fisher grade was not controlled in studies B and C due to highly sparse cells. Using the 2-stage approach, we identified no association between HP genotype and radiologic infarction when comparing HP2-2 vs HP2-1 and HP1-1 (OR 1.255, 95% CI 0.632–2.490, p = 0.516) (figure 3B and table 2).
Five studies (B–D, F, and I), with a total sample size of 431, were included in the secondary outcome analysis for the presence of angiographic evidence of vasospasm. Age, Fisher grade, WFNS grade, treatment, and hypertension were controlled for in all studies. Using the 2-stage approach, we identified no association between HP genotype and angiographic evidence of vasospasm when comparing HP2-2 vs HP2-1 and HP1-1 (OR 1.130, 95% CI 0.498–2.564, p = 0.771) (figure 3C and table 2).
Five studies (D–G and I), with a total sample size of 465, were included in the secondary outcome analysis for the presence of TCD evidence of vasospasm. Age, Fisher grade, WFNS grade, treatment, and hypertension were controlled for in all studies except study G. Fisher grade and treatment were not controlled in study G due to highly sparse cells. Using the 2-stage approach, we identified no association between HP genotype and TCD evidence of vasospasm when comparing HP2-2 vs HP2-1 and HP1-1 (OR 0.895, 95% CI 0.557–1.439, p = 0.648) (figure 3D and table 2).
Sensitivity analyses
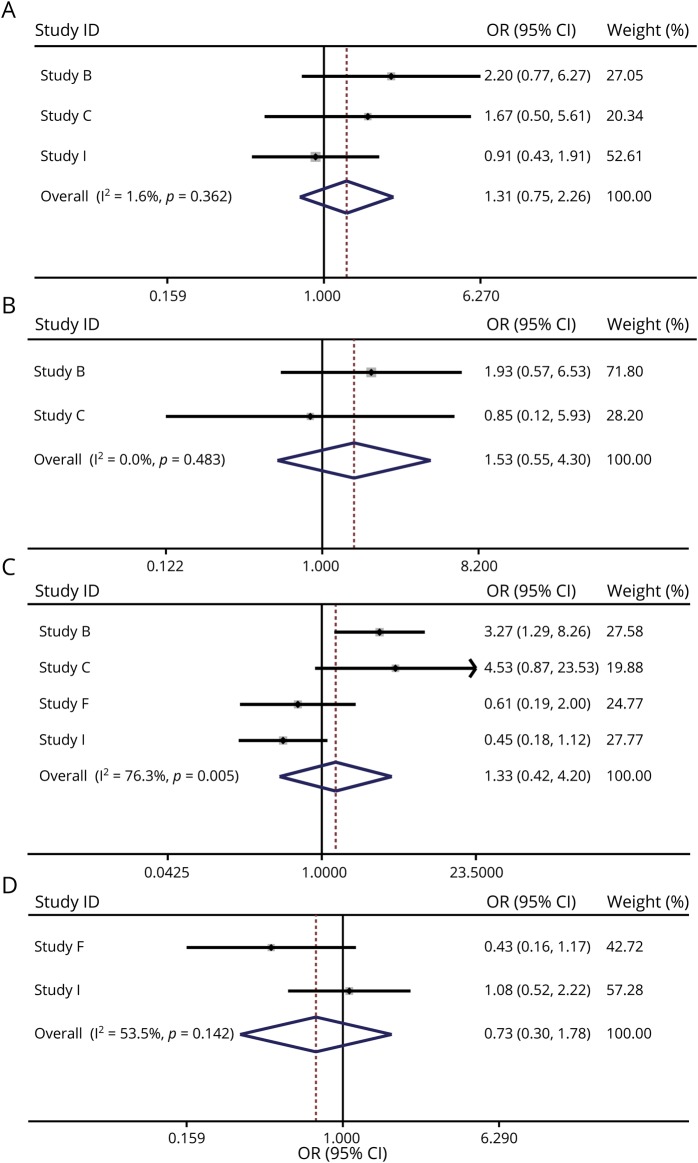
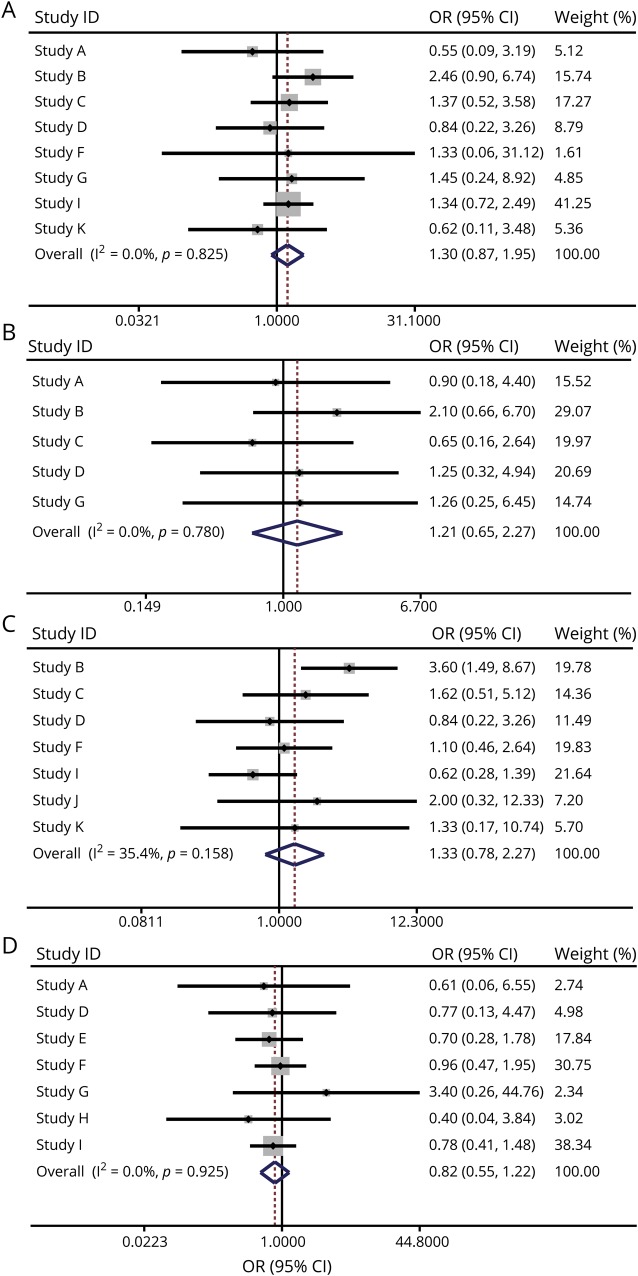
There were 2 main potential reasons to explain the discrepancy between the results here and the data from individual published studies. The first was publication bias; here, we included all studies, and unpublished studies are more likely to be negative. The second was controlling for covariates, because most published studies did not control well for covariates. We proceeded to investigate the relative contribution of these 2 possibilities by repeating the primary analyses for primary (figure 2B) and secondary (figure 4) outcomes using data from published studies alone. We also repeated the primary (i.e., 2-stage IPLD) analyses without adjusting for covariates for both primary (figure 2C) and secondary (figure 5) outcomes. None of these analyses showed a significant difference or a trend suggesting an association.
Figure 4. Forest plots for secondary outcomes, adjusted for covariates, published studies only (HP2-2 vs HP2-1 and HP1-1).
An odds ratio (OR) >1 denotes a higher probability of poor outcome. (A) Delayed cerebral ischemia, (B) radiologic infarction, (C) angiographic evidence of vasospasm, and (D) transcranial Doppler evidence of vasospasm. CI = confidence interval; HP = haptoglobin; ID = identifier.
Figure 5. Forest plots for secondary outcomes, unadjusted for covariates (HP2-2 vs HP2-1 and HP1-1).
An odds ratio (OR) >1 denotes a higher probability of poor outcome. (A) Delayed cerebral ischemia, (B) radiologic infarction, (C) angiographic evidence of vasospasm, and (D) transcranial Doppler evidence of vasospasm. CI = confidence interval; HP = haptoglobin; ID = identifier.
A number of other sensitivity analyses were conducted to evaluate the robustness of the results. These were as follows: (1) exclusion of studies in which patients included in the primary analysis were not in HWE; (2) inclusion of additional covariates; (3) inclusion of studies that did not have all the essential covariates; (4) sliding dichotomy analysis; (5) ordinal regression; (6) 1-stage analysis; (7) unpublished studies only; and (8) including only covariates significant in univariate analysis. For all, the results remained consistent (figures e-6–e-11 and tables e-4–e-6 available from Eprints, eprints.soton.ac.uk/426525/). There were no trends suggesting an association between HP genotype and primary or secondary outcomes in any of these analyses.
Heterogeneity and publication bias
In all analyses, there was little evidence for heterogeneity (I2 range 0%–35.8%, Cochrane Q tests were not significant, p > 0.05) except for angiographic vasospasm (figure 3C and figure e-10C available from Eprints, eprints.soton.ac.uk/426525/). There was no indication of publication bias from funnel plots (Egger regression test, p > 0.05 for all the tests) for any analyses (figures e-12–e-36 available from Eprints, eprints.soton.ac.uk/426525/).
Discussion
As is normal in IPLD methodology, study size was driven by data availability rather than by a predetermined sample size. Prestudy power, by which we mean a power calculation using estimates from prior studies, was performed on data from the largest published study in the IPLD (study I),11 which had an effect size of an OR of 1.8 for comparing HP2-2 vs HP2-1 and HP1-1 on the primary outcome. A logistic regression of the binary response variable (mRS score) on the binary independent variable (HP2-2 vs HP2-1 and HP1-1) with a sample size of 755 subjects (of whom 69% were HP2-1 and HP1-1 and 31% were HP2-2) achieved 94% power at a 0.050 significance level to detect a small to medium effect size of an OR of 1.8 with a 2-sided Wald test. Even with the conservative estimate of an OR of 1.6 (10% reduction of OR = 1.8), power was 79% at a 0.050 significance level to detect the association. Therefore, this study has conclusively proven that HP2-2 is not associated with a poor long-term outcome as defined by the mRS score, down to a minimum OR of 1.6.
Although the reason could simply be that there is no difference in the relative protective effects of different HP genotypes, there are several possible explanations of how a clinical effect could have been missed. First, the mRS and GOS may be insufficiently sensitive outcome measures to detect subtle yet important outcome variation in patients after aSAH, including cognitive impairment, anxiety, and return to work.25,26 Subarachnoid hemorrhage (SAH)–specific outcome measures covering these more subtle outcomes such as the SAH outcome tool,27 may be more sensitive in detecting an association between HP genotype and functional outcome. Another possible reason is that the early brain injury takes longer to settle and expose the final residual permanent deficit influenced by HP genotype. In this study, outcomes were analyzed 2 weeks to 1 year after aSAH; however, improvements have been demonstrated beyond this time. For example, mRS score has been shown to improve in 19% of patients between 12 and 36 months after aSAH.28 Hence, future studies should consider longer follow-up periods.
The negative result for all secondary outcomes is not consistent with the recent meta-analysis that provided evidence that the HP2 allele was associated with worse short-term outcome, including DCI and vasospasm.11 The previous meta-analysis had a number of limitations that may underlie this discrepancy. First, the meta-analysis used a composite definition of short-term outcome grouping DCI or cerebral vasospasm by any definition into 1 binary outcome measure. In comparison, the IPLD analysis here used specific definitions of cerebral vasospasm and DCI, which were analyzed separately. Second, the meta-analysis did not control for covariates known to affect outcome after aSAH, the inclusion of which in the IPLD analysis may explain the different result. The effect sizes observed for the secondary outcomes, besides not achieving statistical significance or showing trends, were extremely small. Taken together, this demonstrates that there is no meaningful, clinically significant difference in these outcomes between HP genotypes.
Although this IPLD analysis included a number of unpublished studies, which may have contributed significantly to the negative result, a sensitivity analysis of published studies only was still negative. It has previously been noted that incorporation of unpublished studies does not significantly change the results of most meta-analyses.29
The binding of Hp to Hb is thought to confer protection via a number of mechanisms, including limiting the oxidative damage potential of Hb,30 facilitating its clearance via the CD163 membrane receptor on macrophages/microglia,31 and generating an anti-inflammatory response.32 The lack of a clear effect of HP genotype on outcome after aSAH in humans contrasts with observations in animal models. Transgenic mice expressing a murine equivalent of human HP2 experienced more vasospasm and functional deficit after experimentally induced SAH compared to wild-type mice.33 However, there are important biological differences between mice and humans. The influence of Hp on the affinity of CD163 to Hb is markedly different,34 and CD163 shedding occurs in humans,12 not mice.35 These differences suggest that the Hb scavenging system is sufficiently different between the 2 species such that extrapolation of the detrimental effect of HP2 observed in this mouse model to humans should be done with extreme caution.
The basic unit of Hp protein is an Hp monomer consisting of 1 α and 1 β subunit. The HP1 allele codes for an α subunit (called α1) with 1 cysteine residue that enables dimerization of the Hp monomer by formation of a disulfide bond. The HP2 allele codes for an α2 subunit that contains an extra cysteine residue compared to α1 and is therefore able to make multiple disulfide bonds, resulting in several polymers of increasing size in HP2-1 heterozygotes and HP2-2 homozygotes.10 Whether there is a functional difference between the proteins expressed by different HP genotypes is controversial and very much depends on which characteristic of Hp one considers. It is well established that Hp expression is influenced by genotype: HP1-1 > HP1-2 > HP2-2.36 Some investigators have demonstrated that the Hp1-1 dimer is more effective than the Hp2-2 polymer in reducing the oxidative potential of Hb,37–39 although other reports suggest that there is no difference.40–42 Binding affinity to CD163 appears to be higher for Hb in complex with Hp2-2 polymer compared to Hp1-1 dimer.31,43 However, studies looking at the uptake of Hb-Hp complexes by CD163-expressing cells are less clear, with some reporting no difference40 and others indicating an increased binding affinity of both Hp1-1 dimer43 and Hp2-2 polymer,44 depending on the experimental conditions. Differences may extend to inflammatory effects because binding of Hp1-1-Hb complexes to CD163 results in secretion of the anti-inflammatory cytokine interleukin-1032,45 at levels several-fold higher compared to Hp2-2-Hb complexes.45 It is also plausible that differences may be unrelated to Hb scavenging. For example, the HP1-1 genotype appears to decrease endothelial progenitor cell cluster formation.46 HP2 has also been associated with poorer clinical outcome in people with diabetes mellitus, ischemic heart disease, and infections,36 suggesting that it may influence outcome after aSAH in individuals with these comorbidities.
HP genotype may not influence outcome after aSAH, even if there are differences between HP genotypes in Hb scavenging efficiency. Recently, CD163 expression by neurons has been demonstrated in animal models of cerebral hemorrhage.47 Because Hb is normally predominantly taken up in the CNS by microglia, it has been proposed that this increased neuronal CD163 expression may lead to increased neuronal toxicity through uptake of Hb.48 It is therefore possible that any potential protective effect conferred by different HP genotypes may be mitigated by increased neuronal toxicity. To date, CD163 expression by human neurons in situ remains to be demonstrated.
This IPLD analysis provides the most robust evidence to date examining the relationship between HP genotype and outcome after aSAH and has a number of strengths. First, this study has the largest sample size to date,17 although still smaller than usual for genetic studies. Second, the study population was in HWE, excluding significant case missingness or technical problems with genotype/phenotype ascertainment. Third, a number of covariates known to affect outcome after aSAH that have not been consistently controlled for in previous studies were included in the analysis: age, WFNS grade, Fisher grade, and treatment.23,49 Fourth, this study includes a large number of unpublished studies identified through a network of investigators worldwide. Fifth, it uses IPLD. Sixth, all analyses were preplanned; the protocol was published before the analysis was started; and the statisticians were blinded to the identities of the study and HP genotypes (deidentification of the studies was performed at the end, table e-7 available from Eprints, eprints.soton.ac.uk/426525/). Finally, a comprehensive array of statistical approaches was used.
There are several limitations. First, there was minor but significant evidence of selection bias when patients in this study were compared with both a hospital aSAH population23 and a typical aSAH randomized controlled study,24 favoring patients with a lower coiling rate compared to clipping and a higher incidence of DCI. Second, this study was retrospective, and despite the collection of IPLD, the available data limited the choice and number of covariates that could be used. It does not control for other covariates known to be important in predicting outcome after aSAH, including need for CSF diversion and preoperative rebleeding,23 because of a lack of data availability. In addition, although we have controlled for follow-up time, the duration varied significantly between studies. Future studies could examine Hp subunit expression because the Hp α1 chain band intensity may be prognostic in HP2-1 individuals.50
Acknowledgment
The authors thank the University of Southampton Global Partnership Award Scheme and NeuroSpring for their support, as well as Miss Emily Edwards (Mayo), Prof Daniel Laskowitz (Duke), Dr. Satoshi Matsuo, and Dr. Ryota Kurogi (National Hospital Organization Kyushu Medical Center). NeuroSpring is a nonprofit organization with the primary aim of supporting research in the neurosciences leading to new medical therapies (neurospring.org/); one of the authors (M.B.) is a senior scientist at NeuroSpring. Samples and clinical data from the Mayo Clinic in Florida came from the Mayo Clinic Florida Familial Cerebrovascular Diseases Registry (J.F.M., principal investigator).
Glossary
- aSAH
aneurysmal subarachnoid hemorrhage
- CI
confidence interval
- DCI
delayed cerebral ischemia
- GOS
Glasgow Outcome Scale
- Hb
hemoglobin
- Hp
haptoglobin
- HP
haptoglobin gene
- HWE
Hardy-Weinberg equilibrium
- IPLD
individual patient–level data
- mRS
modified Rankin Scale
- OR
odds ratio
- PRISMA-IPD
Preferred Reporting Items for Systematic Reviews and Meta-Analyses–Individual Participant Data
- SAH
subarachnoid hemorrhage
- TCD
transcranial Doppler
- WFNS
World Federation of Neurological Surgeons
Footnotes
Editorial, page 831
Author contributions
D.O. Bulters and I. Galea conceived the study. B. Gaastra, D. Ren, S. Alexander, D.M. Bielawski, S.L. Blackburn, M.K. Borsody, S. Doré, J. Galea, K. Iihara, Y. Kawamura, P.A. Nyquist, D.O. Bulters, and I. Galea contributed to the design of the study. All authors contributed to different aspects of data acquisition. B. Gaastra, D. Ren, T. He, P.A. Nyquist, D.O. Bulters, and I. Galea analyzed the data. D. Ren and T. He performed statistical analyses; B. Gaastra, D. Ren, and I. Galea wrote the first draft of the manuscript. B. Gaastra, D. Ren, D.O. Bulters, P.A. Nyquist, and I. Galea worked on sequential drafts of the manuscript. All authors revised and approved the final version of the manuscript.
Study funding
Funded by the University of Southampton (University of Southampton Global Partnership Award Scheme) and UK Medical Research Council.
Disclosure
The authors report no disclosures relevant to the manuscript. Go to Neurology.org/N for full disclosures.
References
- 1.Rinkel GJ, Algra A. Long-term outcomes of patients with aneurysmal subarachnoid haemorrhage. Lancet Neurol 2011;10:349–56. [DOI] [PubMed] [Google Scholar]
- 2.Teasdale GM, Drake CG, Hunt W, Kassell K, Pertuiset B, De Villiers JC. A universal subarachnoid hemorrhage scale: report of a Committee of the World Federation of Neurosurgical Societies. J Neurol Neurosurg Psychiatry 1988;51:1457. [DOI] [PMC free article] [PubMed] [Google Scholar]
- 3.Jennett B, Bond M. Assessment of outcome after severe brain damage. Lancet 1975;1:480–484. [DOI] [PubMed] [Google Scholar]
- 4.Jaja BNR, Saposnik G, Lingsma HF, et al. Development and validation of outcome prediction models for aneurysmal subarachnoid haemorrhage: the SAHIT multinational cohort study. BMJ 2018;360:j5745. [DOI] [PubMed] [Google Scholar]
- 5.Borsody M, Burke A, Coplin W, Miller-Lotan R, Levy A. Haptoglobin and the development of cerebral artery vasospasm after subarachnoid hemorrhage. Neurology 2006;66:634–640. [DOI] [PubMed] [Google Scholar]
- 6.Kantor E, Bayır H, Ren D, et al. Haptoglobin genotype and functional outcome after aneurysmal subarachnoid hemorrhage. J Neurosurg 2014;120:386–390. [DOI] [PMC free article] [PubMed] [Google Scholar]
- 7.Leclerc JL, Blackburn S, Neal D, Mendez JA, Waters MF, Doré S. Haptoglobin phenotype predicts the development of focal and global cerebral vasospasm and may influence outcomes after aneurysmal subarachnoid hemorrhage. Proc Natl Acad Sci USA 2015;112:1155–1160. [DOI] [PMC free article] [PubMed] [Google Scholar]
- 8.Murthy SB, Caplan J, Levy AP, et al. Haptoglobin 2-2 genotype is associated with cerebral salt wasting syndrome in aneurysmal subarachnoid hemorrhage. Neurosurgery 2016;78:71–76. [DOI] [PubMed] [Google Scholar]
- 9.Ohnishi H, Iihara K, Kaku Y, et al. Haptoglobin phenotype predicts cerebral vasospasm and clinical deterioration after aneurysmal subarachnoid hemorrhage. J Stroke Cerebrovasc Dis 2013;22:520–526. [DOI] [PubMed] [Google Scholar]
- 10.Bulters D, Gaastra B, Zolnourian A, et al. Haemoglobin scavenging in intracranial bleeding: biology and clinical implications. Nat Rev Neurol 2018;14:416–432. [DOI] [PubMed] [Google Scholar]
- 11.Gaastra B, Glazier J, Bulters D, Galea I. Corrigendum to haptoglobin genotype and outcome after subarachnoid haemorrhage: new insights from a meta-analysis. Oxid Med Cell Longev 2018;2018:8. [DOI] [PMC free article] [PubMed] [Google Scholar]
- 12.Galea J, Cruickshank G, Teeling JL, Boche P, Perry VH, Galea I. The intrathecal CD163-haptoglobin-hemoglobin scavenging system in subarachnoid hemorrhage. J Neurochem 2012;121:785–792. [DOI] [PMC free article] [PubMed] [Google Scholar]
- 13.Stewart LA, Clarke M, Rovers M, et al. Preferred reporting items for a systematic review and meta-analysis of individual participant data: the PRISMA-IPD statement. JAMA 2015;313:1657–1665. [DOI] [PubMed] [Google Scholar]
- 14.Gaastra BAS, Bielawski D, Blackburn S, et al. Haptoglobin after subarachnoid haemorrhage: individual patient level data (IPLD) analysis [online]. Available at: http://www.crd.york.ac.uk/PROSPERO/display_record.php?RecordID=70830&VersionID=108574. Accessed March 25, 2019.
- 15.Farrell B, Godwin J, Richards S, Warlow C. The United Kingdom Transient Ischaemic Attack (UK-TIA) aspirin trial: final results. J Neurol Neurosurg Psychiatry 1991;54:1044–1054. [DOI] [PMC free article] [PubMed] [Google Scholar]
- 16.Jaja BN, Cusimano MD, Etminan N, et al. Clinical prediction models for aneurysmal subarachnoid hemorrhage: a systematic review. Neurocrit Care 2013;18:143–153. [DOI] [PubMed] [Google Scholar]
- 17.Riley RD, Lambert PC, Abo-Zaid G. Meta-analysis of individual participant data: rationale, conduct, and reporting. BMJ 2010;340:c221. [DOI] [PubMed] [Google Scholar]
- 18.Murray GD, Barer D, Choi S, et al. Design and analysis of phase III trials with ordered outcome scales: the concept of the sliding dichotomy. J Neurotrauma 2005;22:511–517. [DOI] [PubMed] [Google Scholar]
- 19.Savitz SI, Lew R, Bluhmki E, Hacke W, Fisher M. Shift analysis versus dichotomization of the modified Rankin Scale outcome scores in the NINDS and ECASS-II trials. Stroke 2007;38:3205–3212. [DOI] [PubMed] [Google Scholar]
- 20.Roozenbeek B, Lingsma HF, Maas AI. New considerations in the design of clinical trials for traumatic brain injury. Clin Investig (Lond) 2012;2:153–162. [DOI] [PMC free article] [PubMed] [Google Scholar]
- 21.Ilodigwe D, Murray GD, Kassell NF, Torner RS, Molyneux AJ, Macdonald RL. Sliding dichotomy compared with fixed dichotomization of ordinal outcome scales in subarachnoid hemorrhage trials. J Neurosurg 2013;118:3–12. [DOI] [PubMed] [Google Scholar]
- 22.Vergouwen MD, Vermeulen M, van Gijn J, et al. Definition of delayed cerebral ischemia after aneurysmal subarachnoid hemorrhage as an outcome event in clinical trials and observational studies: proposal of a multidisciplinary research group. Stroke 2010;41:2391–2395. [DOI] [PubMed] [Google Scholar]
- 23.Galea JP, Dulhanty L, Patel HC; UK and Ireland Subarachnoid Hemorrhage Database Collaborators. Predictors of outcome in aneurysmal subarachnoid hemorrhage patients: observations from a multicenter data set. Stroke 2017;48:2958–2963. [DOI] [PubMed] [Google Scholar]
- 24.Kirkpatrick PJ, Turner CL, Smith C, Hutchinson PJ, Murray GD. Simvastatin in Aneurysmal Subarachnoid Haemorrhage (STASH): a multicentre randomised phase 3 trial. Lancet Neurol 2014;13:666–675. [DOI] [PubMed] [Google Scholar]
- 25.Macdonald RL, Jaja B, Cusimano MD, et al. SAHIT Investigators: on the outcome of some subarachnoid hemorrhage clinical trials. Transl Stroke Res 2013;4:286–296. [DOI] [PubMed] [Google Scholar]
- 26.Hutter BO, Gilsbach JM. Which neuropsychological deficits are hidden behind a good outcome (Glasgow = I) after aneurysmal subarachnoid hemorrhage? Neurosurgery 1993;33:999–1005. [DOI] [PubMed] [Google Scholar]
- 27.Pace A, Mitchell S, Casselden E, et al. A subarachnoid haemorrhage-specific outcome tool. Brain 2018;141:1111–1121. [DOI] [PubMed] [Google Scholar]
- 28.Wilson DA, Nakaji P, Albuquerque FC, McDougall CG, Zabramski JM, Spetzler RF. Time course of recovery following poor-grade SAH: the incidence of delayed improvement and implications for SAH outcome study design. J Neurosurg 2013;119:606–612. [DOI] [PubMed] [Google Scholar]
- 29.Schmucker CM, Blümle A, Schell LK, et al. Systematic review finds that study data not published in full text articles have unclear impact on meta-analyses results in medical research. PLoS One 2017;12:e0176210. [DOI] [PMC free article] [PubMed] [Google Scholar]
- 30.Cooper CE, Schaer DJ, Buehler PW, et al. Haptoglobin binding stabilizes hemoglobin ferryl iron and the globin radical on tyrosine beta145. Antioxid Redox Signal 2013;18:2264–2273. [DOI] [PMC free article] [PubMed] [Google Scholar]
- 31.Kristiansen M, Graversen JH, Jacobsen C, Sonne HJ, Law SK, Moestrup SK. Identification of the haemoglobin scavenger receptor. Nature 2001;409:198–201. [DOI] [PubMed] [Google Scholar]
- 32.Philippidis P, Mason JC, Evans BJ, Nadra KM, Haskard DO, Landis RC. Hemoglobin scavenger receptor CD163 mediates interleukin-10 release and heme oxygenase-1 synthesis: antiinflammatory monocyte-macrophage responses in vitro, in resolving skin blisters in vivo, and after cardiopulmonary bypass surgery. Circ Res 2004;94:119–126. [DOI] [PubMed] [Google Scholar]
- 33.Chaichana KL, Levy AP, Miller-Lotan R, Shakur S, Tamargo RJ. Haptoglobin 2-2 genotype determines chronic vasospasm after experimental subarachnoid hemorrhage. Stroke 2007;38:3266–3271. [DOI] [PubMed] [Google Scholar]
- 34.Etzerodt A, Kjolby M, Nielsen MJ, Maniecki M, Svendsen P, Moestrup SK. Plasma clearance of hemoglobin and haptoglobin in mice and effect of CD163 gene targeting disruption. Antioxid Redox Signal 2013;18:2254–2263. [DOI] [PubMed] [Google Scholar]
- 35.Etzerodt A, Rasmussen MR, Svendsen P, et al. Structural basis for inflammation-driven shedding of CD163 ectodomain and tumor necrosis factor-alpha in macrophages. J Biol Chem 2014;289:778–788. [DOI] [PMC free article] [PubMed] [Google Scholar]
- 36.Sadrzadeh SM, Bozorgmehr J. Haptoglobin phenotypes in health and disorders. Am J Clin Pathol 2004;121(suppl):S97–S104. [DOI] [PubMed] [Google Scholar]
- 37.Asleh R, Guetta J, Kalet-Litman S, Miller-Lotan R, Levy AP. Haptoglobin genotype- and diabetes-dependent differences in iron-mediated oxidative stress in vitro and in vivo. Circ Res 2005;96:435–441. [DOI] [PubMed] [Google Scholar]
- 38.Bamm VV, Tsemakhovich VA, Shaklai M, Shaklai N. Haptoglobin phenotypes differ in their ability to inhibit heme transfer from hemoglobin to LDL. Biochemistry 2004;43:3899–906. [DOI] [PubMed] [Google Scholar]
- 39.Melamed-Frank M, Lache O, Enav BI, et al. Structure-function analysis of the antioxidant properties of haptoglobin. Blood 2001;98:3693–3698. [DOI] [PubMed] [Google Scholar]
- 40.Lipiski M, Deuel JW, Baek JH, Engelsberger WR, Buehler PW, Schaer DJ. Human HP1-1 and HP2-2 phenotype-specific haptoglobin therapeutics are both effective in vitro and in guinea pigs to attenuate hemoglobin toxicity. Antioxid Redox Signal 2013;19:1619–1633. [DOI] [PMC free article] [PubMed] [Google Scholar]
- 41.Mollan TL, Jia Y, Banerjee S, et al. Redox properties of human hemoglobin in complex with fractionated dimeric and polymeric human haptoglobin. Free Radic Biol Med 2014;69:265–277. [DOI] [PMC free article] [PubMed] [Google Scholar]
- 42.Pimenova T, Pereira CP, Gehrig P, Buehler PW, Schaer DJ, Zenobi R. Quantitative mass spectrometry defines an oxidative hotspot in hemoglobin that is specifically protected by haptoglobin. J Proteome Res 2010;9:4061–4070. [DOI] [PubMed] [Google Scholar]
- 43.Asleh R, Marsh S, Shilkrut M, et al. Genetically determined heterogeneity in hemoglobin scavenging and susceptibility to diabetic cardiovascular disease. Circ Res 2003;92:1193–1200. [DOI] [PubMed] [Google Scholar]
- 44.Na N, Ouyang J, Taes YE, Delanghe JR. Serum free hemoglobin concentrations in healthy individuals are related to haptoglobin type. Clin Chem 2005;51:1754–1755. [DOI] [PubMed] [Google Scholar]
- 45.Guetta J, Strauss M, Levy NS, Fahoum L, Levy AP. Haptoglobin genotype modulates the balance of Th1/Th2 cytokines produced by macrophages exposed to free hemoglobin. Atherosclerosis 2007;191:48–53. [DOI] [PubMed] [Google Scholar]
- 46.Rouhl RP, van Oostenbrugge RJ, Damoiseaux JG, et al. Haptoglobin phenotype may alter endothelial progenitor cell cluster formation in cerebral small vessel disease. Curr Neurovasc Res 2009;6:32–41. [DOI] [PubMed] [Google Scholar]
- 47.Liu R, Cao S, Hua Y, Keep RF, Huang Y, Xi G. CD163 expression in neurons after experimental intracerebral hemorrhage. Stroke 2017;48:1369–1375. [DOI] [PMC free article] [PubMed] [Google Scholar]
- 48.Chen-Roetling J, Regan RF. Haptoglobin increases the vulnerability of CD163-expressing neurons to hemoglobin. J Neurochem 2016;139:586–595. [DOI] [PMC free article] [PubMed] [Google Scholar]
- 49.Pegoli M, Mandrekar J, Rabinstein AA, Lanzino G. Predictors of excellent functional outcome in aneurysmal subarachnoid hemorrhage. J Neurosurg 2015;122:414–418. [DOI] [PubMed] [Google Scholar]
- 50.Kim BJ, Kim Y, Kim S-E, Jeon JP. Study of correlation between Hp α1 expression of haptoglobin 2-1 and clinical course in aneurysmal subarachnoid hemorrhage. World Neurosurg 2018;117:e221–e227. [DOI] [PubMed] [Google Scholar]
Associated Data
This section collects any data citations, data availability statements, or supplementary materials included in this article.
Data Availability Statement
Anonymized aggregate data will be shared after formal request to the corresponding author in accordance with the University of Southampton's data-sharing policies and contracts with the coauthors and their institutions.


