Abstract
Objective
To identify prediagnostic plasma metabolomic biomarkers associated with amyotrophic lateral sclerosis (ALS).
Methods
We conducted a global metabolomic study using a nested case-control study design within 5 prospective cohorts and identified 275 individuals who developed ALS during follow-up. We profiled plasma metabolites using liquid chromatography–mass spectrometry and identified 404 known metabolites. We used conditional logistic regression to evaluate the associations between metabolites and ALS risk. Further, we used machine learning analyses to determine whether the prediagnostic metabolomic profile could discriminate ALS cases from controls.
Results
A total of 31 out of 404 identified metabolites were associated with ALS risk (p < 0.05). We observed inverse associations (n = 27) with plasma levels of diacylglycerides and triacylglycerides, urate, purine nucleosides, and some organic acids and derivatives, while we found positive associations for a cholesteryl ester, 2 phosphatidylcholines, and a sphingomyelin. The number of significant associations increased to 67 (63 inverse) in analyses restricted to cases with blood samples collected within 5 years of onset. None of these associations remained significant after multiple comparison adjustment. Further, we were not able to reliably distinguish individuals who became cases from controls based on their metabolomic profile using partial least squares discriminant analysis, elastic net regression, random forest, support vector machine, or weighted correlation network analyses.
Conclusions
Although the metabolomic profile in blood samples collected years before ALS diagnosis did not reliably separate presymptomatic ALS cases from controls, our results suggest that ALS is preceded by a broad, but poorly defined, metabolic dysregulation years before the disease onset.
Amyotrophic lateral sclerosis (ALS) is a progressive adult-onset neurodegenerative disease.1 Its etiology is poorly understood, and reliable diagnostic tests and effective treatments are currently unavailable. Plasma metabolomic profiles reflect the interactions among lifestyle, environmental, and genetic factors, and may provide insights into the etiology and pathogenesis of ALS, as well as biomarkers for diagnosing the disease at a preclinical stage when it may be more amenable to treatment.
Several investigations have been conducted on metabolomic differences between patients with ALS and healthy or other diseases controls, but most studies had small sample sizes, and results have been inconsistent.2–11 In the largest investigation, plasma from 172 people recently diagnosed with ALS, 50 healthy controls, and 73 people with other neurologic diseases were compared, and a subset of 32 metabolites identified patients with ALS with high specificity.6 It remains unknown, however, whether the reported alterations preceded the diagnosis of ALS or instead reflected the consequences of muscle atrophy and changes in behavior occurring after diagnosis. To our knowledge, there are currently no studies examining the association of the prediagnostic metabolomic profile with ALS. To address this, we conducted a matched case–control study nested in 5 large prospective US cohorts to determine whether the plasma metabolomic profile in apparently healthy individuals contributes to or can provide an indicator of their future risk of developing ALS.
Methods
Study populations
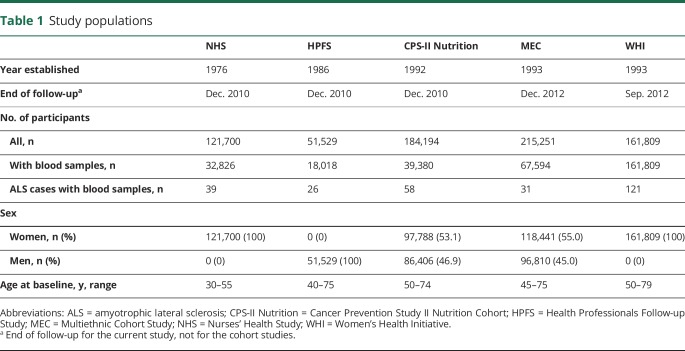
The source population for the present study includes participants from 5 large cohort studies: The Nurses' Health Study (NHS), the Health Professionals Follow-up Study (HPFS), the Cancer Prevention Study II Nutrition Cohort (CPS-II Nutrition), the Multiethnic Cohort Study (MEC), and the Women's Health Initiative (WHI). Detailed descriptions of the individual cohorts have been published previously.12–16 We have provided a summary of the participants in each cohort in table 1.
Table 1.
Study populations
Standard protocol approvals, registrations, and patient consents
All of the studies included were reviewed and approved by the institutional review board representing the institution where each study was conducted.
Endpoint definition
In the NHS and HPFS, patients with ALS were identified by self-report on the biennial questionnaire. For participants who reported a diagnosis of ALS, we requested permission from the participant (or a family member if the participant was deceased at the time of writing) to contact the treating neurologist and to obtain a copy of his or her medical records. We asked the treating neurologist to complete a questionnaire on the certainty of the diagnosis (definite, probable, or possible) and the clinical history. The final confirmation of the diagnosis was made after reviewing medical records by a neurologist with experience in ALS diagnosis. Only patients defined as definite or probable cases were included in the study. If we were unable to obtain a copy of the medical record or the neurologist's questionnaire to confirm the diagnosis of self-reported ALS, only the patients with ALS specifically listed on the death certificate were included.
In the CPS-II Nutrition, MEC, and WHI studies, we identified patients with ALS through a search of the National Death Index. All individuals with code 335.2 (motor neuron disease) according to the ICD-9 listed as the underlying or contributing cause of death were considered to have had ALS. ALS was the primary diagnosis in 90% of the individuals for whom code 335.2 was listed as the cause or contributory cause of death in a validation study.17 The date of onset was assigned to 3 years before the date of death, based on median survival among patients with ALS.18
Overall, we identified 275 incident ALS cases. For each ALS case, we randomly selected 2 controls who were alive at the time of the case diagnosis and matched on cohort, birth year (±1 year), sex, ethnicity, fasting status, and time of blood draw. We excluded one matched control from the final analyses because of failure of the metabolomic profiling.
Assessment of metabolites
Triplets of plasma samples (from 1 case and its 2 matched controls) were handled identically and assayed in the same batch. The order of the samples within each case–control triplet was arranged at random to ensure that all assays were conducted without knowledge of the case–control status.
The metabolites were profiled at the Broad Institute (Cambridge, MA), as previously described.19 In short, 2 distinct hydrophilic interaction liquid chromatography (HILIC) methods were used to profile water-soluble metabolites: positive ionization mode (HILIC-pos) and negative ionization mode (HILIC-neg). For HILIC-pos, the analyses were conducted using a liquid chromatography–mass spectrometry (LC-MS) system composed of a Shimadzu (Kyoto Prefecture, Japan) Nexera X2 U-HPLC coupled to a Q Exactive hybrid quadrupole-orbitrap mass spectrometer (Thermo Fisher Scientific, Waltham, MA) using 10 μL of plasma from each participant. For HILIC-neg, the analyses were conducted using an LC-MS system composed of an AQUITY UPLC system (Waters, Milford, MA) coupled to 5,500 QTRAP mass spectrometry (SCIEX, Framingham, MA) using 30 μL of plasma from each participant. A third method was used to profile lipids: positive ion mode analyses of polar and nonpolar plasma lipids (C8-pos). These analyses were conducted using an LC-MS system composed of a Shimadzu Nexera X2 U-HPLC coupled to an Exactive Plus orbitrap mass spectrometer (Thermo Fisher Scientific) using 10 μL of plasma from each participant. Raw data from Q Exactive/Exactive Plus instruments were processed using TraceFinder software (Thermo Fisher Scientific) and Progenesis QI (Nonlinear Dynamics, Newcastle upon Tyne, UK), while MultiQuant (SCIEX) was used to process 5,500 QTRAP data. Metabolite identities were confirmed using authentic reference standards. Metabolite signals were analyzed in relation to ALS risk as LC-MS peak areas, which are proportional to metabolite concentrations.
In a pilot study on use of LC-MS in NHS and HPFS, 92% of the metabolites had an acceptable interassay reproducibility (coefficient of variation <20%), while 75% of the metabolites had good to high reproducibility after a processing delay of 24 hours (Spearman correlation or intraclass correlation coefficient [ICC] ≥0.75).20 Further, 90% of the metabolites had Spearman correlations or ICCs ≥0.40 when comparing 2 samples collected in the same individuals 0.8–2.3 years apart, indicating that for the majority of the metabolites, a single measurement may reasonably reflect longer-term levels. Finally, for most of the metabolites, only small differences in measured peak areas between samples from individuals fasting ≥8 hours, 6–7 hours, and 4–5 hours were observed.
Assessment of covariates
Information on covariates of interest, including height, weight, and diabetes status, was collected at baseline for all cohorts, and every 2 years since baseline in HPFS and NHS. Participants self-reported diagnosis of type 1 or type 2 diabetes mellitus. We used the nearest covariate data collected before or at the time of blood draw.
Statistical analyses
We identified 457 known metabolites in the samples. After excluding metabolites that had an overall missing rate of more than 20% in all participants or more than 50% in participants in any individual cohort, a total of 404 metabolites were included in the final analyses. Forty-four of these had missing values, which were imputed with half of the minimum observed value for each metabolite. Metabolite levels were log-transformed and standardized (mean 0, SD 1) based on the distribution among the controls of the same cohort and sex to account for possible differences that may have been introduced as samples across cohorts were processed at different times and locations.
We used conditional logistic regression to estimate odds ratios (ORs) and 95% confidence intervals (CIs) for the association between individual metabolites and ALS. As controls in our study were selected using risk-set sampling, the ORs estimate incidence rate ratios.21 The metabolites were modeled as continuous variables (per 1 SD increase). In addition to matching factors, the models were adjusted for body mass index (BMI; continuous), as higher BMI has been associated with lower ALS risk.22 To determine whether the profiled metabolites could discriminate cases from controls, we conducted partial least square discrimination analysis (PLS-DA). We used separation distance as the test statistics and plotted the scores of the first 5 partial least square components to inspect the separation of cases from controls visually. We followed this with 1,000 permutation tests to assess the significance of discrimination of cases from controls. In each permutation test, we built a PLS-DA model between the metabolomics measurements and case–control status labels and computed a separation distance. We then computed a permutation p value as the proportion of permutation tests that generated separation distances greater than or equal to the observed separation distance. To verify the PLS-DA results, we conducted random forest and support vector machine analyses.
To evaluate whether a subset of metabolites could discriminate those who later developed ALS from the controls, we conducted penalized conditional logistic regression analyses. In these analyses, we included all metabolites that were nominally significantly associated with ALS (p < 0.05) in the same model, penalized by LASSO or elastic net penalty terms. We then computed the area under the curve (AUC) in receiver operating characteristic (ROC) analyses using unconditional logistic regression analyses including the metabolites that were simultaneously retained in LASSO or elastic net analyses. This was done using 10-fold cross-validation. We further used weighted correlation network analysis (WCNA) to conduct network analysis and to identify groups of highly correlated metabolites (modules) that were associated with ALS. In the context of metabolomics, WCNA uses metabolites' pairwise correlations to construct networks and find clusters of metabolites (modules) that are highly correlated. Subsequently, WCNA runs principal component analysis within each module, and the corresponding first principal component is regarded as the Eigen-metabolite. WCNA assigns all metabolites that do not display a high correlation with other metabolites to a separate module. This module was excluded from further analysis. We included Eigen-metabolites in separate conditional logistic regression analyses to assess whether any of the modules was associated with ALS risk.
All analyses were first conducted including all participants and then repeated in groups categorized by time from blood collection to disease onset (<5 years and ≥5 years). In addition, we conducted sensitivity analyses to assess the robustness of our findings. First, to evaluate the effect of outliers on our results, we used a rank-based inverse normal transformation instead of the log-transformation used in the main analyses. Second, to assess whether diabetes, which has been associated with alteration in the metabolome,23 influenced the results, we excluded all individuals with diabetes at the time of blood collection. Further, we conducted partial correlation-based network and corresponding network-guided regression analyses restricted to lipids only.
We corrected for multiple comparisons using the Benjamini-Yekutieli false discovery rate approach. Q values less than 0.2 were considered statistically significant after multiple comparison correction. All analyses were conducted using SAS 9.4 software (SAS Institute, Cary, NC) and R 3.4.3 (cran.r-project.org). p Values were considered significant at values <0.05.
Data availability
The datasets analyzed in the current study are not publicly available because of restricted access, but further information about the datasets is available from the corresponding author on reasonable request.
Results
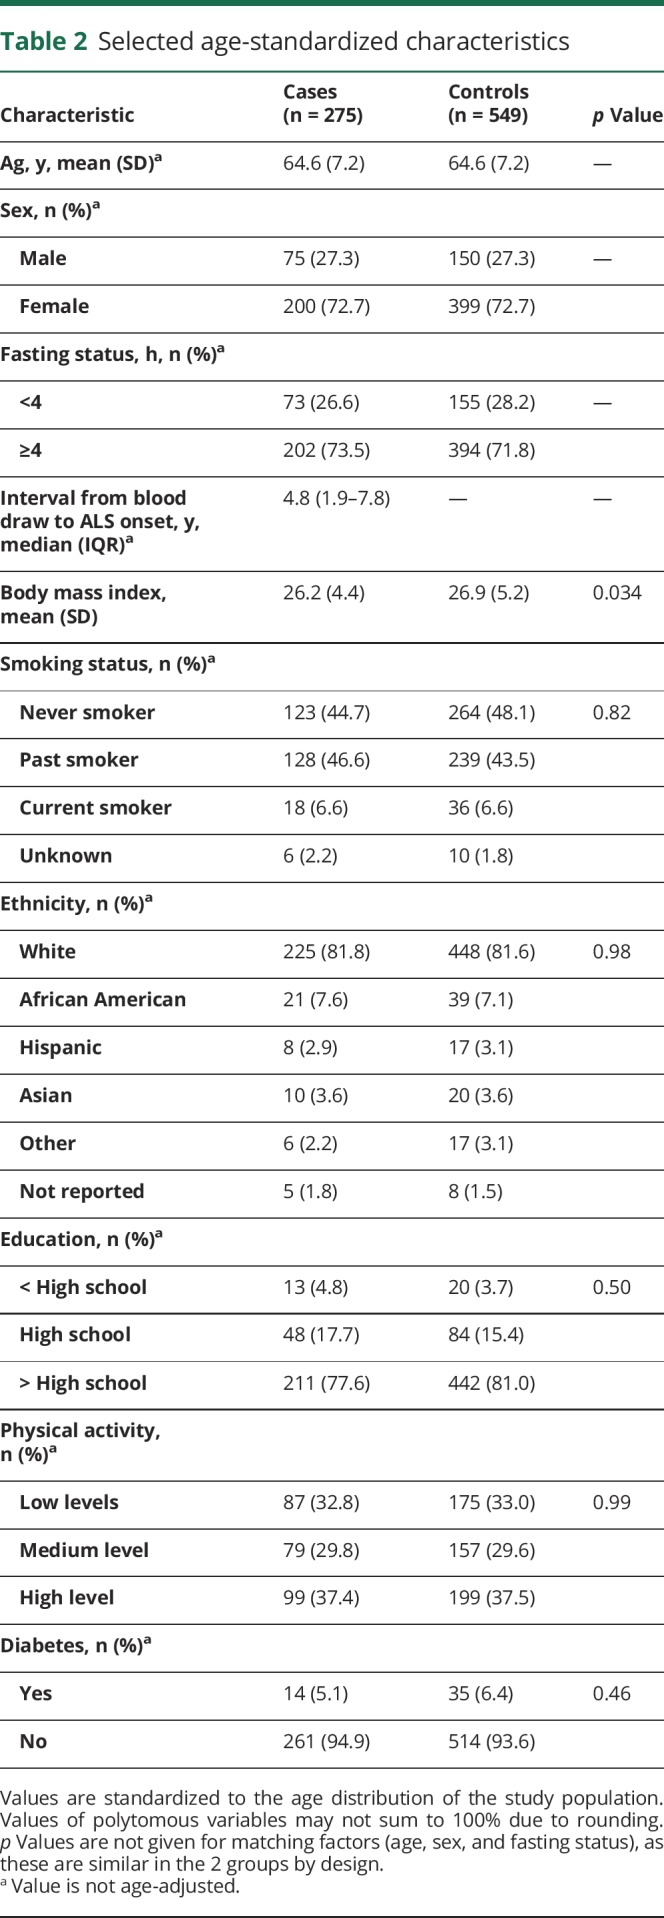
The baseline characteristics of the participants are shown in table 2. Our study included a higher number of women than men. Further, BMI was significantly higher in controls compared to those who became cases, as previously reported.24 The other baseline characteristics were similarly distributed. The final number of metabolites included in the analyses represent all metabolites that were identified using LC-MS (n = 457) that also passed our quality control (n = 404; see Methods for details).
Table 2.
Selected age-standardized characteristics
Analyses of individual metabolites
Analyses including all cases and controls
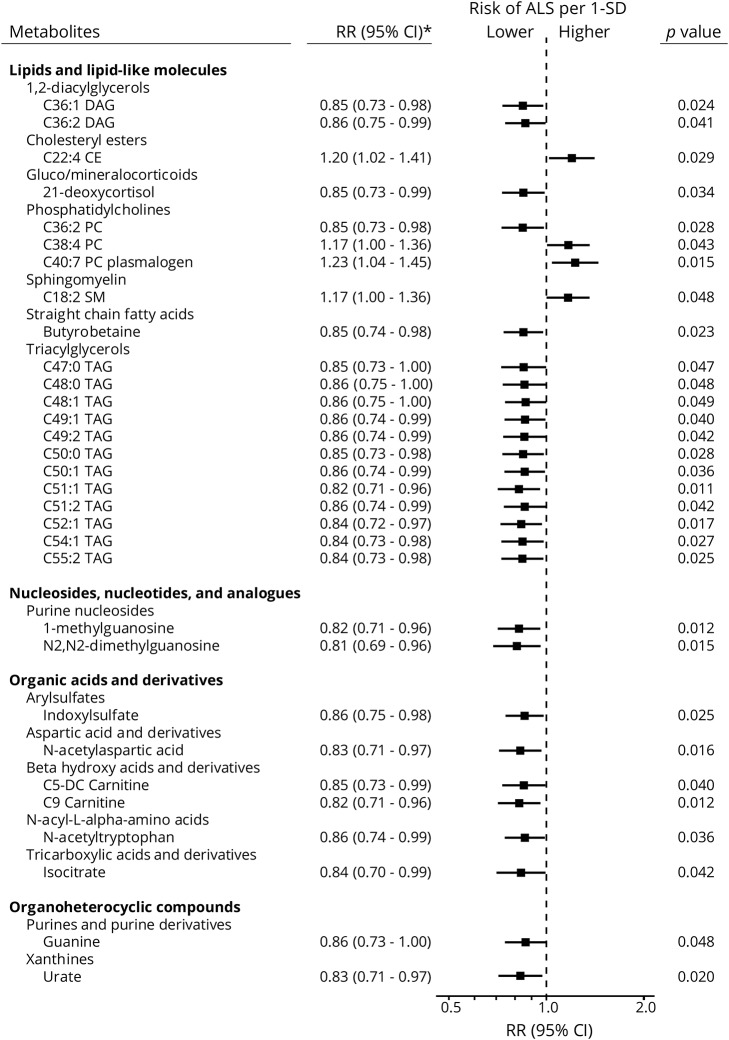
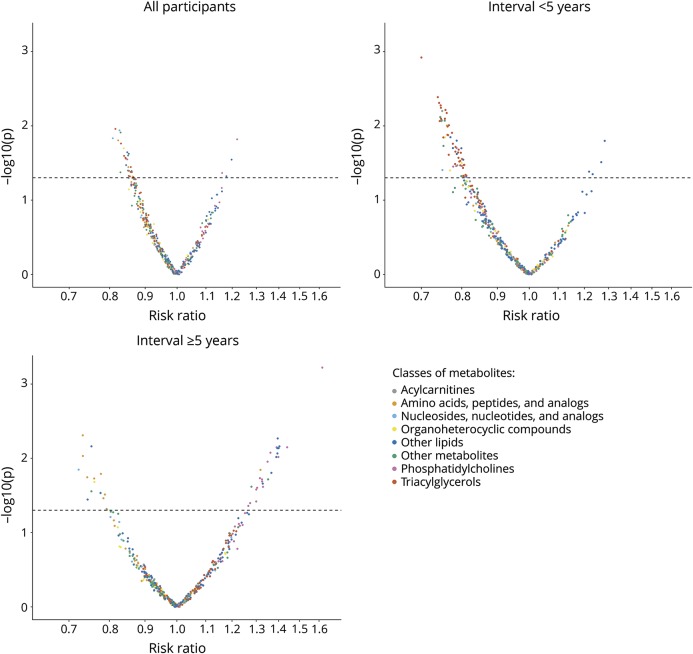
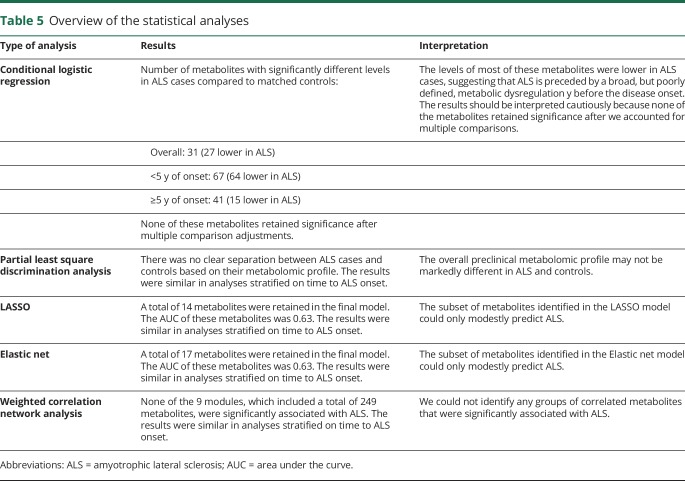
Overall, we identified 31 metabolites that were significantly different between ALS cases and their matched controls (p < 0.05); 27 of these metabolites had lower concentrations among the ALS cases and were thus associated with lower ALS risk. The metabolites with inverse associations included diacylglycerols and triacylglycerols, urate, purine nucleosides, and some organic acids and derivatives (figures 1 and 2). We observed positive associations for a cholesteryl ester and 2 phosphatidylcholines. However, none of the metabolites identified in these analyses remained significantly associated with ALS after accounting for multiple comparisons.
Figure 1. The risk ratio (RR) of amyotrophic lateral sclerosis (ALS) according to levels of individual metabolites.
Adjusted for body mass index and matching factors (cohort, birth year, sex, ethnicity, fasting status, and time of blood draw). CI = confidence interval.
Figure 2. Metabolomics volcano plots.
The figure illustrates risk ratios and p values from conditional logistic regression analyses. The p values are plotted on the log-scale. In each panel, the dashed line indicates a p value of 0.05.
Analyses stratified by time from blood draw to ALS onset
A total of 144 patients with ALS had blood collected within 5 years of disease onset, while the remaining 131 cases had blood collected 5 years or more before onset. The number of metabolites with significantly different concentrations between cases and controls was higher in analyses among case–control pairs in which blood was drawn closer to ALS onset than in those with blood collected several years before onset. Specifically, in plasma samples collected less than 5 years before ALS onset, 63 metabolites were significantly associated with lower ALS risk, and 4 with higher ALS risk. The 63 metabolites with inverse associations included mainly lipids (diacylglycerols and triacylglycerols, acylcarnitines, phosphatidylcholines, and other lipids; figure 2B, table e-1, links.lww.com/WNL/A866), whereas positive associations were found for a cholesteryl ester, a phosphosphingolipid, and 2 lysophospholipids. A total of 18 of these metabolites were also nominally significantly associated with ALS in the overall analyses. Among those case–control pairs with blood drawn at least 5 years before ALS onset, we identified 41 metabolites that were significantly associated with ALS risk (figure 2C, table e-1). A total of 5 of these metabolites were also nominally significantly associated with ALS in the overall analyses. None of the metabolites in the stratified analyses remained significantly associated with ALS after accounting for multiple comparisons.
Simultaneous analyses including all known metabolites
When plotting the first 2 PLS components from the PLS-DA, there was no clear separation between cases and controls (figure 3A), suggesting that the overall preclinical metabolomic profile is not markedly different in ALS and controls. The permutation tests based on separation distance yielded a p value of 0.1. There was no clear separation in analyses restricted to those with the shortest interval between blood draw and ALS onset (figure 3B), while there was only a moderate separation between future ALS cases and controls in analyses restricted to those with the longest interval (figure 3C). The p values from the permutation tests did not reach statistical significance in either of the subgroups (p = 0.766 and p = 0.075 for <5 years and ≥5 years, respectively). In random forest and support vector machine analyses, error rates were as high as ∼33%, indicating that the metabolites could not distinguish individuals later developing ALS from their matched controls in our study population.
Figure 3. Partial least square (PLS) discrimination analysis plots.
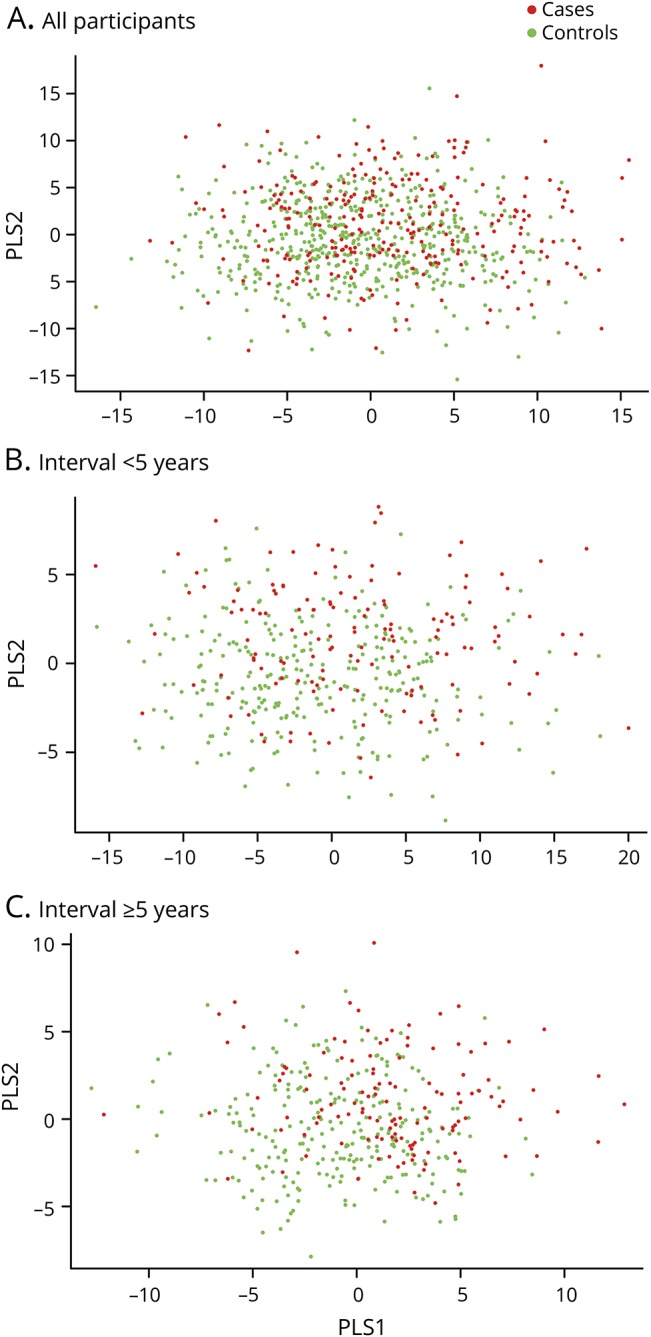
(A) Including all participants. p Value from the permutation test: 0.1. (B) Restricted to participants with blood samples collected within 5 years of onset. p Value from the permutation test: 0.766. (C) Restricted to participants with blood samples collected 5 years or longer before disease onset. p Value from the permutation test: 0.075.
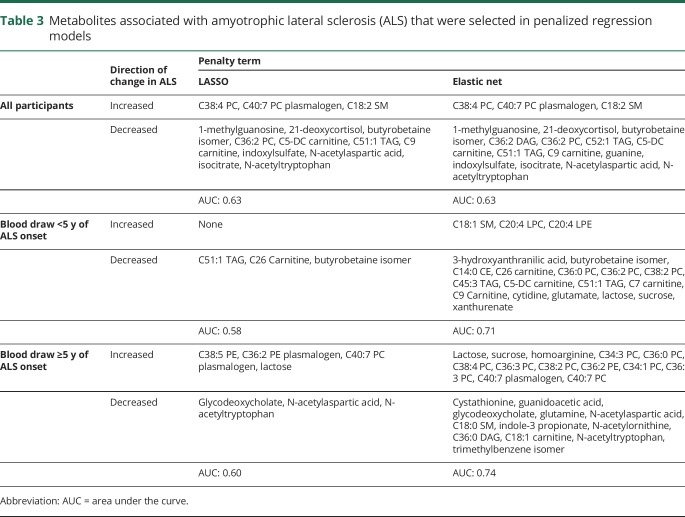
Using penalized conditional regression analyses with LASSO, we identified 14 metabolites that were retained in the model (table 3). Of these, 3 were associated with a higher risk of ALS, while the remaining 11 were associated with a lower ALS risk. In the ROC analysis, the AUC of these metabolites was 0.63. We observed similar results using elastic net penalty at an alpha level of 0.5, with 17 metabolites selected to be retained in the model. Of these, 3 were associated with a higher ALS risk, while 14 metabolites were associated with a lower ALS risk. The AUC for these metabolites was 0.63. We repeated the analyses in groups categorized by the interval between blood draw and ALS onset and observed similar results (table 3).
Table 3.
Metabolites associated with amyotrophic lateral sclerosis (ALS) that were selected in penalized regression models
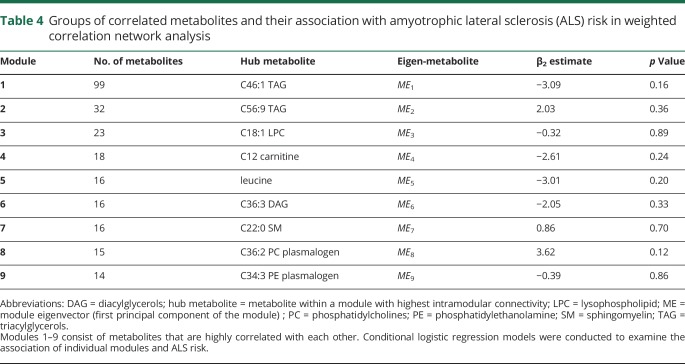
In the WCNA analysis, 249 (61.6%) of the metabolites were assigned into 9 modules (tables 4 and 5), while the remaining could not be assigned to any module due to weak correlation with other metabolites. The largest module (1) included 99 metabolites and consisted primarily of lipids. When the Eigen-metabolite within each module was included as a covariate in the conditional logistic regression model, none of them was significantly associated with ALS. The results were similar in analyses restricted to groups categorized by the interval between blood draw and ALS onset (data not shown).
Table 4.
Groups of correlated metabolites and their association with amyotrophic lateral sclerosis (ALS) risk in weighted correlation network analysis
Table 5.
Overview of the statistical analyses
In sensitivity analyses using a rank-based inverse normal transformation instead of log-transformation, we observed similar results, indicating that extreme outliers in individual metabolites were either absent or noninfluential (data not shown). Similarly, the results did not materially change when we excluded individuals diagnosed with diabetes (data not shown). When we restricted the analyses to lipids alone, none of the metabolite modules was significantly associated with ALS in partial correlation-based network approach followed by network-guided regression analyses (data not shown). Further, we restricted the analyses to individuals with blood samples provided within 2 years (72 ALS cases) and within 1 year (51 ALS cases) from ALS onset but observed similar results (data not shown). Finally, the results remained similar when we assigned the date of onset to 5 instead of 3 years before the date of death for the participants identified by death certificate (data not shown).
Discussion
In this study, we conducted a broad search for prediagnostic plasma biomarkers for ALS using a high-throughput, agnostic metabolomics approach. We identified 31 metabolites that were associated with ALS risk in the overall analyses, and 67 metabolites that were associated with ALS risk among those with blood draws taken 5 years or less from ALS onset. Most of these metabolites had lower concentrations in ALS cases than in their matched controls, a finding that suggests a broad, but still poorly defined metabolic dysregulation. These results should be interpreted cautiously because none of the metabolites retained significance after we accounted for multiple comparisons, and we could not discriminate individuals later developing ALS from their matched controls using PLS-DA and penalized regression methods.
The results from our study are not consistent with most of the findings in previous ALS metabolomics studies. Among the metabolites suggested to be important in the largest previous study comparing the metabolome in patients with ALS with controls,6 only urate was significantly associated with ALS risk in our study. The association was similar in analyses stratified on time to ALS onset, which suggests that low urate precedes and possibly contributes to the development of the disease. This result is in line with prior studies demonstrating that higher levels of urate are associated with a lower risk25 and slower progression in ALS.26,27 None of the metabolites in the 16 pathways most commonly reported to be altered in previous studies, which included the metabolism of several amino acids, caffeine metabolism, aminoacyl RNA biosynthesis, and pantothenate and CoA biosynthesis,2 were associated with ALS risk after we accounted for multiple comparisons. The inconsistent results are likely because of the different study designs, where our study evaluated the association between the prediagnostic metabolomic profile and ALS risk, while all of the previous studies compared the metabolome in patients with ALS with controls. As ALS is a fast-progressing disease with marked dysregulation in energy metabolism,28 metabolomic alterations observed after the disease onset could reflect consequences of the disease. This makes it difficult to compare our findings with those of previous studies. Further, while our study is the most comprehensive metabolomic study to date, including 404 metabolites, we did not have data on all of the metabolites suggested to be important in previous studies, and it is possible that metabolites that we did not measure could be important for ALS.
While we did not observe any marked associations between individual metabolites and ALS risk, most of the metabolite levels were lower in those who later developed ALS compared to the controls. This could reflect a broad, but poorly defined, dysregulation in metabolism, which may precede the first symptoms of the disease by several years. We observed that the levels of many lipids were lower in incident ALS cases, which could suggest that alterations in lipid metabolism are associated with the earliest events in the disease. In animal models, there is a switch towards a preference for lipids as a fuel source that happens during the asymptomatic stage,29 while higher levels of ketone bodies, which are released by the breakdown of fatty acids, have been observed in patients with ALS. 4,11 Use of lipids as the fuel source is associated with increased oxidative stress30 that can lead to neuroinflammation, mitochondrial dysfunction, and excitotoxicity,31 which are mechanisms likely to contribute to the selective motor neuron death in ALS.1
In our study, we could not discriminate between those who later developed ALS from their matched controls, which could suggest that marked metabolomic alterations do not precede ALS in the years before clinical disease onset. Approximately half of those who developed ALS in our study had disease onset within 5 years of blood draw, but we did not observe any significant metabolomic alterations among these individuals. This could indicate that ALS is not preceded by a long prodromal phase, in contrast to other neurodegenerative diseases like Parkinson disease.32 However, our results could also suggest that the preclinical phase of ALS is associated with a number of less marked metabolomic alterations. In this scenario, our study may have lacked statistical power to detect such differences. Further, it is also possible that the preclinical phase of ALS is not associated with metabolomic alterations in the plasma. Finally, the lack of a specific preclinical metabolomic signature of ALS in our study may reflect the heterogeneous nature of ALS1 or the analyses of blood samples collected at different stages of a multistep process in the development of the disease.33,34 In future studies, it may be useful to include cases of familial ALS and to integrate genetic with metabolomic data in order to detect alterations that can be specific to ALS subtypes. Repeated metabolomic measurements in studies following healthy carriers of known mutations over time could be especially informative for this purpose.
Our study has several strengths. We included participants nested from 5 large cohort studies, which not only minimizes the risk of selection bias when selecting the controls, but also guarantees that there are no systematic differences between cases and their matched controls in the procedures of blood collection and processing, or in the circumstances of blood collection, such as season, time of day, time since last meal, or place of blood collection. Furthermore, samples from cases and matched controls were analyzed at the same time, blindly, and in random order, thus virtually eliminating any artefactual difference in metabolite concentrations. We included a large number of metabolites that have not been previously investigated; we used prospectively collected information on several possible confounders that may be relevant in ALS, including BMI and diabetes; and we used blood samples collected before disease onset, which minimizes the risk of reverse causation. Finally, we conducted thorough sensitivity analyses to assess the robustness of our findings.
Our study also has limitations, some of which are inherent to the difficulty of conducting a prospective study of a relatively rare disease such as ALS. The moderate sample size may have limited the statistical power for an agnostic study with over 400 metabolites. Further, we did not have clinical or genetic information on the ALS cases to distinguish ALS subtypes. We evaluated the association between metabolites and ALS using plasma measurements assessed at one time point, which may not reflect long-term concentrations of the metabolites. Still, in a validation study in NHS and HPFS, the majority of the metabolites were reproducible within individuals when comparing samples collected 1–2 years apart,20 suggesting that a single measurement may reasonably reflect longer-term levels. Furthermore, apart from penalized regression methods (elastic net and LASSO), machine learning methods such as PLS-DA and WCNA do not account for the matched case–control study design, which may affect the statistical power for these tests. For future studies, statistical methods particularly designed for high dimensional data from matched case–control studies can be applied to more appropriately evaluate the association between the plasma metabolome and ALS risk. Finally, as is inherent to any observational study, we cannot exclude the possibility that the results may be affected by residual or unmeasured confounding that we cannot account for.
In this study, we found that plasma levels of several metabolites appear to be altered, in most cases reduced, before the onset of ALS symptoms. These associations, however, were no longer statistically significant after multiple comparison corrections. We were not able to identify a metabolomics signature that could reliably discriminate those who later developed ALS from their matched controls. The findings on individual metabolites should, therefore, be interpreted cautiously and in the context of their potential biological significance.
Acknowledgment
The authors thank the participants and staff of the NHS, HPFS, MEC, CPS-II, and WHI for their contributions. Short list of WHI Investigators: Program Office (National Heart, Lung, and Blood Institute, Bethesda, Maryland): Jacques Rossouw, Shari Ludlam, Joan McGowan, Leslie Ford, and Nancy Geller. Clinical Coordinating Center (Fred Hutchinson Cancer Research Center, Seattle, WA): Garnet Anderson, Ross Prentice, Andrea LaCroix, and Charles Kooperberg. Investigators and Academic Centers: Brigham and Women's Hospital, Harvard Medical School, Boston: JoAnn E. Manson; MedStar Health Research Institute/Howard University, Washington, DC: Barbara V. Howard; Stanford Prevention Research Center, California: Marcia L. Stefanick; The Ohio State University, Columbus: Rebecca Jackson; University of Arizona, Tucson/Phoenix: Cynthia A. Thomson; University at Buffalo, New York: Jean Wactawski-Wende; University of Florida, Gainesville/Jacksonville: Marian Limacher; University of Iowa, Iowa City/Davenport: Jennifer Robinson; University of Pittsburgh: Lewis Kuller; Wake Forest University School of Medicine, Winston-Salem, North Carolina: Sally Shumaker; University of Nevada, Reno: Robert Brunner. Women's Health Initiative Memory Study (Wake Forest University School of Medicine): Mark Espeland.
Glossary
- ALS
amyotrophic lateral sclerosis
- AUC
area under the curve
- BMI
body mass index
- CI
confidence interval
- CPS-II
Cancer Prevention Study II
- HILIC
hydrophilic interaction liquid chromatography
- HILIC-neg
hydrophilic interaction liquid chromatography–negative ionization mode
- HILIC-pos
hydrophilic interaction liquid chromatography–positive ionization mode
- HPFS
Health Professionals Follow-up Study
- ICC
intraclass correlation coefficient
- ICD-9
International Classification of Diseases, ninth revision
- LC-MS
liquid chromatography–mass spectrometry
- MEC
Multiethnic Cohort Study
- NHS
Nurses' Health Study
- OR
odds ratio
- PLS-DA
partial least square discrimination analysis
- ROC
receiver operating characteristic
- WCNA
weighted correlation network analysis
- WHI
Women's Health Initiative
Appendix. Authors



Study funding
Study funded by a grant from the National Institute of Neurologic Diseases and Stroke (R01 NS045893) awarded to Alberto Ascherio. The NHS is funded by the NIH through grants UM1 CA186107 and R01 CA49449. The HPFS cohort is funded by the NIH through grant UM1 CA167552. The American Cancer Society funds the creation, maintenance, and updating of the CPS-II cohorts. The MEC cohort is funded by the NIH through U01 CA164973. The WHI program is funded by the National Heart, Lung, and Blood Institute, NIH, US Department of Health and Human Services, through contracts HHSN268201600018C, HHSN268201600001C, HHSN268201600002C, HHSN268201600003C, and HHSN268201600004C.
Disclosure
K. Bjornevik, Z. Zhang, E. O'Reilly, J. Berry, C. Clish, A. Deik, S. Jeanfavre, I. Kato, R. Kelly, L. Kolonel, L. Liang, L. Le Marchand, M. McCullough, S. Paganoni, and K. Pierce report no disclosures relevant to the manuscript. M. Schwarzschild reports funding from Target ALS. A. Shadyab, J. Wactawski-Wende, D. Wang, Y. Wang, J. Manson, and A. Ascherio report no disclosures relevant to the manuscript. Go to Neurology.org/N for full disclosures.
References
- 1.van Es MA, Hardiman O, Chio A, et al. Amyotrophic lateral sclerosis. Lancet 2017;390:2084–2098. [DOI] [PubMed] [Google Scholar]
- 2.Blasco H, Patin F, Madji Hounoum B, et al. Metabolomics in amyotrophic lateral sclerosis: how far can it take us? Eur J Neurol 2016;23:447–454. [DOI] [PubMed] [Google Scholar]
- 3.Rozen S, Cudkowicz ME, Bogdanov M, et al. Metabolomic analysis and signatures in motor neuron disease. Metabolomics 2005;1:101–108. [DOI] [PMC free article] [PubMed] [Google Scholar]
- 4.Kumar A, Bala L, Kalita J, et al. Metabolomic analysis of serum by (1) H NMR spectroscopy in amyotrophic lateral sclerosis. Clin Chim Acta 2010;411:563–567. [DOI] [PubMed] [Google Scholar]
- 5.Gray E, Larkin JR, Claridge TD, Talbot K, Sibson NR, Turner MR. The longitudinal cerebrospinal fluid metabolomic profile of amyotrophic lateral sclerosis. Amyotroph Lateral Scler Frontotemporal Degener 2015;16:456–463. [DOI] [PMC free article] [PubMed] [Google Scholar]
- 6.Lawton KA, Brown MV, Alexander D, et al. Plasma metabolomic biomarker panel to distinguish patients with amyotrophic lateral sclerosis from disease mimics. Amyotroph Lateral Scler Frontotemporal Degener 2014;15:362–370. [DOI] [PubMed] [Google Scholar]
- 7.Blasco H, Nadal-Desbarats L, Pradat PF, et al. Untargeted 1H-NMR metabolomics in CSF: toward a diagnostic biomarker for motor neuron disease. Neurology 2014;82:1167–1174. [DOI] [PubMed] [Google Scholar]
- 8.Blasco H, Corcia P, Pradat PF, et al. Metabolomics in cerebrospinal fluid of patients with amyotrophic lateral sclerosis: an untargeted approach via high-resolution mass spectrometry. J Proteome Res 2013;12:3746–3754. [DOI] [PubMed] [Google Scholar]
- 9.Lawton KA, Cudkowicz ME, Brown MV, et al. Biochemical alterations associated with ALS. Amyotroph Lateral Scler 2012;13:110–118. [DOI] [PubMed] [Google Scholar]
- 10.Wuolikainen A, Moritz T, Marklund SL, Antti H, Andersen PM. Disease-related changes in the cerebrospinal fluid metabolome in amyotrophic lateral sclerosis detected by GC/TOFMS. PLoS One 2011;6:e17947. [DOI] [PMC free article] [PubMed] [Google Scholar]
- 11.Blasco H, Corcia P, Moreau C, et al. 1H-NMR-based metabolomic profiling of CSF in early amyotrophic lateral sclerosis. PLoS One 2010;5:e13223. [DOI] [PMC free article] [PubMed] [Google Scholar]
- 12.Bao Y, Bertoia ML, Lenart EB, et al. Origin, methods, and evolution of the three Nurses' Health Studies. Am J Public Health 2016;106:1573–1581. [DOI] [PMC free article] [PubMed] [Google Scholar]
- 13.Rimm EB, Giovannucci EL, Willett WC, et al. Prospective study of alcohol consumption and risk of coronary disease in men. Lancet 1991;338:464–468. [DOI] [PubMed] [Google Scholar]
- 14.Calle EE, Rodriguez C, Jacobs EJ, et al. The American Cancer Society Cancer Prevention Study II Nutrition Cohort: rationale, study design, and baseline characteristics. Cancer 2002;94:2490–2501. [DOI] [PubMed] [Google Scholar]
- 15.Kolonel LN, Henderson BE, Hankin JH, et al. A multiethnic cohort in Hawaii and Los Angeles: baseline characteristics. Am J Epidemiol 2000;151:346–357. [DOI] [PMC free article] [PubMed] [Google Scholar]
- 16.Anderson GL, Manson J, Wallace R, et al. Implementation of the Women's Health Initiative study design. Ann Epidemiol 2003;13:S5–S17. [DOI] [PubMed] [Google Scholar]
- 17.Weisskopf MG, McCullough ML, Calle EE, Thun MJ, Cudkowicz M, Ascherio A. Prospective study of cigarette smoking and amyotrophic lateral sclerosis. Am J Epidemiol 2004;160:26–33. [DOI] [PubMed] [Google Scholar]
- 18.Traxinger K, Kelly C, Johnson BA, Lyles RH, Glass JD. Prognosis and epidemiology of amyotrophic lateral sclerosis: analysis of a clinic population, 1997-2011. Neurol Clin Pract 2013;3:313–320. [DOI] [PMC free article] [PubMed] [Google Scholar]
- 19.Paynter NP, Balasubramanian R, Giulianini F, et al. Metabolic predictors of incident coronary heart disease in women. Circulation 2018;137:841–853. [DOI] [PMC free article] [PubMed] [Google Scholar]
- 20.Townsend MK, Clish CB, Kraft P, et al. Reproducibility of metabolomic profiles among men and women in 2 large cohort studies. Clin Chem 2013;59:1657–1667. [DOI] [PMC free article] [PubMed] [Google Scholar]
- 21.Knol MJ, Vandenbroucke JP, Scott P, Egger M. What do case-control studies estimate? Survey of methods and assumptions in published case-control research. Am J Epidemiol 2008;168:1073–1081. [DOI] [PubMed] [Google Scholar]
- 22.O'Reilly ÉJ, Wang H, Weisskopf MG, et al. Premorbid body mass index and risk of amyotrophic lateral sclerosis. Amyotroph Lateral Scler Frontotemporal Degener 2013;14:205–211. [DOI] [PMC free article] [PubMed] [Google Scholar]
- 23.Guasch-Ferre M, Hruby A, Toledo E, et al. Metabolomics in prediabetes and diabetes: a systematic review and meta-analysis. Diabetes Care 2016;39:833–846. [DOI] [PMC free article] [PubMed] [Google Scholar]
- 24.O'Reilly EJ, Wang M, Adami HO, et al. Prediagnostic body size and risk of amyotrophic lateral sclerosis death in 10 studies. Amyotroph Lateral Scler Frontotemporal Degener 2018;19:396–406. [DOI] [PMC free article] [PubMed] [Google Scholar]
- 25.O'Reilly ÉJ, Bjornevik K, Schwarzschild MA, et al. Pre-diagnostic plasma urate and the risk of amyotrophic lateral sclerosis. Amyotroph Lateral Scler Frontotemporal Degener 2018;19:194–200. [DOI] [PMC free article] [PubMed] [Google Scholar]
- 26.O'Reilly ÉJ, Liu D, Johns DR, et al. Serum urate at trial entry and ALS progression in EMPOWER. Amyotroph Lateral Scler Frontotemporal Degener 2017;18:120–125. [DOI] [PMC free article] [PubMed] [Google Scholar]
- 27.Paganoni S, Nicholson K, Chan J, et al. Urate levels predict survival in amyotrophic lateral sclerosis: analysis of the expanded pooled resource open-access ALS clinical trials database. Muscle Nerve 2018;57:430–434. [DOI] [PMC free article] [PubMed] [Google Scholar]
- 28.Dupuis L, Pradat PF, Ludolph AC, Loeffler JP. Energy metabolism in amyotrophic lateral sclerosis. Lancet Neurol 2011;10:75–82. [DOI] [PubMed] [Google Scholar]
- 29.Palamiuc L, Schlagowski A, Ngo ST, et al. A metabolic switch toward lipid use in glycolytic muscle is an early pathologic event in a mouse model of amyotrophic lateral sclerosis. EMBO Mol Med 2015;7:526–546. [DOI] [PMC free article] [PubMed] [Google Scholar]
- 30.Schonfeld P, Reiser G. Why does brain metabolism not favor burning of fatty acids to provide energy? Reflections on disadvantages of the use of free fatty acids as fuel for brain. J Cereb Blood Flow Metab 2013;33:1493–1499. [DOI] [PMC free article] [PubMed] [Google Scholar]
- 31.Tracey TJ, Steyn FJ, Wolvetang EJ, Ngo ST. Neuronal lipid metabolism: multiple pathways driving functional outcomes in Health and disease. Front Mol Neurosci 2018;11:10. [DOI] [PMC free article] [PubMed] [Google Scholar]
- 32.Kalia LV, Lang AE. Parkinson's disease. Lancet 2015;386:896–912. [DOI] [PubMed] [Google Scholar]
- 33.Al-Chalabi A, Calvo A, Chio A, et al. Analysis of amyotrophic lateral sclerosis as a multistep process: a population-based modelling study. Lancet Neurol 2014;13:1108–1113. [DOI] [PMC free article] [PubMed] [Google Scholar]
- 34.Chiò A, Mazzini L, D'Alfonso S, et al. The multistep hypothesis of ALS revisited: the role of genetic mutations. Neurology 2018;91:e635–e642. [DOI] [PMC free article] [PubMed] [Google Scholar]
Associated Data
This section collects any data citations, data availability statements, or supplementary materials included in this article.
Data Availability Statement
The datasets analyzed in the current study are not publicly available because of restricted access, but further information about the datasets is available from the corresponding author on reasonable request.


