

ABSTRACT
Combination therapy is a fast-growing strategy to maximize therapeutic benefits to patients. Co-formulation of two or more therapeutic proteins has advantages over the administration of multiple medications, including reduced medication errors and convenience for patients. Characterization of co-formulated biologics can be challenging due to the high degree of similarity in the physicochemical properties of co-formulated proteins, especially at different concentrations of individual components. We present the results of a deamidation study of one monoclonal antibody component (mAb-B) in co-formulated combination antibodies (referred to as COMBO) that contain various ratios of mAb-A and mAb-B. A single deamidation site in the complementarity-determining region of mAb-B was identified as a critical quality attribute (CQA) due to its impact on biological activity. A conventional charge-based method of monitoring mAb-B deamidation presented specificity and robustness challenges, especially when mAb-B was a minor component in the COMBO, making it unsuitable for lot release and stability testing. We developed and qualified a new, quality-control-friendly, single quadrupole Dalton mass detector (QDa)–based method to monitor site-specific deamidation. Our approach can be also used as a multi-attribute method for monitoring other quality attributes in COMBO. This analytical paradigm is applicable to the identification of CQAs in combination therapeutic molecules, and to the subsequent development of a highly specific, highly sensitive, and sufficiently robust method for routine monitoring CQAs for lot release test and during stability studies.
KEYWORDS: Immunotherapy, monoclonal antibody, combination therapy, co-formulated combination antibodies charge variant, critical quality attribute, complementarity-determining regions, deamidation, focused peptide mapping, multi-attribute method
Introduction
Combination therapy is a fast-growing strategy used for numerous drugs, including cancer immunotherapy,1-5 viral disease treatments,6 and anti-toxins.7 For cancer immunotherapy, the combination-based approach allows exploration of the synergistic effects of two immune checkpoint inhibitors or supplementation of one immune checkpoint inhibitor with a different treatment paradigm. Indeed, the initial clinical success of combination immunotherapies8 has spurred an exponential increase of clinical trials using this approach.5 Currently, two combinational immunotherapies have been approved by the US Food and Drug Administration for advanced melanoma and newly diagnosed metastatic non–small-cell lung cancer.5
The subject of this study is the combination of two human monoclonal antibodies (mAbs) (referred to herein as COMBO), designated mAb-A and mAb-B, which, when co-formulated into a single drug product, may have synergistic effects and additional advantages, such as ease of use and patient safety. Compared to marketed small molecule co-formulations, the number of peptide- or protein-based products is very limited;9-11 only one protein co-formulation containing rituximab (MabThera) and human hyaluronidase is currently marketed.12 Co-formulation of therapeutic antibodies increases the complexity of the drug product, and hence creates challenges in characterization and release assay development.13 This challenge is exacerbated when the co-formulated antibodies have similar physicochemical properties and wide disparity in their concentrations. Furthermore, each of the co-formulated antibodies can exhibit various heterogeneities in size, charge, and post-translational modifications (PTMs)14,15 during manufacturing.16,17
Several approaches have been widely used for the monitoring and characterization of charge variants of recombinant mAbs. Slab gel isoelectric focusing methods have traditionally been used for analysis of protein charge variants,18-20 although it is more of a qualitative than a quantitative method. Ion exchange chromatography (IEC), by the application of either a gradient of increasing salt concentrations at a constant pH21,22 or a pH-gradient elution,23,24 is regarded as the gold standard for the characterization of protein charge variants, owing to its robustness and resolving power,25 despite the time investment required to develop a molecule-specific method. Capillary isoelectric focusing (cIEF) electrophoresis with imaged technology offers reduced sample volume, minimal development time, high resolution, and rapid analysis.26-29 Most of the aforementioned methods have been adopted as routine analytical tools for the analysis of charge variants in quality control (QC) and release tests in the biopharmaceutical industry. Nevertheless, more advanced techniques, such as liquid chromatography coupled with tandem mass spectrometry (LC-MS), provide charge variants characterization at the peptide or residue level.30,31 Challenges remain, however, regarding ways to implement these techniques into routine analysis and regulated QC processes.32
Limited analytical methods have been reported for measuring quality attributes in co-formulated mAbs. A size-exclusion chromatography (SEC) method with MS was used for analyzing aggregates of mAb mixture.33 An enzyme-linked immunosorbent assay and an antibody-dependent cell-mediated cytotoxicity assay have been developed for a co-formulated mAbs at 1:1 ratio.6 In another study, several physicochemical methods used in characterizing a co-formulation of 9 mAbs were reported.7 IEC showed separation of some of the mAbs and was the best way to distinguish multiple mAbs in co-formulation compared to SEC or gel electrophoresis methods.7 However, this study used equal concentrations among all mAbs in COMBO; additionally, the IEC method in this study was not a quantitative method for monitoring charge isoforms of each mAb. We were unable to use the same approach as reported by Li et. al.7 because we desired quantitative charge isoform distribution information about each mAb in the COMBO, across a variety of different co-formulation ratios.
Here, we focus on charge heterogeneity of the co-formulated mAb-A and mAb-B in our COMBO product. The full characterization of charge variants, critical quality attribute (CQA) identification, and release assay development and qualification are discussed.
Results
Development of charge variant assays for co-formulated mAb-A and mAb-B
During individual product development of mAb-A and mAb-B, cIEF has been used successfully to monitor charge variants of drug substances during lot release and stability. Extensive characterization and structure-function studies identified an acidic charge variant of mAb-B, identified as CDR deamidation, affects biologic activity. This mAb-B CDR deamidation must also be controlled when developing COMBO, i.e., the co-formulated mAbs. However, mAb-A and mAb-B have similar pI values (differing by only 0.1), and it is therefore difficult to completely resolve the charge profiles of mAb-A and mAb-B using cIEF (as shown in Figure 1). Even as a profile method or as a protein ratio assay, the cIEF method is not suitable when the COMBO has different ratios of mAb-A and mAb-B.
Figure 1.
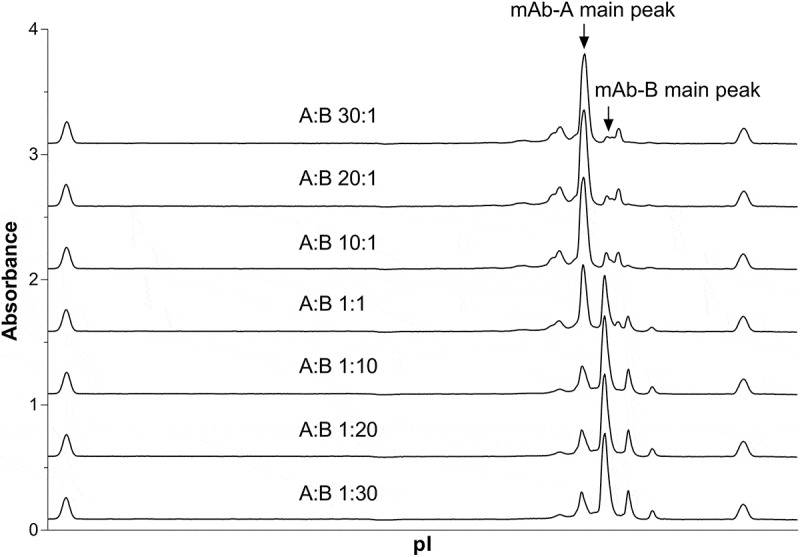
cIEF electropherograms of COMBO with various mAb-A: mAb-B ratios.
IEC is a popular alternative to cIEF for characterization of charge variants. In addition to pI value, surface charge distribution also has a substantial effect on IEC retention and separation. For example, two mAbs with identical pI values have been reported to have large retention time differences under IEC conditions.34 In our case, an IEC method was developed to successfully separate mAb-A and mAb-B at different ratios (Figure 2). The major peaks of mAb-A and mAb-B are greater than 35 minutes apart (Figure 2(a)). However, for stressed mAb-A and mAb-B, the IEC UV profiles could have coelution between some of mAb-A acidic variants and mAb-B main peak (Figure 2(b)). Figure 3 plots the area percent of charge variants of mAb-A and mAb-B against its content in COMBO. For the non-stressed COMBO drug product, quantitation of mAb-A and mAb-B charge variants were comparable across most of the mAb-A: mAb-B ratios (Figure 3(a,b)). However, robustness became a concern when the percentage of one of the mAbs in the COMBO was too low (such as at mAb-A:mAb-B ratios of 1:20, 20:1 and 30:1) because the UV signals were too low to accurately integrate for the acid or basic variants of the minor component. For the COMBO stressed at 40ºC for 3 months, the quantitation of mAb-A charge variants is similar in different ratios in COMBO except when mAb-A:mAb-B is 1:30 (Figure 3(c)). On the other hand, the quantitation of mAb-B charge variants in stressed COMBO by IEC is more difficult. For, example, when mAb-B is less than 50% in the COMBO, the area percent of basic peaks of mAb-B are greatly inflated, whereas the area percent of main and acidic peaks are underestimated correspondingly (Figure 3(d)).
Figure 2.
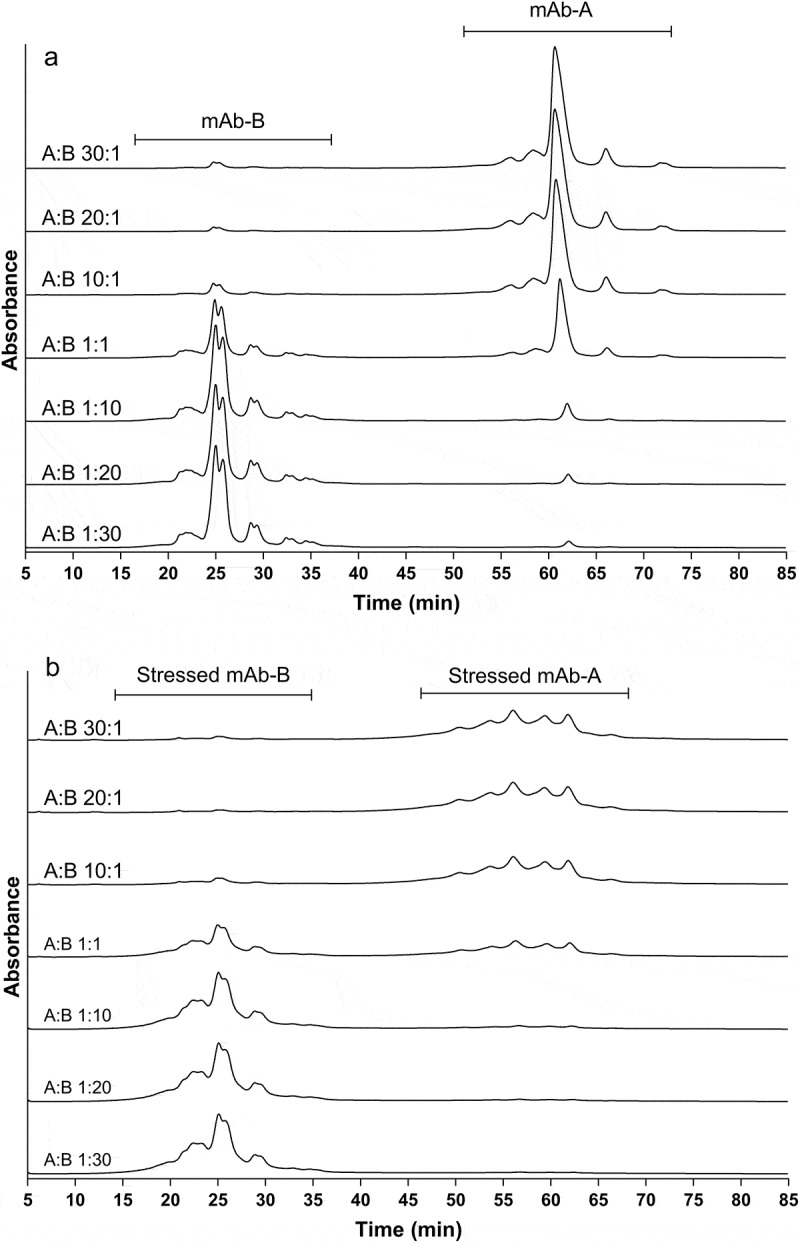
IEC charge variant profiles of non-stressed and stressed COMBO with various mAb-A: mAb-B ratios. The main peak split in mAb-B is caused by IgG2 disulfide bond isoforms (mainly B and A/B forms). (a) non-stressed COMBO; (b) COMBO stressed at 40°C for 3 months.
Figure 3.
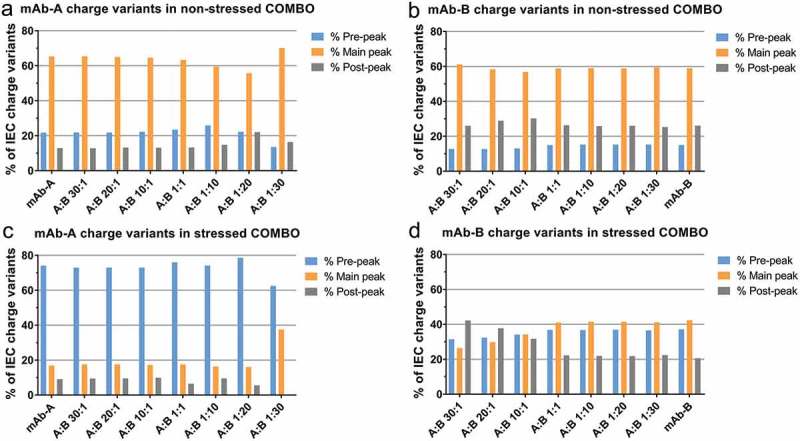
IEC quantitation of charge variants of mAb-A and mAb-B in non-stressed COMBO and stressed COMBO with various mAb-A:mAb-B ratios. (a) and (b) non-stressed COMBO; (c) and (d) COMBO stressed at 40°C for 3 months.
Characterization of IEC charge variants in stressed COMBO indicated that mAb-A acidic variants formed under stressed conditions co-eluted with mAb-B charge variants in IEC. These mAb-A acidic variants have been identified by LC-MS as small hinge fragments (SHF) and large hinge fragments (LHF). SEC fractions of these hinge fragments have been collected from 40°C stressed mAb-A and injected to IEC column. It was confirmed that they co-elute with mAb-B under the same IEC condition (Figure 4). Figure 4 is an IEC UV overlay of three samples: the non-stressed COMBO containing 5% mAb-B and 95% mAb-A (in blue trace), the enriched mAb-A LHF from SEC fraction of 40°C 3-month stressed mAb-A (in red trace), and the enriched mAb-A SHF from SEC fraction of 40°C 3-month stressed mAb-A (in green trace). The results demonstrated that both LHF and SHF from mAb-A co-eluted with mAb-B in COMBO, interfering with mAb-B charge variants quantitation. Additional efforts to separate these mAb-A fragments from mAb-B using IEC chromatography were unsuccessful. As a result, the percentage of mAb-B charge variants cannot be accurately quantified under stressed conditions, especially when mAb-A is the dominant constituent in co-formulation.
Figure 4.
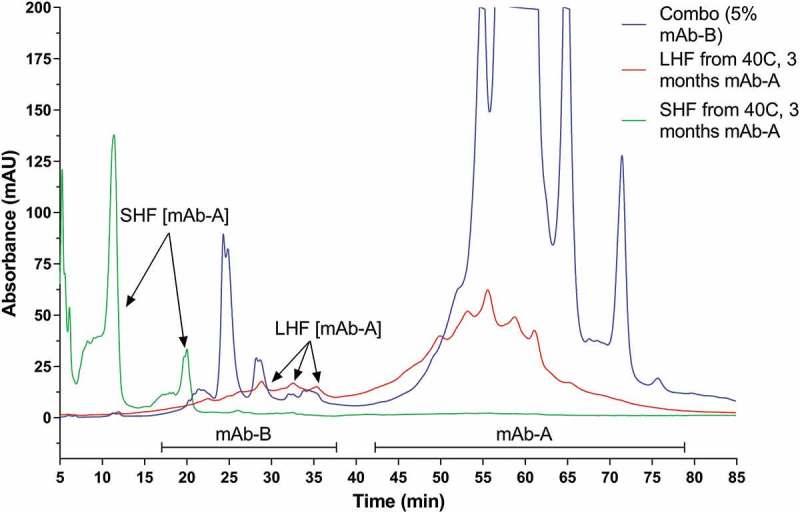
IEC UV overlays of non-stressed COMBO drug product containing 5% mAb-B and 95% mAb-A (in blue trace), mAb-A large hinge fragment (LHF) from SEC fraction of 40°C stressed mAb-A (in red trace), and mAb-A small hinge fragment (SHF) from SEC fraction of 40°C stressed mAb-A (in green trace).
Characterization of charge variants and identifying CQA in COMBO by IEC
To further characterize the charge variants in COMBO and the limitation of the IEC method, IEC fractionation was performed on the non-stressed COMBO drug product with mAb-B as a minor component. The fractions were analyzed by intact mass analysis using RP-LC/MS for peak identification, peptide mapping with MS/MS for post-translational modification quantitation, and bioassay for biological activity. The same experiment was performed on stressed COMBO at the same ratio. All the charge variants in COMBO matched what had been identified in individually formulated mAb-A and mAb-B under both recommended storage and stress conditions as shown in supplementary material (the IEC peak fractions are labeled in Figure S1, and the identification and biological activity impact assessment are reported in Tables S1 and S2.). No new charge variants were generated due to the co-formulation of mAb-A and mAb-B. Among all the charge variants, only the CDR deamidation from mAb-B in the COMBO had an impact on biological activity and was therefore identified as a CQA for COMBO that requires monitoring. All other charge variants in the COMBO were non-CQAs. This observation was consistent with CQA determinations for charge variants in individual mAb-A and mAb-B.
It is not uncommon to have very different concentrations of co-formulated antibodies.35 In practice, a method that is able to cover co-formulations with wider concentration disparity is always preferred to allow clinical flexibility. Even with non-stressed COMBO drug product where the interference from mAb-A fragments are minimal, the robustness of quantitating the charge variants at low levels from the minor species becomes greatly compromised when minor species content drops to less than 5% in COMBO. This challenge arises from the dynamic range of UV-based quantification, and is not specific to our COMBO.
In summary, the IEC method lacked the specificity and robustness required for quantitative measurement of mAb-B charge variants as routine lot release and stability testing for COMBO. It could, however, be utilized for product characterization to qualitatively evaluate the overall charge variants profiles of COMBO.
Evaluation of peptide mapping for monitoring critical charge variants in COMBO using MS or UV signal
Tryptic peptide mapping with MS was evaluated for monitoring critical charge variant of mAb-B at various mAb-A:mAb-B ratios. Comparable quantitation results were obtained for mAb-B CDR deamidation in different ratio of mAb-A to mAb-B (Figure 5). The non-stressed COMBO drug product (stored at 2–8°C), as well as the stressed COMBO samples (stressed at 40°C for 3 months), produced comparable results across all mAb-A: mAb-B ratios, demonstrating that peptide mapping is an appropriate method to quantitatively monitor mAb-B CDR deamidation in combo products. Moreover, peptide mapping with ion trap MS-based detection and quantitation can provide high-sensitivity and site-specific information on charge variants, which are lacking in other charge-based assays. However, utilizing peptide mapping with ion trap MS-based detection and quantitation in QC laboratories is accompanied by its own challenges, as it requires a high-end mass spectrometer and complex instrument operation, data processing, and instrument and method validation.
Figure 5.
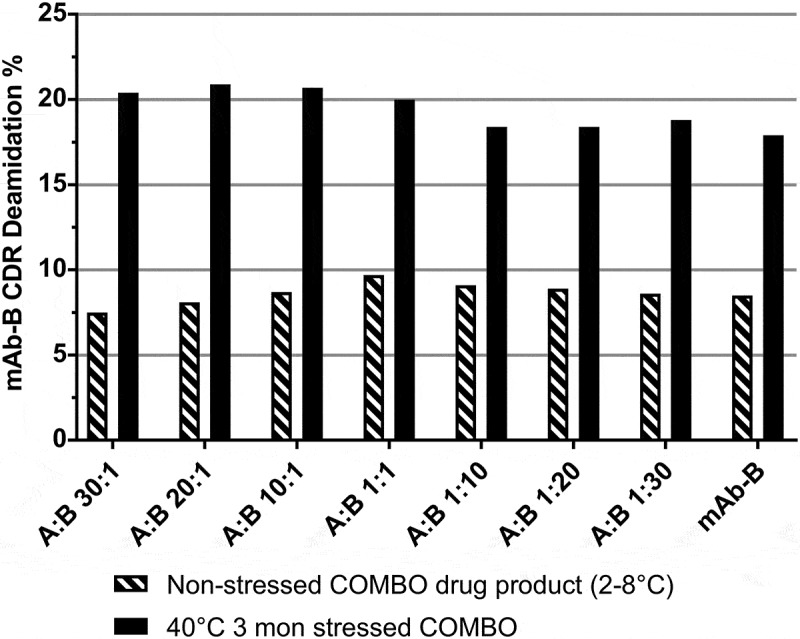
mAb-B CDR deamidation measured by peptide mapping using an ion trap mass detector in non-stressed and stressed COMBO antibody with various mAb-A: mAb-B ratio. A: mAb-A; B: mAb-B.
We evaluated a UV chromatogram from a tryptic digest of the COMBO and found it to be unsuitable for monitoring mAb-B CDR deamidation, especially if mAb-B is a minor component (Figure 6). Insufficient resolution of the UV-based method made it difficult to separate and quantify the CDR deamidation–related peptides (L3 and L3L4) from other peptides in the COMBO. When the percentage of mAb-B was <10%, peptides from mAb-B were not detectable and the UV profile of the COMBO appeared identical to that of mAb-A (Figure 6(c,d)).
Figure 6.
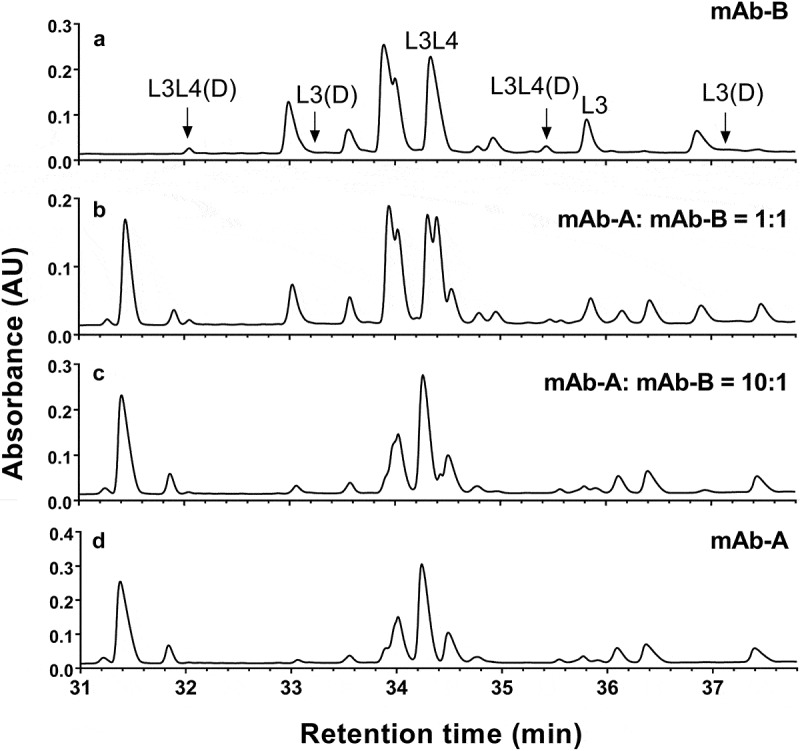
UV (220 nm) chromatograms of tryptic digest of mAb-A, mAb-B and COMBO antibodies containing mAb-A: mAb-B at 1:1 and 10:1. (a) mAb-B; (b) COMBO containing mAb-A: mAb-B at 1:1; (c) COMBO containing mAb-A: mAb-B at 10:1; (d) mAb-A.
Development of a quadrupole dalton-based focused peptide mapping method to quantitate mAb-B CDR deamidation as a lot release and stability assay
To quantitatively monitor the CDR deamidation of mAb-B in the COMBO for lot release and stability, we developed and implemented a focused peptide mapping method using a quadrupole Dalton (QDa) mass detector. We evaluated its specificity, sensitivity, resolution, and simplicity in transferring to the QC laboratory. The method development involved optimizing the sample preparation; selecting a mass charge ratio for selected ion recording (SIR) channels; optimizing cone voltages, capillary voltages, and probe temperatures for ion intensity; evaluating trifluoroacetic acid (TFA) versus formic acid as an ion-pairing reagent in the mobile phases for reduced peak interference; and verifying quantitation results by comparison with conventional peptide mapping data using an ion trap mass detector.
Optimizing the sample preparation for enzyme digestion
The denaturing buffer consisted of 1.3 M guanidine hydrochloride, 8 M urea, and 100 mM tris(hydroxymethyl)aminomethane (Tris), which circumvented the buffer exchange–desalting step that is typically used in conventional peptide mapping protocols in which a high concentration of guanidine hydrochloride is used. The benefits of skipping the buffer exchange step include simplicity of sample handling, shorter sample preparation time, consistent peak intensities, and feasibility of adaptation for future automation. The digestion conditions were also optimized by adjusting the buffer pH, trypsin: protein ratio, and digestion time to minimize sample preparation-induced deamidation and to maximize complete digestion. Three digestion conditions, designated A, B, and C, were explored (Table S3 and Figure S2). Digestion condition C was selected for the COMBO due to its relatively low levels of assay artifacts on deamidation and its high rate of completion of digestion. The other two digestion conditions had either high levels of deamidation artifacts (condition A) or incomplete digestion peak at 78 min (condition B).
QDa-based focused peptide mapping method for quantification of mAb-B CDR deamidation in COMBO
Details of the QDa-based focused peptide mapping method are described in the Materials and Methods section. To quantify mAb-B CDR deamidation in COMBO, six tryptic peptides containing the CDR deamidation site in mAb-B were monitored: two native peptides, L3 and L3L4, and two isomeric deamidated peptides from each native peptide. The mass charge ratios of these peptides were selected and utilized in the SIR channels for specific functions of the QDa method. Ions with these mass charge ratios were detected and quantitated by the QDa mass detector in specified retention time windows. For maximum sensitivity, the highest-intensity monoisotopic masses of each peptide were selected in the SIR channel. A range of cone voltages, capillary voltages, and probe temperatures were screened in multiple injections to achieve optimal peak intensities. SIR profiles in which either TFA or formic acid was used as an ion-pairing reagent in mobile phases were compared, and TFA was selected due to its lower peak interference from the sample matrix.
Figure 7 shows example QDa profiles from the non-stressed COMBO drug product and COMBO drug product stressed at 25ºC for 6 months, both containing a mAb-B as a minor component (5%). Figure 7(a) shows where the SIR channels for L3 and deamidated L3 were monitored. It is possible some interfering peaks with similar m/z monitored by the SIR channel may appear, as the resolution of the QDa mass detector is only 0.7 Dalton. An example of an interfering peak is the 32.8 min peak in SIR channels for quantitating L3 and deamidated L3 in Figure 7(a). To ensure correct peak assignment, all peaks monitored by QDa were confirmed by a high-resolution mass spectrometer that provided both mass spectrometry and tandem mass spectrometry information during method development. Also, the interfering peaks tend to have constant peak intensities in all samples, regardless of stress conditions, as seen for peaks at 32.8 min in Figure 7(a).
Figure 7.
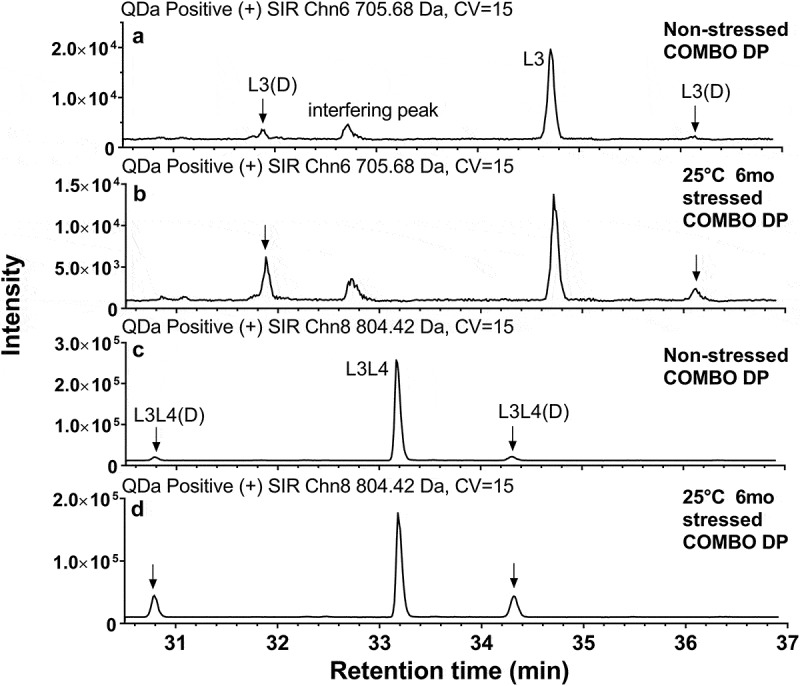
CDR deamidation related-peaks in non-stressed COMBO drug product stored at 2–8°C and 25°C 6-month stressed COMBO antibodies, both containing mAb-B as minor species (5%). (a) L3 and L3(D) in non-stressed COMBO drug product; (b) L3 and L3(D) in 25°C 6-month stressed COMBO ; (c) L3L4 and L3L4(D) in non-stressed COMBO drug product; (b) L3L4 and L3L4(D) in 25°C 6-month stressed COMBO. DP: drug product.
In addition to peak identification, the levels of CDR deamidation measured by the QDa method were verified by conventional peptide mapping using extracted ion chromatogram (XIC) quantitation. COMBO drug product containing mAb-B as a minor component was stressed in two different buffers having the same components, but differentiated by pH (pH 6.0 and 6.5). Under each pH condition, samples were kept for up to 6 months at 2–8°C and 25°C, and up to 3 months at 40°C. Data obtained from the QDa-based method were comparable to those from the conventional peptide mapping method using an ion-trap mass spectrometer (Figure 8).
Figure 8.
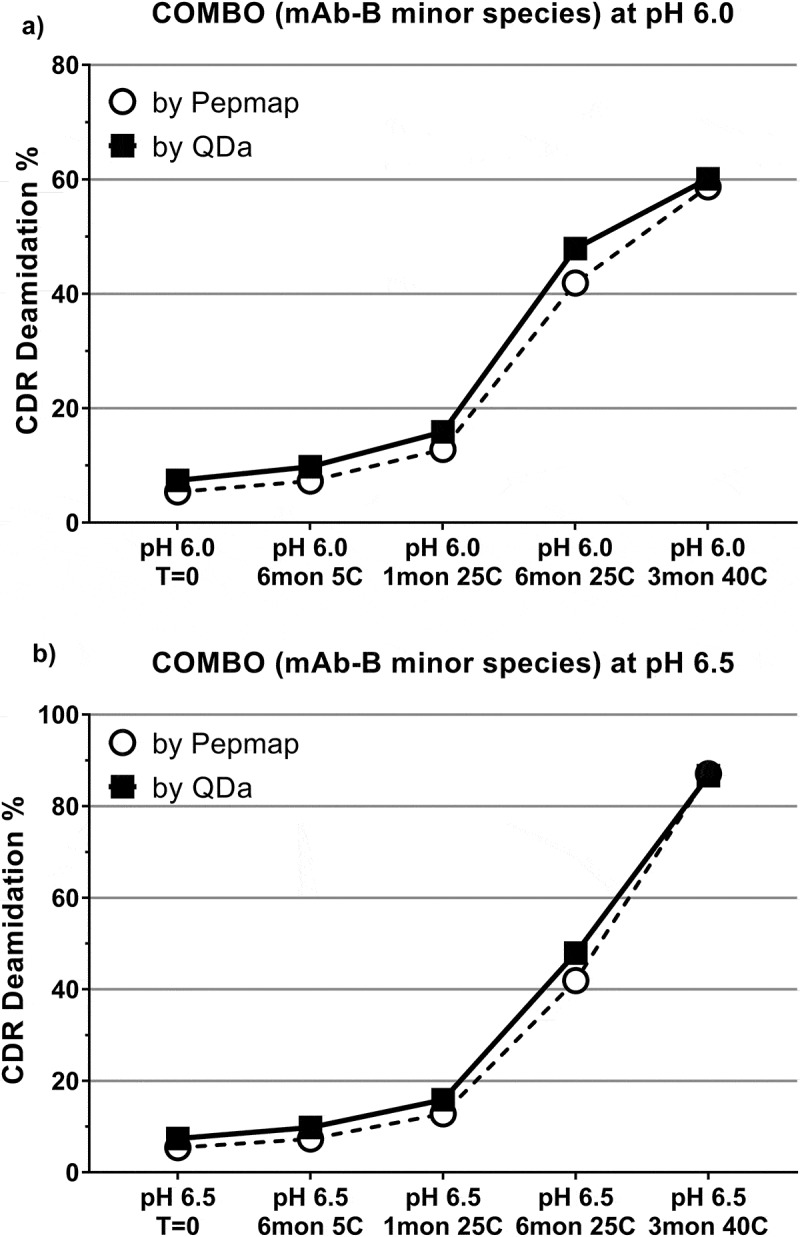
Comparison of CDR deamidation by the QDa-based method and peptide mapping using heat-stressed COMBO antibody over a pH range of 6.0–6.5. (A) pH 6.0; (B) pH 6.5.
In another experiment, CDR deamidation data from a COMBO with mAb-B as a minor component was compared with deamidation data from an individual mAb-B drug substance under the same heat stress conditions (temperature 5 to 40°C, pH 5.5 to 6.5, incubation time 3 months). Comparable results were obtained for both the COMBO and the stand-alone mAb-B (Figure 9). These results indicate that mAb-B CDR deamidations were independent of the co-formulated mAb-A. Interaction between these two antibodies, which could affect the critical charge variants or its degradation rate in the COMBO, was not observed.
Figure 9.
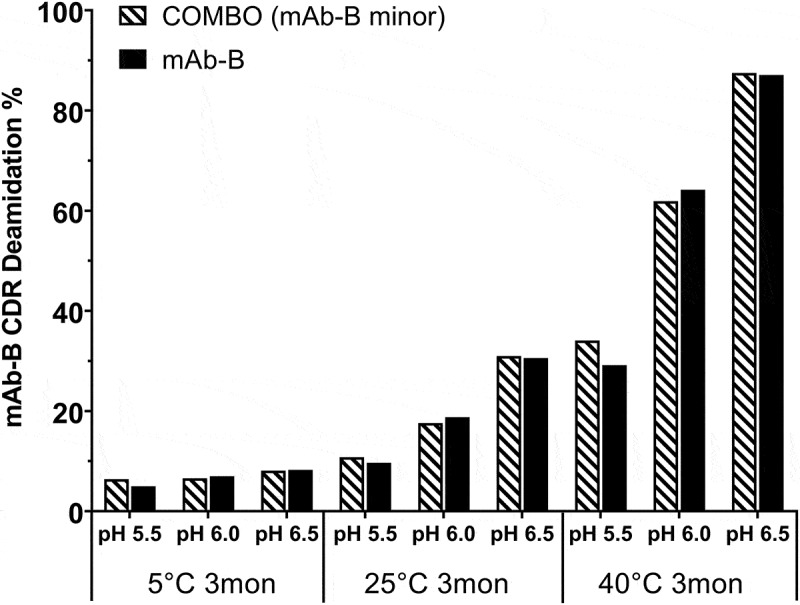
Comparison of CDR deamidation in COMBO and individual mAb-B under heat stress conditions over a pH range of 5.5–6.5 (COMBO containing mAb-B as a minor component).
In addition to its application in monitoring mAb-B CDR deamidation (a CQA) in COMBO, the QDa-based method was also developed as a multi-attribute method for COMBO by including ions representing other quality attributes, such as Fc Asn deamidation, and CDR Trp oxidation, of mAb-B in COMBO in the SIR channels for monitoring. Results from the QDa-based method were comparable to those of conventional peptide mapping using ion trap XIC quantitation in monitoring multiple quality attributes. The data are shown in Figure S3.
Qualification of the QDa-based focused peptide mapping method for monitoring mAb-B CDR deamidation in COMBO
After establishing the QDa-based focused peptide mapping method for monitoring mAb-B CDR deamidation in COMBO, we undertook efforts to qualify the method to support its use as a lot release and stability-indicating assay in a good manufacturing practice (GMP) environment. To this end, we evaluated several key characteristics of the assay according to the validation design described in the International Conference on Harmonization (ICH) guideline Q2(R1).36 The ability of this method to quantify CDR deamidation from minor components of COMBO was evaluated by determining the assay’s specificity, linearity, accuracy, precision, and limit of quantitation (LOQ) and limit of detection (LOD). Both the stressed and the non-stressed combo drug product containing mAb-B as a minor component were used for method qualification. The qualification results are summarized in Table 1, and details are discussed in supplementary material.
Table 1.
Summary of qualification results.
| Non-stressed |
Stressed |
|||
|---|---|---|---|---|
| Specificity | Mean %CDR deamidation | % CV | Mean %CDR deamidation | % CV |
| Precision-repeatability (6 preps × 1 injection) | 6.5 | 2.5 | 58.5 | 0.5 |
| Intermediate precision 3 preps/day, 2 days |
6.5 | 2.5 | 58.4 | 0.5 |
| 3 preps/analyst, 2 analysts | 6.4 | 2.6 | 58.5 | 0.6 |
| 6 preps/lab, 2 labs |
6.6 |
4.5 |
58.0 |
1.2 |
| Linearity and range |
0.9982 r2 with a range of 6 spiking levels |
|||
| σ | 0.89294 | |||
| S | 1.96387 | |||
| LOQ, %CDR deamidation, from calibration curve, 10 (σ/S) | 1.5 | |||
| LOD, %CDR deamidation, from calibration curve, 3.3 (σ/S) |
4.5 |
|||
| Accuracy at % spiking levelb |
% Recovery |
% CV |
||
| 10% (low) | 106 | 1.4 | ||
| 55% (middle) | 97 | 0.4 | ||
| 85% (high) | 99 | 0.3 | ||
aThere was no response for the buffer blank and a positive response for the known sample.
bAccuracy was determined at three levels with three replicates each.
σ = standard deviation of the regression line (in this study, the standard deviation of y-intercepts of the regression lines); CV = coefficient of variation; LOD = limit of detection; LOQ = limit of quantitation; S = slope of the regression line.
Discussion
Charge variants and impurities can have an impact on the performance of co-formulated combination antibodies, hence they need to be characterized and monitored appropriately, which may require multiple analytical methods. In this study, the charge variants of individual mAbs in COMBO were characterized and a CQA, a CDR deamidation from one antibody component, was identified. Methods such as cIEF are not applicable for monitoring charge variants in COMBO product when the pI of individual mAb are very close and there is a wide disparity in their concentrations. An IEC method is used as a characterization and comparability test for qualitative measurement of overall profiling of charge variants, but not for site-specific CQA monitoring. A high-sensitivity, QDa-based, focused peptide map method is developed to quantify the CDR deamidation. This method can quantify CDR deamidation from one component in COMBO in a wide ratio range, even if it is from the very minor component of the COMBO. The QDa-based method had a sensitivity comparable to that of the ion-trap peptide mapping method used in development laboratories, but because its mass detector and software are designed for a QC environment, this method was successfully qualified and transferred to a GMP environment and validated as a lot release and stability testing assay. The new method demonstrated good specificity and accuracy, a low LOQ, and good dynamic range for quantitation of a CQA in combination therapeutic molecules.
Materials and methods
Chemicals, recombinant proteins, and combination proteins
mAb-A and mAb-B were full-length human IgG1 and IgG2 antibodies produced in Chinese hamster ovary cells and NS0 cells, respectively, by MedImmune (Gaithersburg, MD). Trypsin was obtained from Promega (Madison, WI). Dithiothreitol (no-weight format) was obtained from Pierce Protein Biology (Rockford, IL). Urea (OmniPur), water (OmniSolve, HPLC and spectrophotometry grade) and acetonitrile (OmniSolve, HPLC and spectrophotometry grade) were obtained from EMD (Billerica, MA). Iodoacetamide (OneQuant) was obtained from G-Biosciences (St. Louis, MO). TFA in flame-sealed, 1-mL ampules was obtained from Sigma-Aldrich (St. Louis, MO). COMBO was made by mixing mAb-A and mAb-B at protein concentration ratios of 30:1, 20:1, 10:1, 1:1, 1:10, 1:20, and 1:30.
IEC for charge profiling
IEC was used to measure the charge heterogeneity of mAb-A and mAb-B and to collect each individual peak for characterization and identification. Analysis and peak collection were performed on a 1100/1200 liquid chromatography system with a binary or quaternary pump (Agilent, Santa Clara, CA). mAb-A and mAb-B were injected onto an analytical ProPac WCX-10 column (4 mm × 250 mm; Thermo Fisher Scientific, Waltham, MA) connected to a ProPac WCX-10G guard column (4 mm × 50 mm; Thermo Fisher) at a column temperature of 25°C. mAb-A and mAb-B were eluted in a salt gradient from 30–100% (solvent B) over 80 min with mobile phase A composed of 20 mM sodium phosphate, pH 6.0, and mobile phase B composed of 20 mM sodium phosphate and 100 mM sodium chloride, pH 6.0, at a flow rate of 1.0 mL/min. The eluted protein was detected by UV absorbance at 220 nm with a diode array detector to assess charge heterogeneity. Results are reported as percentage of acidic peaks (pre-peaks), percentage of main peak, and percentage of basic peaks (post-peaks) of mAb-A and mAb-B. For characterization and peak identification, each individual peak was collected by connecting a fraction collector (Agilent) to the liquid chromatography system. All of the fractions collected for each individual peak were pooled, buffer exchanged to remove residual salt, and concentrated.
cIEF for charge profiling
Each sample was diluted to 0.3 mg/mL in a master mix containing 0.35% methylcellulose solution; 4% Pharmalyte, pH 3–10; 0.005% pI marker 5.85, and 0.005% pI marker 9.46. The samples were then loaded onto an iCE280 analyzer (Protein Simple, San Jose, CA) and focused at 1,500 V for 1 min, followed by 3,000 V for 5 min. The protein was detected under UV at 280 nm. The resulting electrophoresis profiles were analyzed with the use of Empower software (Waters, Milford, MA).
Tryptic peptide mapping with mass spectrometry for post-translational modifications
Peptide mapping was used to verify primary sequences and evaluate posttranslational modifications. Samples were diluted to 10 mg/mL; mixed with a denaturing buffer composed of 1.3 M guanidine, 8 M urea, 130 mM Tris at pH 8.0, and 500 mM dithiothreitol; vortexed; and incubated at 37°C for 30 min. Iodoacetamide was added for alkylation, and the mixture was incubated in the dark at room temperature for 30 min. The reduced and alkylated samples were diluted in 100 mM Tris buffer (pH 7.5) and then digested with trypsin at 37°C for 3 h. The digestion was quenched with TFA before LC/MS analysis.
Focused peptide mapping for quantitation of CDR Asn deamidation
Focused peptide mapping was used to quantitate site-specific posttranslational modifications of proteins. The trypsin digestion procedure was the same as described above for the regular peptide mapping method. The digested peptides were separated with a reversed-phase C-18 column, using an Acquity ultra-performance liquid chromatography (UPLC) system (Waters), and detected by UV and a QDa mass detector. Modified peptides were resolved from native peptides by their differences in masses and retention times. Identification of both native and modified peptides was further confirmed by an injection of synthetic peptide standards. Quantitative results were obtained by using peak areas defined by the modified and unmodified peptides and are reported as percentage of modification.
Abbreviations
- CDR
complementarity-determining region
- cIEF
Capillary isoelectric focusing
- CQA
critical quality attribute
- CV
coefficient of variation
- Fc
crystalizable fragment
- GMP
good manufacturing practice
- LC-MS
liquid chromatography with mass spectrometry
- LHF
large hinge fragments
- LOD
limit of detection
- LOQ
limit of quantitation
- mAb
monoclonal antibody
- PTM
post-translational modifications
- QC
quality control
- QDa
quadrupole Dalton
- SEC
size-exclusion chromatography
- SHF
small hinge fragment
- SIR
selected ion recording
- TFA
trifluoroacetic acid
- XIC
extracted ion chromatogram.
Acknowledgments
The authors thank Weimin Chen and Miranda Feng from MedImmune for their support for the bioassays used in this work.
Disclosure of Potential Conflicts of Interest
No potential conflict of interest was reported by the authors.
Supplemental data
Supplemental data for this article can be accessed on the publisher’s website.
References
- 1.Chen DS, Mellman I.. Oncology meets immunology: the cancer-immunity cycle. Immunity. 2013;39(1):1–10. doi: 10.1016/j.immuni.2013.07.012. [DOI] [PubMed] [Google Scholar]
- 2.Le DT, Uram JN, Wang H, Bartlett BR, Kemberling H, Eyring AD, Skora AD, Luber BS, Azad NS, Laheru D, et al. PD-1 blockade in tumors with mismatch-repair deficiency. N Engl J Med. 2015;372(26):2509–20. doi: 10.1056/NEJMoa1500596. [DOI] [PMC free article] [PubMed] [Google Scholar]
- 3.Morrissey KM, Yuraszeck TM, Li CC, Zhang Y, Kasichayanula S. Immunotherapy and novel combinations in oncology: current landscape, challenges, and opportunities. Clin Transl Sci. 2016;9(2):89–104. doi: 10.1111/cts.12391. [DOI] [PMC free article] [PubMed] [Google Scholar]
- 4.Ott PA, Hodi FS, Kaufman HL, Wigginton JM, Wolchok JD. Combination immunotherapy: a road map. J Immunother Cancer. 2017;5(1):16. doi: 10.1186/s40425-017-0218-5. [DOI] [PMC free article] [PubMed] [Google Scholar]
- 5.Schmidt C. The benefits of immunotherapy combinations. Nature. 2007;552:S67–S69. doi: 10.1038/d41586-017-08702-7. [DOI] [PubMed] [Google Scholar]
- 6.Chao TY, Ren S, Shen E, Moore S, Zhang SF, Chen L, Rupprecht CE, Tsao E. SYN023, a novel humanized monoclonal antibody cocktail, for post-exposure prophylaxis of rabies. PLoS Negl Trop Dis. 2017;11(12):e0006133. doi: 10.1371/journal.pntd.0006133. [DOI] [PMC free article] [PubMed] [Google Scholar]
- 7.Li M, Lee D, Obi CR, Freeberg JK, Farr-Jones S, Tomic MT. An ambient temperature-stable antitoxin of nine co-formulated antibodies for botulism caused by serotypes A, B and E. PLoS One. 2018;13(5):e0197011. doi: 10.1371/journal.pone.0197011. [DOI] [PMC free article] [PubMed] [Google Scholar]
- 8.Larkin J, Chiarion-Sileni V, Gonzalez R, Grob JJ, Cowey CL, Lao CD, Schadendorf D, Dummer R, Smylie M, Rutkowski P, et al. Combined nivolumab and ipilimumab or monotherapy in untreated melanoma. N Engl J Med. 2015;373(1):23–34. doi: 10.1056/NEJMoa1504030. [DOI] [PMC free article] [PubMed] [Google Scholar]
- 9.Havelund S, Ribel U, Hubalek F, Hoeg-Jensen T, Wahlund PO, Jonassen I. Investigation of the physico-chemical properties that enable co-formulation of basal insulin degludec with fast-acting insulin aspart. Pharm Res. 2015;32(7):2250–58. doi: 10.1007/s11095-014-1614-x. [DOI] [PMC free article] [PubMed] [Google Scholar]
- 10.Kalra S, Gupta Y. Injectable coformulations in diabetology. Diabetes Ther. 2015;6(2):101–11. doi: 10.1007/s13300-015-0106-2. [DOI] [PMC free article] [PubMed] [Google Scholar]
- 11.Kumar A. Insulin degludec/liraglutide: innovation-driven combination for advancement in diabetes therapy. Expert Opin Biol Ther. 2014;14(6):869–78. doi: 10.1517/14712598.2014.904851. [DOI] [PubMed] [Google Scholar]
- 12.Shpilberg O, Jackisch C. Subcutaneous administration of rituximab (MabThera) and trastuzumab (Herceptin) using hyaluronidase. Br J Cancer. 2013;109(6):1556–61. doi: 10.1038/bjc.2013.371. [DOI] [PMC free article] [PubMed] [Google Scholar]
- 13.Mueller C, Altenburger U, Mohl S. Challenges for the pharmaceutical technical development of protein coformulations. J Pharm Pharmacol. 2018;70(5):666–74. doi: 10.1111/jphp.12731. [DOI] [PubMed] [Google Scholar]
- 14.Beck A, Bussat MC, Zorn N, Robillard V, Klinguer-Hamour C, Chenu S, Goetsch L, Corvaia N, Van Dorsselaer A, Haeuw JF. Characterization by liquid chromatography combined with mass spectrometry of monoclonal anti-IGF-1 receptor antibodies produced in CHO and NS0 cells. J Chromatogr B Analyt Technol Biomed Life Sci. 2005;819(2):203–18. doi: 10.1016/j.jchromb.2004.06.052. [DOI] [PubMed] [Google Scholar]
- 15.Vlasak J, Ionescu R. Heterogeneity of monoclonal antibodies revealed by charge-sensitive methods. Curr Pharm Biotechnol. 2008;9:468–81. [DOI] [PubMed] [Google Scholar]
- 16.Haberger M, Bomans K, Diepold K, Hook M, Gassner J, Schlothauer T, Zwick A, Spick C, Kepert JF, Hienz B, et al. Assessment of chemical modifications of sites in the CDRs of recombinant antibodies: susceptibility vs. functionality of critical quality attributes. MAbs. 2014;6(2):327–39. doi: 10.4161/mabs.27876. [DOI] [PMC free article] [PubMed] [Google Scholar]
- 17.Quan C, Alcala E, Petkovska I, Matthews D, Canova-Davis E, Taticek R, Ma S. A study in glycation of a therapeutic recombinant humanized monoclonal antibody: where it is, how it got there, and how it affects charge-based behavior. Anal Biochem. 2008;373(2):179–91. doi: 10.1016/j.ab.2007.09.027. [DOI] [PubMed] [Google Scholar]
- 18.Ploegh HL. One-dimensional isoelectric focusing of proteins in slab gels. Curr Protoc Protein Sci. 2001;Chapter 10:Unit 10.2. [DOI] [PubMed] [Google Scholar]
- 19.Righetti PG, Gianazza E, Bjellqvist B. Modern aspects of isoelectric focusing: two-dimensional maps and immobilized pH gradients. J Biochem Biophys Methods. 1983;8:89–108. [DOI] [PubMed] [Google Scholar]
- 20.Tang S, Nesta DP, Maneri LR, Anumula KR. A method for routine analysis of recombinant immunoglobulins (rIgGs) by capillary isoelectric focusing (cIEF). J Pharm Biomed Anal. 1999;19:569–83. [DOI] [PubMed] [Google Scholar]
- 21.Johnson KA, Paisley-Flango K, Tangarone BS, Porter TJ, Rouse JC. Cation exchange-HPLC and mass spectrometry reveal C-terminal amidation of an IgG1 heavy chain. Anal Biochem. 2007;360(1):75–83. doi: 10.1016/j.ab.2006.10.012. [DOI] [PubMed] [Google Scholar]
- 22.Santora LC, Krull IS, Grant K. Characterization of recombinant human monoclonal tissue necrosis factor-alpha antibody using cation-exchange HPLC and capillary isoelectric focusing. Anal Biochem. 1999;275(1):98–108. doi: 10.1006/abio.1999.4275. [DOI] [PubMed] [Google Scholar]
- 23.Andersen T, Pepaj M, Trones R, Lundanes E, Greibrokk T. Isoelectric point separation of proteins by capillary pH-gradient ion-exchange chromatography. J Chromatogr A. 2004;1025:217–26. [DOI] [PubMed] [Google Scholar]
- 24.Ng PK, He J, Snyder MA. Separation of protein mixtures using pH-gradient cation-exchange chromatography. J Chromatogr A. 2009;1216(9):1372–76. doi: 10.1016/j.chroma.2008.12.100. [DOI] [PubMed] [Google Scholar]
- 25.Fekete S, Beck A, Fekete J, Guillarme D. Method development for the separation of monoclonal antibody charge variants in cation exchange chromatography, Part II: pH gradient approach. J Pharm Biomed Anal. 2015;102:282–89. doi: 10.1016/j.jpba.2014.09.032. [DOI] [PubMed] [Google Scholar]
- 26.He XZ, Que AH, Mo JJ. Analysis of charge heterogeneities in mAbs using imaged CE. Electrophoresis. 2009;30(5):714–22. doi: 10.1002/elps.200800636. [DOI] [PubMed] [Google Scholar]
- 27.Mack S, Cruzado-Park I, Chapman J, Ratnayake C, Vigh G. A systematic study in CIEF: defining and optimizing experimental parameters critical to method reproducibility and robustness. Electrophoresis. 2009;30(23):4049–58. doi: 10.1002/elps.200800690. [DOI] [PubMed] [Google Scholar]
- 28.Pritchett TJ. Capillary isoelectric focusing of proteins. Electrophoresis. 1996;17(7):1195–201. doi: 10.1002/elps.1150170705. [DOI] [PubMed] [Google Scholar]
- 29.Wu XZ, Wu J, Pawliszyn J. Whole-column-imaging detection for capillary isoelectric focusing and capillary electrophoresis. LC GC N Am. 2001;19:526–45. [Google Scholar]
- 30.Tang L, Sundaram S, Zhang J, Carlson P, Matathia A, Parekh B, Zhou Q, Hsieh MC. Conformational characterization of the charge variants of a human IgG1 monoclonal antibody using H/D exchange mass spectrometry. MAbs. 2013;5(1):114–25. doi: 10.4161/mabs.22695. [DOI] [PMC free article] [PubMed] [Google Scholar]
- 31.Xie H, Chakraborty A, Ahn J, Yu YQ, Dakshinamoorthy DP, Gilar M, Chen W, Skilton SJ, Mazzeo JR. Rapid comparison of a candidate biosimilar to an innovator monoclonal antibody with advanced liquid chromatography and mass spectrometry technologies. mAbs. 2010;2:379–94. [DOI] [PMC free article] [PubMed] [Google Scholar]
- 32.Suba D, Urbanyi Z, Salgo A. Capillary isoelectric focusing method development and validation for investigation of recombinant therapeutic monoclonal antibody. J Pharm Biomed Anal. 2015;114:53–61. doi: 10.1016/j.jpba.2015.04.037. [DOI] [PubMed] [Google Scholar]
- 33.Woodard J, Lau H, Latypov RF. Nondenaturing size-exclusion chromatography-mass spectrometry to measure stress-induced aggregation in a complex mixture of monoclonal antibodies. Anal Chem. 2013;85(13):6429–36. doi: 10.1021/ac401455f. [DOI] [PubMed] [Google Scholar]
- 34.Zhang L, Lilyestrom W, Li C, Scherer T, van Reis R, Zhang B. Revealing a positive charge patch on a recombinant monoclonal antibody by chemical labeling and mass spectrometry. Anal Chem. 2011;83(22):8501–08. doi: 10.1021/ac2016129. [DOI] [PubMed] [Google Scholar]
- 35.Selby MJ, Engelhardt JJ, Johnston RJ, Lu L-S, Han M, Thudium K, Yao D, Quigley M, Valle J, Wang C, et al. Preclinical development of ipilimumab and nivolumab combination immunotherapy: mouse tumor models, in vitro functional studies, and cynomolgus macaque toxicology. PLoS One. 2016;11(9):e0161779. doi: 10.1371/journal.pone.0161779. [DOI] [PMC free article] [PubMed] [Google Scholar]
- 36.International Conference on Harmonisation Validation of analytical procedures: text and methodology (Q2[R1]). November 2005. http://www.ich.org/fileadmin/Public_Web_Site/ICH_Products/Guidelines/Quality/Q2_R1/Step4/Q2_R1__Guideline.pdf.
Associated Data
This section collects any data citations, data availability statements, or supplementary materials included in this article.