INTRODUCTORY
Re-expression of the paralogous γ-globin genes (HBG1/2) could be a universal strategy to ameliorate the severe β-globin disorders sickle cell disease (SCD) and β-thalassemia by induction of fetal hemoglobin (HbF, α2γ2)1. Previously we and others have shown that core sequences at the BCL11A erythroid enhancer are required for repression of HbF in adult-stage erythroid cells but dispensable in non-erythroid cells2–6. CRISPR-Cas9 mediated gene modification has demonstrated variable efficiency, specificity, and persistence in hematopoietic stem cells (HSCs). Here we demonstrate that Cas9:sgRNA ribonucleoprotein (RNP) mediated cleavage within a GATA1 binding site at the +58 BCL11A erythroid enhancer results in highly penetrant disruption of this motif, reduction of BCL11A expression, and induction of fetal γ-globin. We optimize conditions for selection-free on-target editing in patient-derived HSCs as a nearly complete reaction lacking detectable genotoxicity or deleterious impact on stem cell function. HSCs preferentially undergo nonhomologous as compared to microhomology mediated end-joining repair. Erythroid progeny of edited engrafting sickle cell disease (SCD) HSCs express therapeutic levels of fetal hemoglobin (HbF) and resist sickling, while those from β-thalassemia patients show restored globin chain balance. NHEJ-based BCL11A enhancer editing approaching complete allelic disruption in HSCs is a practicable therapeutic strategy to produce durable HbF induction.
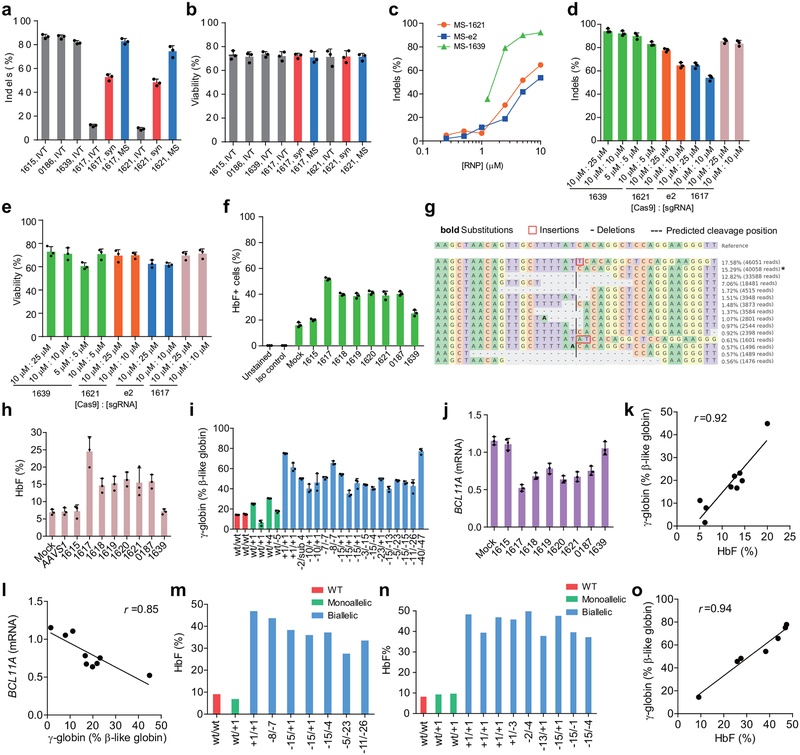
Electroporation of Cas9 and sgRNA RNP complexes enables delivery of a transient pulse of genome editing material to human cells7,8. Previously we had employed lentiviral pooled sgRNA screening to identify a set of sgRNAs targeting the core of the +58 erythroid enhancer of BCL11A resulting in potent HbF derepression3. We used in vitro transcription to produce sgRNAs targeting the BCL11A enhancer and electroporated RNP complexes to healthy donor CD34+ HSPCs, which resulted in variable editing (9.5–87.0% indels; Extended Data Fig. 1a, b). Consistent with prior observations, chemically modified synthetic (MS) sgRNAs produced more efficient editing than in vitro transcribed sgRNAs following RNP electroporation of CD34+ HSPCs9. We observed a dose-dependent relationship between RNP concentration and indel frequency and similar editing efficiency at Cas9:sgRNA molar ratios ranging from 1:1 to 1:2.5 (Extended Data Fig. 1c–e).
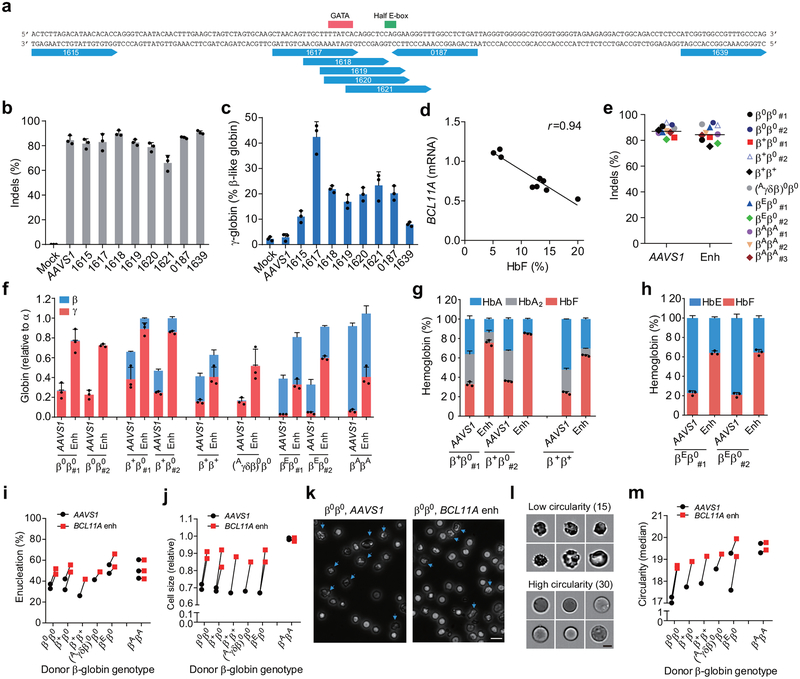
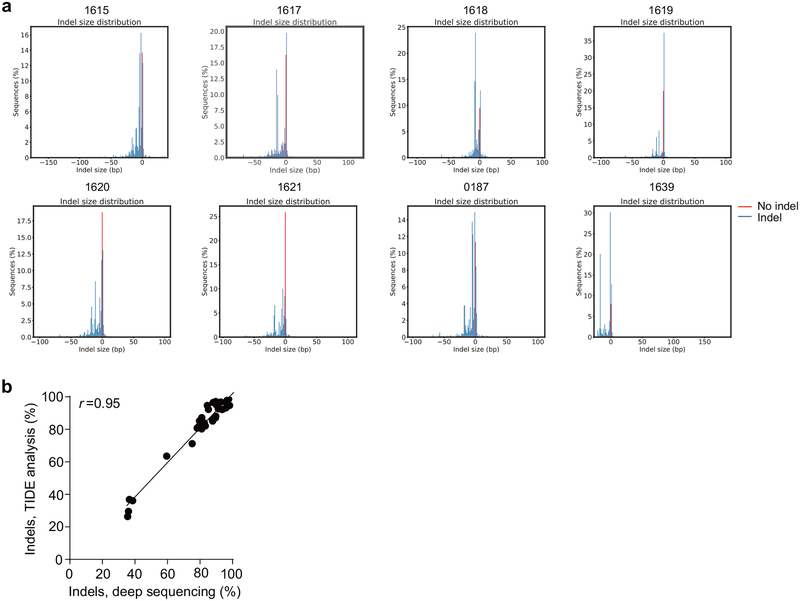
Of 8 MS-sgRNAs targeting the core of the +58 erythroid enhancer of BCL11A in CD34+ HSPCs, editing efficiency ranged from 66.1–90.7% indel frequency (Fig. 1a, b, Extended Data Fig. 2). Editing with sgRNA-1617, which cleaves directly within a GATA1 binding motif10 at the core of the +58 enhancer, gave the highest levels of γ-globin and HbF induction in erythroid progeny (Fig. 1a, c, Extended Data Fig. 1f, h). Editing of the BCL11A enhancer resulted in reduction in BCL11A transcript expression by 54.6% (Extended Data Fig. 1j). We observed a strong correlation between reduction of BCL11A expression and induction of γ-globin and HbF (Fig. 1d, Extended Data Fig. 1j–l). Deep sequencing confirmed the high rate of indels, and showed that the most common mutations were +1 bp insertions, as produced by imprecise nonhomologous-end joining repair (NHEJ), followed by −15 bp and −13 bp deletions, each products of microhomology-mediated end joining (MMEJ) repair (Fig. 1f, Extended Data Fig. 1g, 2). We conducted clonal analysis of the erythroid progeny of CD34+ HSPCs edited at the BCL11A enhancer by sgRNA-1617, assessing genotype, globin gene expression by RT-qPCR, and HbF analysis by HPLC (Extended Data Fig. 1i, 3d, e, Supplementary Table 1). Colonies with biallelic enhancer modifications demonstrated elevated γ-globin mRNA levels (mean 50.8% of total β-like globin, range 35.3–75.1%, as compared to 14.7% in unedited colonies) and elevated HbF protein levels (mean 37.6%, range 27.5–46.9%, as compared to 9.1% in unedited colonies). Single base insertions at the sgRNA-1617 cleavage site were just as effective as longer deletions at increasing HbF levels.
Figure 1 |. Identification of efficient BCL11A enhancer guide RNAs for HbF induction and amelioration of β-thalassemia.
a, Eight modified synthetic (MS) sgRNAs targeting BCL11A enhancer DHS h+58 functional core marked with blue arrows. GATA and Half E-box motifs marked respectively with red or green. b, Editing efficiency of Cas9 coupled with various sgRNAs (each targeting BCL11A enhancer with exception of AAVS1) in CD34+ HSPCs measured by TIDE analysis. c, β-like globin expression by RT-qPCR analysis in erythroid cells in vitro differentiated from RNP edited CD34+ HSPCs. d, Correlation of BCL11A mRNA expression determined by RT-qPCR versus HbF by HPLC. Black dots represent samples edited with Cas9 coupled with different sgRNAs. The Pearson correlation coefficient (r) is shown. e, Editing efficiency as measured by TIDE analysis of Cas9:sgRNA RNP targeting AAVS1 or BCL11A DHS h+58 functional core (Enh) with MS-sgRNA-1617 in CD34+ HSPCs from β-thalassemia patients or healthy donors (βAβA) of indicated β-globin genotypes. f-h, β-like globin expression by RT-qPCR normalized by α-globin (P = 0.00017 for BCL11A enhancer as compared to AAVS1 edited for all comparisons as determined by unpaired two-tailed Student’s t tests), and HbF induction by HPLC analysis in erythroid cells in vitro differentiated. i, Enucleation of in vitro differentiated erythroid cells. j, Cell size measured by relative forward scatter intensity. k, Representative microscopy image showing rounder and more uniform appearance of enucleated erythroid cells following BCL11A enhancer editing. Blue arrow indicates poikilocytes. Bar = 15 μm. l, m, Imaging flow cytometry was used to establish a circularity index (l) and then quantify (m) circularity of enucleated erythroid cells. Bar = 5 μm. In all panels, data are plotted as mean ± SD and analyzed using unpaired two-tailed Student’s t tests. Data are representative of three biologically independent replicates.
To test if this BCL11A enhancer editing approach would result in clinically meaningful γ-globin induction, we edited CD34+ HSPCs from seven patients with β-thalassemia of varying genotypes, including β0β0, β+β0, β+β+, (Aγδβ)0β0 and βEβ0 (Supplementary Table 2). The RNP editing rate with MS-sgRNA-1617 was similar to that from healthy control HSPCs (mean 84.4% indels; range 75.3–92.5%, Fig. 1e). RNP editing of the AAVS1 locus served as a functionally neutral control. In each β-thalassemia donor’s BCL11A enhancer edited cells, we demonstrated potent induction of γ-globin (mean 63.6% relative to α-globin; range 33.0–89.0%; Fig. 1f) and induction of HbF fraction in donors with residual expression of HbA or HbE (Fig. 1g, h). We hypothesized that therapeutically relevant amelioration of globin chain imbalance, the pathophysiologic underpinning of β-thalassemia, would result in improvement of terminal erythroid maturation. We found a higher frequency of enucleation, larger size, and more circular shape of terminal erythroid cells in each of the β-thalassemia samples, but no effect on the healthy donor samples, following BCL11A enhancer editing (Fig. 1i–m).
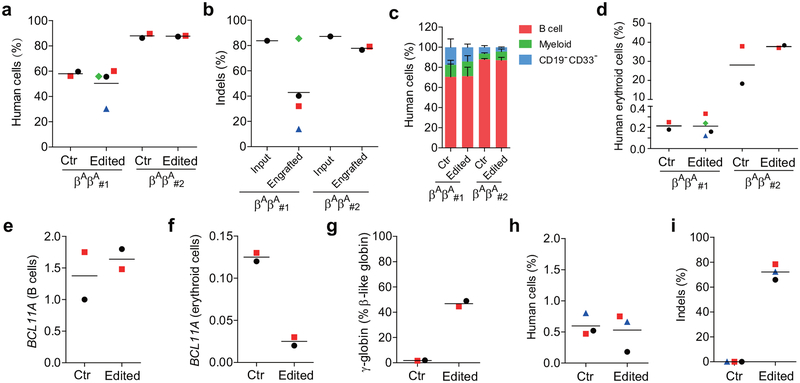
The durability of an autologous hematopoietic cell therapy depends on the ability to permanently modify stem cells. To test the impact of BCL11A enhancer editing on HSCs, we engrafted edited human CD34+ HSPCs into immunodeficient NBSGW mice, since they support not only myeloid and lymphoid but also erythroid engraftment11. Using two separate donors, we found that the recipients of edited and unedited CD34+ HSPCs had similar levels of human lymphoid, myeloid, and erythroid cell engraftment within the bone marrow after 16 weeks (Extended Data Figure 3a, c, d, Supplementary Table 3). We observed variability in the fraction of indels in the engrafting cells from edited mice, ranging from 13.8%−85.5% (Extended Data Figure 3b). Comparing the indel frequencies in the input cells to the engrafting cells we observed a mean reduction of 40.9%. In the engrafting bone marrow cells, we found no reduction in BCL11A transcript levels in edited B-lymphocytes, but 80.0% reduction in edited erythroid cells, consistent with the strict lineage specificity of these enhancer sequences (Extended Data Figure 3e, f). In human erythroid cells from the bone marrow, we observed robust induction of γ-globin, increasing from 1.8% to 46.8% upon editing (Extended Data Figure 3g). Edited bone marrow cells were able to support secondary transplantation to a similar level as unedited cells, while maintaining a mean indel frequency of 72.2%, consistent with gene editing of self-renewing HSCs (Extended Data Figure 3h, i). Long-term engrafting HSCs not bearing biallelic therapeutic edits represent a possible barrier to full therapeutic benefit. In SCD a minority fraction of residual sickle erythrocytes can potentially result in negative rheologic and pathologic consequences12,13. Therefore we investigated methods to maximize editing efficiency in HSCs.
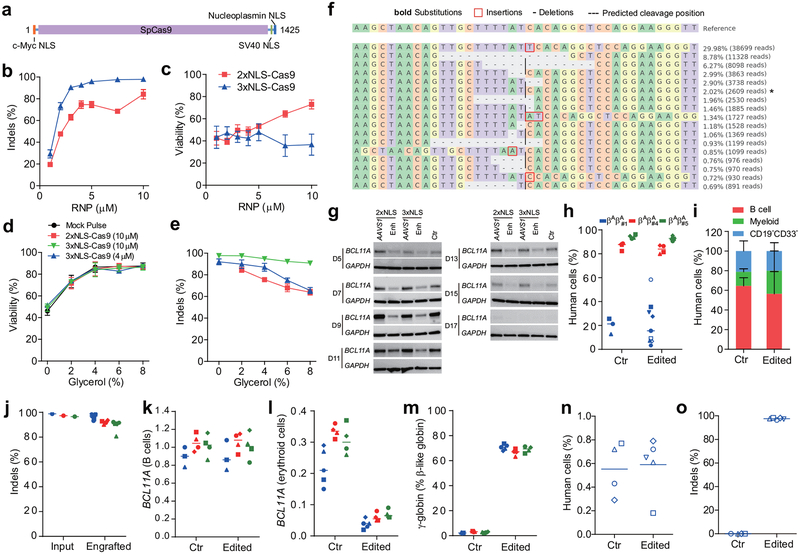
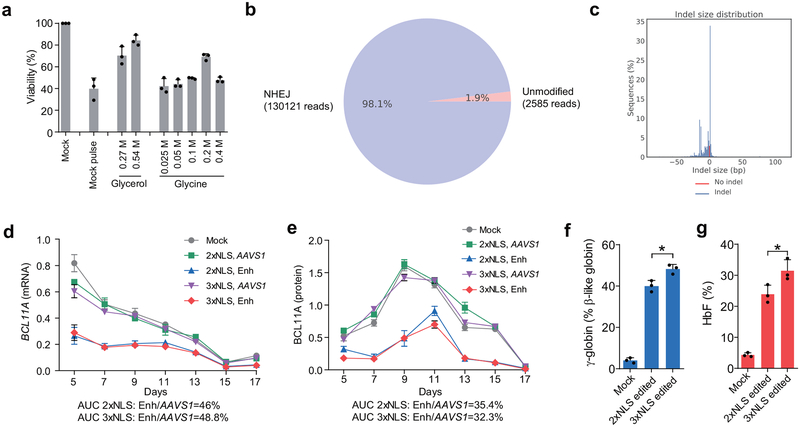
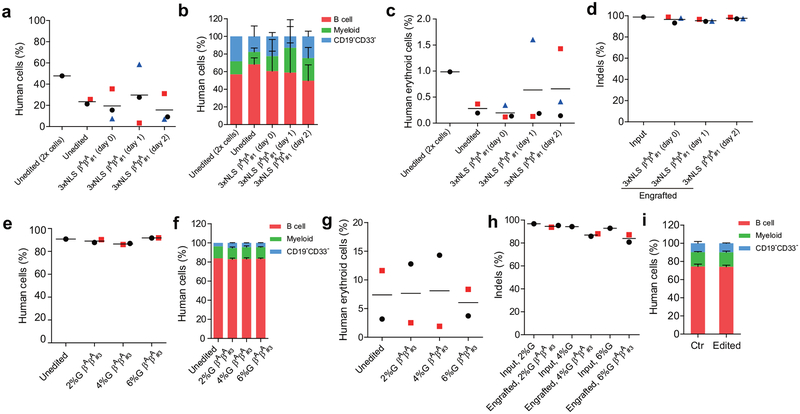
The SpCas9 protein we used in the experiments described above included two SV40 nuclear localization sequences (NLSs) on the C-terminus14 (subsequently called 2xNLS-Cas9). We hypothesized that additional orthogonal nuclear localization sequences could improve genome editing efficiency. We appended a c-Myc-like NLS to the N-terminus and both SV40 and nucleoplasmin NLSs to the C-terminus of SpCas9 (subsequently called 3xNLS-Cas9) (Fig. 2a). We electroporated human CD34+ HSPCs with BCL11A enhancer targeting RNPs at concentrations ranging from 1–10 μM and found increased indel frequencies at all doses with 3xNLS-Cas9 (Fig. 2b). At doses of 5 μM and greater the indel frequency exceeded 95%. The viability of cells electroporated with 3xNLS-Cas9 was inferior compared to those receiving 2xNLS-Cas9. However as the concentration of 2xNLS-Cas9 was reduced, viability approached that of 3xNLS-Cas9 treated cells (Fig. 2c), suggesting that a component of the diluent for 2xNLS-Cas9 might be protective. The 2xNLS-Cas9 stock was dissolved in 10% glycerol, whereas the 3xNLS-Cas9 stock was not dissolved in glycerol. We electroporated cells with 3xNLS-Cas9 with a final glycerol concentration ranging from 0 to 8% and found that additional glycerol protected the cells from loss of viability (Fig. 2d). This protective effect was observed with 2xNLS-Cas9, 3xNLS-Cas9, and without Cas9, indicating that glycerol was protective against electroporation-mediated toxicity independent of genome editing (Fig. 2d). We observed similar protection against electroporation toxicity with glycine, consistent with a possible osmoprotectant effect (Extended Data Fig. 4a). There was a slight decrement of editing with increasing doses of glycerol, suggesting a balance between maximizing cell viability and genome editing efficiency (Fig. 2e). We found that 3xNLS-Cas9 RNP electroporation was able to achieve up to 98.1% indels in CD34+ HSPCs (Fig. 2f, Extended Data Fig. 4b, c). There was a similar distribution of alleles as with 2xNLS-Cas9 editing, with the +1 bp insertion the most frequent indel, followed by the −15 bp and −13 bp deletions. We observed a similar magnitude of decrease in BCL11A mRNA and protein level during in vitro erythroid maturation with 2xNLS-Cas9 or 3xNLS-Cas9 RNP electroporation, although there was a modest increase in both γ-globin and HbF induction with 3xNLS-Cas9 (p < 0.05, Fig. 2g, Extended Data Fig. 4d, e, f, g).
Figure 2 |. Highly efficient BCL11A enhancer editing in HSCs.
a, Schematic of 3xNLS-SpCas9 protein (1425 aa), with a c-Myc-like nuclear localization signal (NLS) at the N-terminus and SV40 and Nucleoplasmin NLSs at the C-terminus. b, Dose-dependent editing of human BCL11A enhancer with 2xNLS-Cas9 or 3xNLS-Cas9 RNP. c, Viability of CD34+ HSPCs after electroporation with 2xNLS-Cas9 and 3xNLS-Cas9. d, Viability of CD34+ HSPCs after electroporation with RNP and glycerol. e, Indel frequencies of CD34+ HSPCs after electroporation with RNP and glycerol. Error bars indicate standard deviation (n = 3 replicates with three independent healthy donors in b-e). f, Summary of most frequent indels by deep sequencing following 3xNLS-Cas9 RNP BCL11A enhancer editing of CD34+ HSPCs. Asterisk indicates unedited allele. g, Western blot analysis showing reduction of BCL11A protein after editing of human BCL11A enhancer with 2xNLS-Cas9 or 3xNLS-Cas9 RNP (MS-sgRNA-AAVS1 or MS-sgRNA-1617) at indicated days of in vitro differentiation. Blots are cropped, BCL11A observed at ~120 kDa, GAPDH at ~37 kDa. h-j, NBSGW mice transplanted with 3xNLS-Cas9 RNP (coupled with MS-sgRNA-1617) edited CD34+ HSPCs from three independent healthy donors (βAβA#1, βAβA#4 and βAβA#5). BM collected 16 weeks after transplantation were analyzed by flow cytometry for human cell chimerism (h), multilineage reconstitution from βAβA#1 (i) in BM, as well as the indel frequencies determined by TIDE analysis (j). k-m, RT-qPCR analysis of BCL11A expression in sorted human B cells (k) or human erythroid cells (l) and β-like globin expression in sorted human erythroid cells (m) from NBSGW mice transplanted with 3xNLS RNP edited CD34+ HSPCs. n, BM from one mouse each engrafted with unedited control or edited cells (βAβA#1) were transplanted to secondary NBSGW mice and BM was analyzed for human cell chimerism after 16 weeks. o, Indel frequencies within human BCL11A enhancer in BM 16 weeks after secondary transplantation. Median of each group with 3 to 9 mice in h, j-o is shown as line. Data are plotted as mean ± SD for (b-e, i) and analyzed using unpaired two-tailed Student’s t tests. Data are representative of three biologically independent replicates.
We hypothesized that maximizing genome editing efficiency might increase the fraction of indels in engrafting edited HSCs and enhance HbF induction in erythroid progeny. RNP electroporation with 3xNLS-Cas9 and BCL11A enhancer MS-sgRNA-1617 resulted in similar human marrow engraftment after 16 weeks with edited and unedited CD34+ HSPCs, with a dose-dependent relationship between cell infusion dose and human cell engraftment (Fig. 2h, Extended Data Figure 8b). We observed no difference in human engraftment if cells were infused 0, 1, or 2 days following electroporation (Extended Data Fig. 6a). Edited cells showed similar capacity for lymphoid, myeloid, and erythroid engraftment (Fig. 2i, Extended Data Fig. 5b, c). Engrafting human cells maintained 96.5% indels, similar to the 98.1% indels observed in the input cells (Fig. 2j, Extended Data Fig. 5d). In the bone marrow, BCL11A expression was preserved in edited B-lymphocytes but reduced by 82.7% in edited erythroid cells (Fig. 2k, l). γ-globin was elevated from 2.2% to 70.8% total β-like globin in edited human erythroid cells (Fig. 2m, Extended Data Fig. 5c). Transplant of CD34+ HSPCs electroporated with 3xNLS-Cas9 and MS-sgRNA-1617 and supplemented with 2%, 4% or 6% glycerol also yielded potent human engraftment while maintaining high indel frequencies in the repopulating cells (Extended Data Fig. 5e–h). The 3xNLS-Cas9 edited bone marrow cells were also able to support secondary transplantation to a similar level as unedited cells, while maintaining a mean indel frequency of 96.5%, consistent with gene editing of self-renewing HSCs (Fig. 2n, o, Extended Data Fig. 9d, e). The high efficiency of therapeutic editing within engrafting hematopoietic cells was consistently observed using HSPCs from four different healthy donors (Fig. 2h–o, Extended Data Fig. 5).
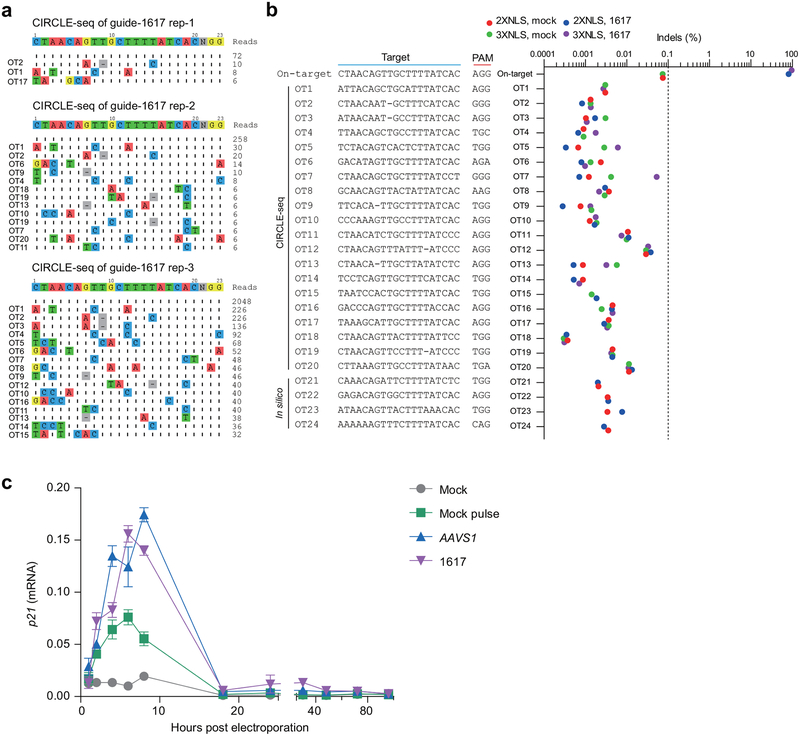
To test the specificity of the RNP sgRNA-1617, we performed CIRCLE-seq, a method to define genome-wide target sequences susceptible to RNP cleavage in vitro15, identifying 20 potential off-target sites (Extended Data Fig. 6a, Supplementary Table 4). Amplicon deep sequencing of each of these 20 off-target sites from CD34+ HSPCs edited with both 2xNLS-Cas9 and 3xNLS-Cas9 did not identify any off-target sites at which we observed Cas9-dependent indels, at the limit of detection of 0.1% allele frequency (Extended Data Fig. 6b). From the same edited gDNA, we observed 81.0–95.5% on-target indels at the BCL11A enhancer. In addition, we tested by amplicon deep sequencing four additional in silico predicted off-target sites not identified by CIRCLE-seq (Supplementary Table 5) and did not detect indels (Extended Data Fig. 6b). Recent studies have emphasized that p53 is induced following programmable nuclease mediated DNA cleavage16,17. Consistent with intact DNA damage response, we observed transient induction of P21 transcript following Cas9:sgRNA RNP electroporation to CD34+ HSPCs, with peak levels between 4 and 8 hours after electroporation (Extended Data Fig. 6c). Since we did not observe a difference in human chimerism in xenotransplant recipients, it appeared unlikely that this DNA damage response had a major impact on HSPC engraftment potential. In pluripotent stem cells, clones with P53 mutation or inhibition have been reported to have a selective advantage following gene editing17. We performed targeted deep sequencing of edited CD34+ HSPCs using a clinically approved 95-gene sequencing panel designed to identify recurrent somatically acquired hematologic malignancy associated mutations, including TP53 among loci tested18. We did not observe variant alleles at TP53 or any other of the hematologic malignancy associated loci in the edited HSPCs (Supplementary Table 6). Together these data indicate an absence of detectable genotoxicity.
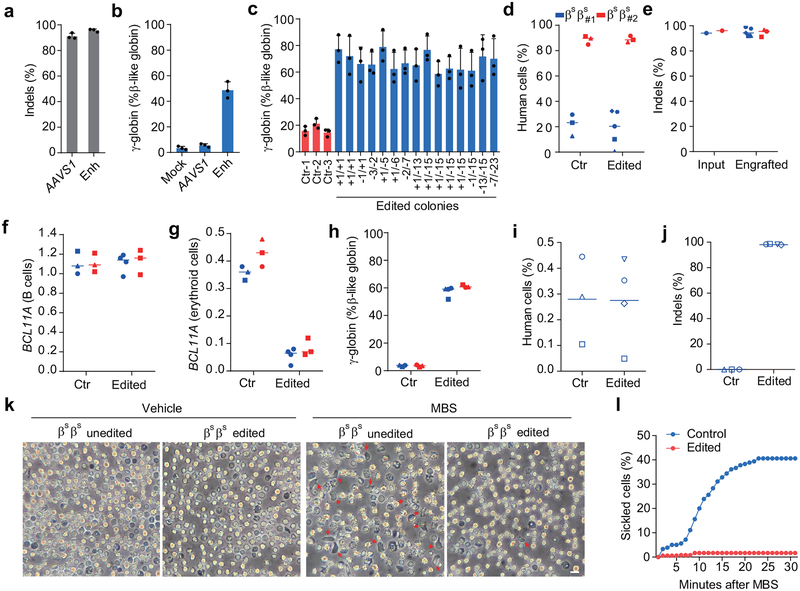
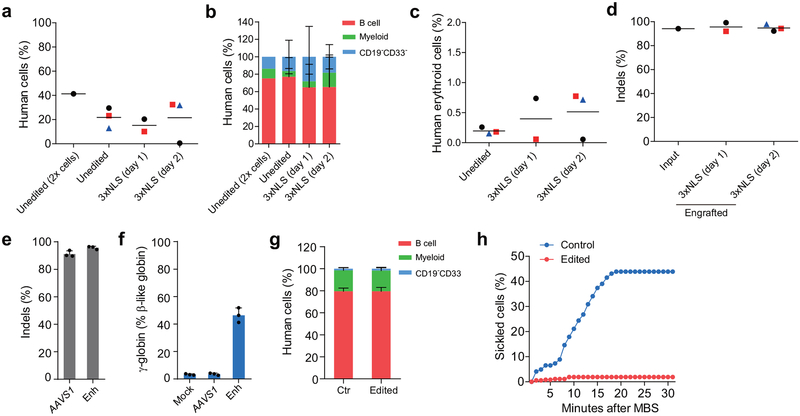
To determine if this optimized BCL11A enhancer editing strategy could be effective in SCD, we obtained plerixafor-mobilized peripheral blood CD34+ HSPCs from two patients19–21. We demonstrated 94.2%−95.7% indels at the BCL11A enhancer following RNP electroporation of CD34+ HSPCs (Fig. 3a, Extended Data Fig. 7e). In vitro erythroid differentiated progeny showed 47.6% γ-globin in edited cells as compared to 4.5% in unedited cells (Fig. 3b). Clonal analysis demonstrated that biallelic indels of the BCL11A enhancer, as short as 1 bp in length, resulted in robust induction of γ-globin, consistent with healthy donor results (total of 63 colonies analyzed from 4 donors, Fig. 3c, Supplementary Table 1, Extended Data Fig. 1i, 3d, 3e). We observed similar human lymphoid, myeloid, and erythroid engraftment of edited and unedited SCD HSPCs (Fig. 3d, Extended Data Fig. 7b, c, g). There were similar results when edited cells were infused 1 or 2 days following editing (Extended Data Fig. 7a–d). Edited cells showed 96.7% indels after 16 weeks of bone marrow engraftment as compared to 95.0% indels in input HSPCs (Fig. 3e). BCL11A expression in erythroid cells was reduced by 83.1% while it was preserved in B-lymphocytes (Fig. 3f, g). Edited bone marrow human erythroid cells expressed 59.0% γ-globin as compared to 3.5% in unedited cells (Fig. 3h). The edited bone marrow SCD cells were able to support secondary transplantation to a similar level as unedited SCD cells, while maintaining a mean indel frequency of 98.1%, consistent with gene editing of self-renewing HSCs (Fig. 3i, j). CD34+ HSPCs were collected from the bone marrow of mice engrafted by SCD and healthy donor cells and subject to in vitro erythroid differentiation. In all cases of BCL11A enhancer editing, HbF levels were elevated (Extended Data Fig. 8d). In healthy donor cells, HbF levels rose from 4.1% in unedited to 35.9% in 3xNLS-Cas9 RNP edited cells, and in SCD patient cells, HbF levels rose from 13.9% to 47.5%. While unedited SCD enucleated erythroid cells derived from engrafting HSCs demonstrated robust in vitro sickling following sodium metabisulfite (MBS) treatment, edited SCD cells were resistant to sickling (Fig. 3k, l, Extended Data Fig. 7h, Supplementary Video 1, 2).
Figure 3 |. Editing BCL11A enhancer in SCD patient HSCs prevents sickling.
a, Editing efficiency of 3xNLS-Cas9 coupled with MS-sgRNA-AAVS1 for control and −1617 for BCL11A enhancer editing in βSβS CD34+ HSPCs as measured by TIDE analysis. b, β-like globin expression in erythroid cells in vitro differentiated. Error bars indicate standard deviation (n = 3 replicates). c, Genotyping and β-like globin expression analysis of erythroid cells derived from single colonies derived from unedited (ctr) or edited βSβS CD34+ HSPCs. Error bars indicate standard deviation (n = 3 technical replicates per colony). d, e, NBSGW mice were transplanted with 3xNLS-Cas9 RNP (coupled with MS-sgRNA-1617) edited βSβS CD34+ HSPCs from two independent donors (βSβS#1 and βSβS#2). BM were collected 16 weeks after transplantation and analyzed for human cell chimerism (d) in BM, as well as the indel frequencies determined by TIDE analysis (e). f-h, RT-qPCR analysis of BCL11A expression in sorted human B cells (f) or human erythroid cells (g) and β-like globin expression in human erythroid cells sorted from BM (h). i, BM from one mouse each engrafted with unedited control or edited cells (βSβS#1) from control mouse shown with black circle and edited mouse with blue triangle symbols in (d, e)) were transplanted to four secondary NBSGW mice. After 16 weeks, BM was analyzed for human cell chimerism by flow cytometry. j, Indel frequencies within human BCL11A enhancer in BM 16 weeks after secondary transplantation. Median of each group with 3 to 4 mice in d-j is shown as line. k, Phase-contrast microscopy imaging of enucleated erythroid cells in vitro differentiated from BM of NBSGW mice transplanted with unedited or BCL11A enhancer edited βSβS#1 CD34+ HSPCs with and without sodium metabisulfite (MBS) treatment. Cells with sickled cell morphology are indicated with red arrows. Bar = 10 μm. l, Analysis of in vitro sickling. Images were taken every 1 minute after MBS treatment. Result shown as percent sickled cells at each time point. Data are plotted as mean ± SD for (a-c) and analyzed using unpaired two-tailed Student’s t tests. Data are representative of three biologically independent replicates.
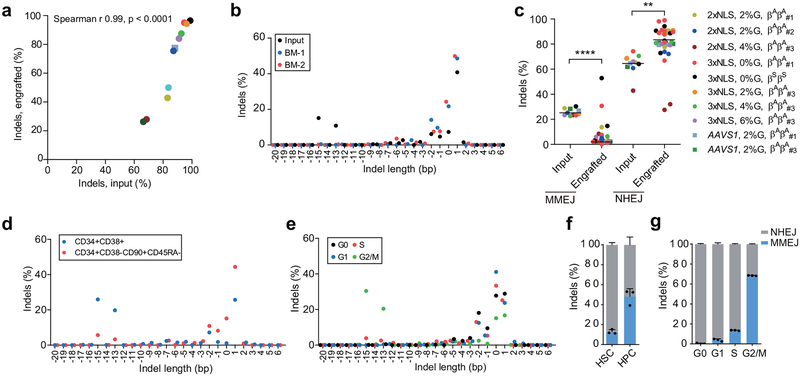
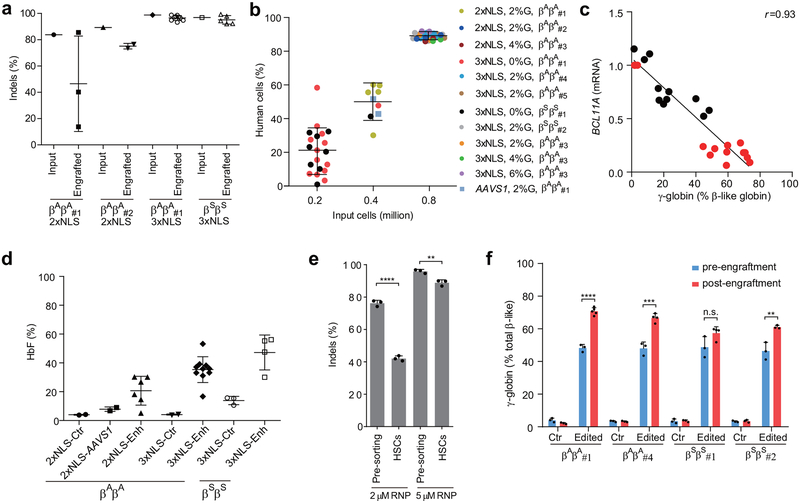
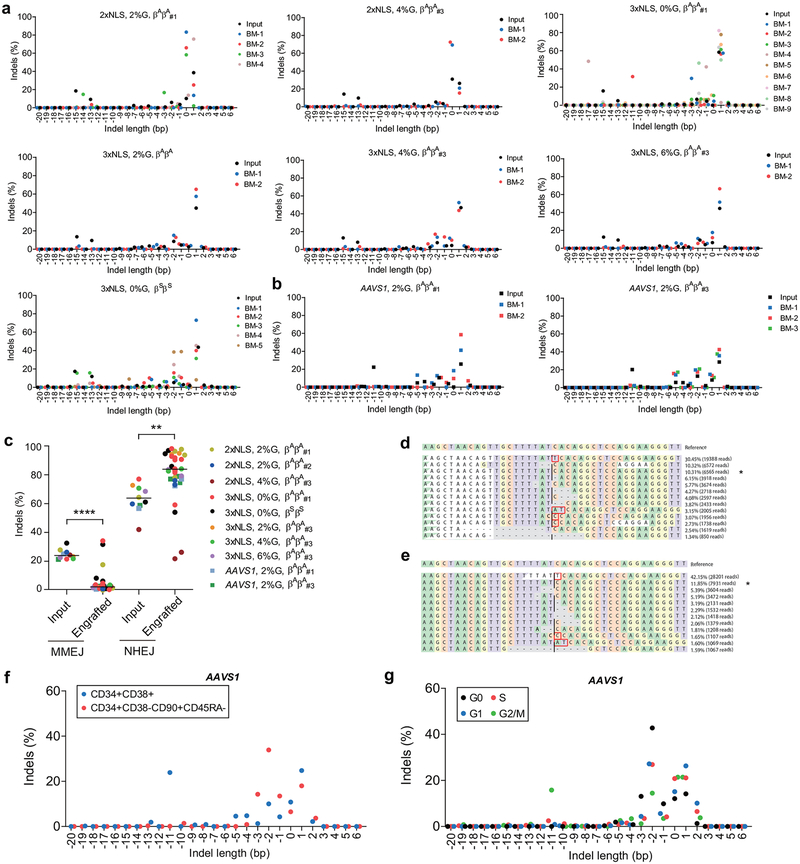
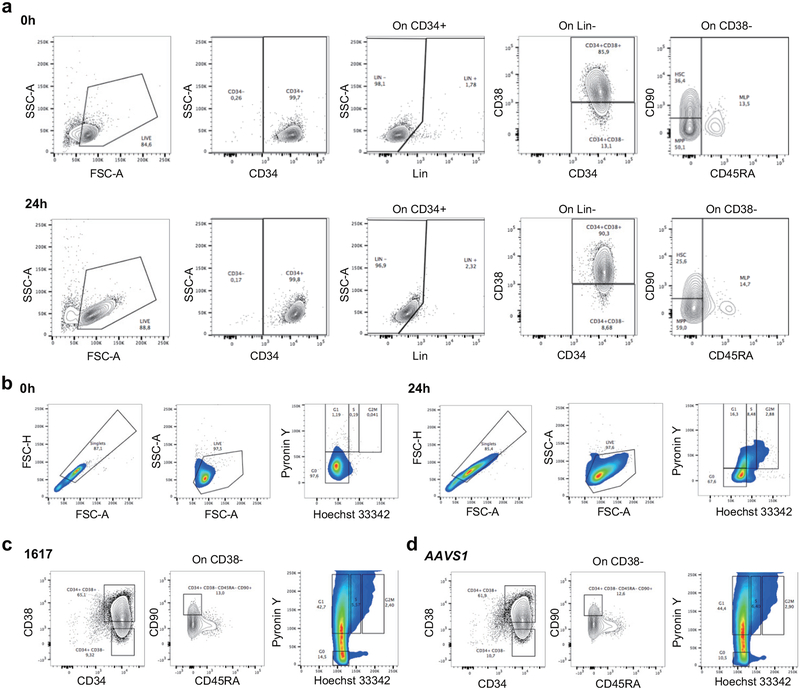
Erythroid cells differentiated in vitro from the bone marrow of mice engrafted with 3xNLS-Cas9 edited cells showed more potent induction of HbF compared to 2xNLS-Cas9 edited cells, consistent with greater persistence of edited alleles in repopulating HSCs (Extended Data Fig. 8a, d). Comparing all of the transplant results, there was a strong correlation (Spearman r = 0.99, p < 0.0001) between indel frequencies in input HSPCs as compared to human cells engrafting the bone marrow after 16 weeks (Fig. 4a). With reduced RNP concentration, we observed disproportionate loss of indels from an HSC-enriched immunophenotype population as compared to bulk HSPCs (Extended Data Fig. 8e). We found that the indel spectrum in repopulating cells was different than in input HSPCs (Fig. 4b, Extended Data Fig. 9a, b). For example, in HSPCs edited with 2xNLS-Cas9 with 2% glycerol the second and third most common deletions were 15 bp and 13 bp deletions, comprising together 25.9% of alleles (Fig. 4b). These deletions were nearly absent in the engrafted cells, comprising together 1.0% of alleles. The 15-bp and 13-bp deletions were both predicted products of MMEJ repair22 (Supplementary Table 7). These results suggested that NHEJ may be favored relative to MMEJ repair in the long-term repopulating HSC population relative to the bulk HSPC population. We classified each of the repair alleles, at BCL11A and AAVS1, as originating from NHEJ or MMEJ and compared their abundance in input HSPCs used for transplantation or in the engrafted cells resulting from these transplants. Together these data comprised 10 independent transplants conducted with 33 recipient mice across BCL11A and AAVS1. We observed a significant decrease in the fraction of edited alleles repaired by MMEJ (median 25.2% versus 3.4%, p<0.0001) and a concomitant increase in the fraction of edited alleles repaired by NHEJ (median 64.5% versus 81.0%, p<0.005) in engrafted human cells as compared to input HSPCs (Fig. 4c, Extended Data Fig. 9c). Since we observed similar results targeting BCL11A and AAVS1, it appeared unlikely there was locus-specific selection against MMEJ edited repopulating cells. We speculated that quiescent HSCs would be relatively refractory to MMEJ repair, predominantly found in S and G2 phases of the cell cycle23,24. Comparing CD34+ HSPCs immediately after thawing and following 24 hours in culture, we observed similar HSC immunophenotype by CD34, CD38, CD90, and CD45RA markers, increase of cell size and shift from predominantly G0 to active cycling (Extended Data Figure 10). After 24 hours of prestimulation culture, we performed RNP electroporation and then 2 hours later sorted HSPCs into an enriched population of HSCs (CD34+ CD38- CD90+ CD45RA-) as compared to committed progenitors (CD34+ CD38+) or based on G0, G1, S, and G2/M phase gates. Following an additional four days in culture, we determined the indel spectrum by sequence analysis. We observed depletion of the MMEJ alleles and enrichment of NHEJ alleles from the HSC as compared to committed progenitor population for both BCL11A enhancer and AAVS1 edited cells (Fig. 4d, f, Extended Data Fig. 9f). We found near complete absence of MMEJ alleles from G0 and G1 phase HSPCs and enrichment in G2/M phase HSPCs after BCL11A enhancer or AAVS1 editing (Fig. 4e, g, Extended Data Fig. 9g). These data suggest that quiescent and engrafting HSCs appear to favor NHEJ as compared to MMEJ repair23–25.
Figure 4 |. Persistence of NHEJ repaired alleles in HSCs.
a), Correlation of indel frequencies of input HSPCs to indel frequencies of engrafted human cells in mice BM after 16 weeks. Each dot represents average indel frequencies of mice transplanted with the same input HSPCs. Legend denoting transplant is same as in (c). The Pearson correlation coefficient (r) is shown. b, Indel spectrum of input cells from healthy donor βAβA#2 electroporated with 2xNLS-Cas9 (coupled with sgRNA-1617) supplemented with 2% glycerol and engrafted 16 week BM human cells. c, Relative loss of edited alleles repaired by MMEJ and gain of edited alleles repaired by NHEJ in mice BM 16 weeks after transplant. The indel spectrum was determined by deep sequencing analysis. Indel length from −8 to +6 bp was calculated as NHEJ, and from −9 to −20 bp as MMEJ. These data comprise 28 mice transplanted with 8 BCL11A enhancer edited inputs and 5 mice transplanted with 2 AAVS1 edited inputs. Median of each group is shown as line, **P < 0.005, ****P < 0.0001 as determined by Kolmogorov–Smirnov test. d-e, Indel spectra of HSPCs stained and sorted 2h after RNP electroporation with 3xNLS-Cas9 with sgRNA-1617. HSPCs prestimulated for 24h prior to electroporation. HSPCs stained with CD34, CD38, CD90, CD45RA in (d) and with Pyronin Y, Hoechst 33342 in (e). Indels determined by Sanger sequencing with TIDE analysis after culturing cells for 4 days after sort. Relative loss of edited alleles repaired by MMEJ and gain of edited alleles repaired by NHEJ at BCL11A enhancer and AAVS1 in sorted enriched HSCs (f) or G0 phase cells (g) shown. Data are plotted as mean ± SD for (f, g) and analyzed using unpaired two-tailed Student’s t tests. Data are representative of three biologically independent replicates.
Previous experiments of genome editing in human HSPCs have shown variability in editing efficiency, specificity, and persistence in long-term engrafting HSCs (see Supplementary Table 8)6,26–34. Most prior studies have shown some reduction in indel frequency in engrafting cells as compared to input HSPCs (Supplementary Table 8). The durability of therapeutic genome edits in the context of human hematopoietic autotransplant remains uncertain.
Here we address this concern by introducing therapeutic edits as a nearly complete reaction in long-term engrafting HSCs. We developed an optimized protocol for selection-free, HSC expansion-free BCL11A enhancer editing using modified synthetic sgRNA, SpCas9 protein with an additional NLS, and reformulated electroporation buffer in which we achieve ~95% therapeutic edits in healthy donor and patient-derived engrafting cells without detectable genotoxicity. Even 1 bp indels following cleavage at core sequences within the BCL11A erythroid enhancer disrupt the GATA1 binding motif and are sufficient for robust HbF induction. Although we did not specifically investigate on-target large deletions following Cas9 cleavage35, we have previously observed kilobase scale deletions at the intronic BCL11A erythroid enhancer to result in erythroid-restricted loss of BCL11A expression2–4.
Alternative plausible strategies for genome editing to ameliorate the β-hemoglobinopathies include targeting the β-globin cluster for gene repair or to mimic hereditary persistence of fetal hemoglobin alleles26,27,30,36–39. The efficiency of these homology and microhomology based maneuvers in HSCs in the absence of selection or HSC expansion remains to be determined, and in the case of gene repair the clinically relevant delivery of an extrachromosomal donor sequence presents an additional challenge. Ex vivo BCL11A enhancer editing approaching complete allelic disruption appears to be a realistic and scalable strategy with existing technology for durable HbF induction for the β-hemoglobinopathies. Emulating this efficiency could contribute to the success of industry-sponsored clinical trials of BCL11A enhancer editing using ZFNs (NCT03432364) and Cas9 (NCT03655678). Highly efficient HSC editing could be adapted for biological investigation and genetic amelioration of additional blood disorders40.
Methods and reproducibility
Cell culture
Human CD34+ HSPCs from mobilized peripheral blood of deidentified healthy donors were obtained from Fred Hutchinson Cancer Research Center, Seattle, Washington. Sickle cell disease patient and β-thalassemia patient CD34+ HSPCs were isolated from plerixafor mobilized (for sickle cell disease, IRB P00023325, FDA IND 131740) or unmobilized (for β-thalassemia) peripheral blood following Boston Children’s Hospital institutional review board approval and patient informed consent. CD34+ HSPCs were enriched using the Miltenyi CD34 Microbead kit (Miltenyi Biotec). CD34+ HSPCs were thawed on day 0 into X-VIVO 15 (Lonza, 04–418Q) supplemented with 100 ng ml−1 human SCF, 100 ng ml−1 human thrombopoietin (TPO) and 100 ng ml−1 recombinant human Flt3-ligand (Flt3-L). HSPCs were electroporated with Cas9 RNP 24 h after thawing and maintained in X-VIVO media with cytokines. For in vitro erythroid maturation experiments, 24 h after electroporation, HSPCs were transferred into erythroid differentiation medium (EDM) consisting of IMDM supplemented with 330 μg ml- holo-human transferrin, 10 μg ml- recombinant human insulin, 2 IU ml- heparin, 5% human solvent detergent pooled plasma AB, 3 IU ml− erythropoietin, 1% L-glutamine, and 1% penicillin/streptomycin. During days 0–7 of culture, EDM was further supplemented with 10−6 M hydrocortisone (Sigma), 100 ng ml−1 human SCF, and 5 ng ml−1 human IL-3 (R&D) as EDM-1. During days 7–11 of culture, EDM was supplemented with 100 ng ml−1 human SCF only as EDM-2. During days 11–18 of culture, EDM had no additional supplements as EDM-3. Enucleation percentage and γ-globin induction were assessed on day 18 of erythroid culture.
In vitro transcription of sgRNAs
Firstly, sgRNAs with T7 promoter were amplified by PCR from pX458 plasmid with specific primers (Supplementary Table 9) and in vitro transcribed using MEGAshortscript T7 kit (Life Technologies). After transcription, the sgRNAs were purified with MEGAclear kit (Life Technologies) according to manufacturer’s instructions.
RNP electroporation
Electroporation was performed using Lonza 4D Nucleofector (V4XP-3032 for 20 μl Nucleocuvette Strips or V4XP-3024 for 100 μl Nucleocuvettes) as the manufacturer’s instructions. 2xNLS-Cas9 was obtained from QB3 MacroLab of University of California, Berkeley. The modified synthetic sgRNA (2’-O-methyl 3’ phosphorothioate modifications in the first and last 3 nucleotides) was from Synthego. sgRNA concentration is calculated using the full-length product reporting method, which is 3-fold lower than the OD reporting method. CD34+ HSPCs were thawed 24 h before electroporation. For 20 μl Nucleocuvette Strips, the RNP complex was prepared by mixing Cas9 (200 pmol) and sgRNA (200 pmol, full-length product reporting method) and incubating for 15 min at room temperature immediately before electroporation. For indicated experiments in which glycerol was supplemented, 30% glycerol solution was added to Cas9 protein prior to addition of sgRNA. 50 K HSPCs resuspended in 20 μl P3 solution were mixed with RNP and transferred to a cuvette for electroporation with program EO-100. For 100 μl cuvette electroporation, the RNP complex was made by mixing 1000 pmol Cas9 and 1000 pmol sgRNA. 5M HSPCs were resuspended in 100 μl P3 solution for RNP electroporation as described above. The electroporated cells were resuspended with X-VIVO media with cytokines and changed into EDM 24 h later for in vitro differentiation. For mouse transplantation experiments, cells were maintained in X-VIVO 15 with SCF, TPO, and Flt3-L for 0–2 days as indicated prior to infusion.
Measurement of cell viability and indel frequencies
For the viability analysis, cell numbers were counted 48 h after electroporation, the viability was calculated as the cell number ratio of electroporated cells to mock control without electroporation. Indel frequencies were measured with cells cultured in EDM 5 days after electroporation. Briefly, genomic DNA was extracted using the Qiagen Blood and Tissue kit. BCL11A enhancer DHS h+58 functional core was amplified with KOD Hot Start DNA Polymerase and corresponding primers (Supplementary Table 9) using the following cycling conditions: 95 degrees for 3 min; 35 cycles of 95 degrees for 20 s, 60 degrees for 10 s, and 70 degrees for 10 s; 70 degrees for 5 min. Resulting PCR products were subjected to Sanger sequencing. Sequencing traces were imported to TIDE software for indel frequency measurement with 40 bp decomposition window.
RT-qPCR quantification of γ-globin induction and p21 expression
RNA isolation with RNeasy columns (Qiagen, 74106), reverse transcription with iScript cDNA synthesis kit (Bio-Rad, 170–8890), RT–qPCR with iQ SYBR Green Supermix (Bio-Rad, 170–8880) was subject to determine γ-globin induction using primers amplifying HBG1/2, HBB or HBA1/2 cDNA (Supplementary Table 9). For quantification of p21 mRNA, HSPCs were electroporated 24 hours post thawing, then were cultured in X-VIVO 15 medium plus cytokines as described above and harvested at different time point post editing.
Hemoglobin HPLC
Hemolysates were prepared from erythroid cells after 18 days of differentiation using Hemolysate reagent (5125, Helena Laboratories) and analyzed with D-10 Hemoglobin Analyzer (Bio-Rad) or high-performance liquid chromatography (HPLC) in the clinical laboratory of the Brigham and Women’s Hospital using clinically calibrated standards for the human hemoglobins.
Determination of BCL11A mRNA and protein level
Cells was directly lysed into the RLT plus buffer (Qiagen) for total RNA extraction according to manufacturer’s instructions provided in the RNeasy Plus Mini Kit. BCL11A mRNA expression was determined by primers amplifying BCL11A or CAT as internal control (Supplementary Table 9). We used CAT as a reference transcript since it is both highly expressed and stable throughout erythroid maturation40. All gene expression data represent the mean of at least three technical replicates. For in vitro differentiation, BCL11A mRNA level was measured on day 11 unless otherwise indicated. BCL11A protein level was measured by western blot analysis as described previously41 with following antibodies: BCL11A (Abcam, ab19487), GAPDH (Cell Signaling, 5174S). The western blot results were quantified with ImageJ software.
Clonal culture of CD34+ HSPCs
Edited CD34+ HSPCs were sorted into 150 μl EDM-1 in 96-well round bottom plates (Nunc) at one cell per well using FACSAria II. The cells were changed into EDM-2 media 7 days later in 96-well flat bottom plates (Nunc). After additional 4 days of culture, 1/10 of cells in each well was harvested for genotyping analysis, the remaining cells were changed into 150 μl-500 μl EDM-3 at 1M ml−1 for further differentiation. After additional 7 days of culture, 1/10 of the cells were stained with Hoechst 33342 for enucleation analysis, the remaining cells were harvested with sufficient material for RNA isolation with RNeasy Micro Kit (74004, Qiagen) and RT-qPCR in technical triplicate or a single hemoglobin HPLC measurement per colony.
In vitro sickling and microscopy analysis
In vitro differentiated erythroid cells were stained with 2 μg ml−1 of the cell-permeable DNA dye Hoechst 33342 (Life Technologies) and the enucleated cells which are negative for Hoechst 33342 were FACS sorted and subjected to in vitro sickling assay. Sickling was induced by adding 500 μl freshly prepared 2% sodium metabisulfite (MBS) solution prepared in PBS into enucleated cells resuspended with 500 μl EDM-3 in 24-well plate, followed by incubation at room temperature. Live cell images were acquired using a Nikon Eclipse Ti inverted microscope. Image acquisition was performed at room temperature and air in 24-well plate. Timelapse images were recorded for 30 min with 10 seconds of intervals per sample.
Human CD34+ HSPC transplant and flow cytometry analysis
All animal experiments were approved by the Boston Children’s Hospital Institutional Animal Care and Use Committee. CD34+ HSPCs were obtained from deidentified healthy donors or from β-hemoglobinopathy patients under protocols approved by the institutional review board of Boston Children’s Hospital, with the informed consent of all participants, and complying with relevant ethical regulations. NOD.Cg-KitW−41J Tyr + Prkdcscid Il2rgtm1Wjl (NBSGW) mice were obtained from Jackson Laboratory (Stock 026622). Non-irradiated NBSGW female mice (4–5 weeks of age) were infused by retro-orbital injection with 0.2–0.8M CD34+ HSPCs (resuspended in 200 μl DPBS) derived from healthy donors or SCD patients. Equal numbers of pre-electroporation CD34+ HSPCs were used for experiments comparing in vitro culture for 0, 1, or 2 days following electroporation. Bone marrow was isolated for human xenograft analysis 16 weeks post engraftment. Serial transplants were conducted using retro-orbital injection of bone marrow cells from the primary recipients. For flow cytometry analysis of bone marrow, BM cells were first incubated with Human TruStain FcX (422302, BioLegend) and TruStain fcX ((anti-mouse CD16/32, 101320, BioLegend) blocking antibodies for 10 min, followed by the incubation with V450 Mouse Anti-Human CD45 Clone HI30 (560367, BD Biosciences), PE-eFluor 610 mCD45 Monoclonal Antibody (30-F11) (61-0451-82, Thermo Fisher), FITC anti-human CD235a Antibody (349104, BioLegend), PE anti-human CD33 Antibody (366608, BioLegend), APC anti-human CD19 Antibody (302212, BioLegend) and Fixable Viability Dye eFluor 780 for live/dead staining (65-0865-14, Thermo Fisher). Percentage human engraftment was calculated as hCD45+ cells/(hCD45+ cells + mCD45+ cells) × 100. B cells (CD19+) and myeloid (CD33+) lineages were gated on the hCD45+ population. Human erythroid cells (CD235a+) were gated on mCD45−hCD45− population. For the staining with immunophenotype markers of HSCs, CD34+ HSPCs were incubated with Pacific Blue anti-human CD34 Antibody (343512, Biolegend), PE/Cy5 anti-human CD38 (303508, Biolegend), APC anti-human CD90 (328114, Biolegend), APC-H7 Mouse Anti-Human CD45RA (560674, BD Bioscience) and Brilliant Violet 510 anti-human Lineage Cocktail (348807, Biolegend). Cell cycle phase in live CD34+ HSPCs was detected by flow cytometry as described previously42. Cells were resuspended in pre-warmed HSPC medium. First, we added Hoechst 33342 to a final concentration of 10 μg/ml and incubated at 37 degrees for 15 min. Then we added Pyronin Y directly to cells at a final concentration of 3 μg/ml and incubated at 37 degrees for 15 min. After washing with PBS, we performed flow cytometric analysis or cell sorting. Cell sorting was performed on a FACSAria II machine (BD Biosciences).
Amplicon deep sequencing
For indel frequencies or off-target analysis with deep sequencing, BCL11A enhancer loci or potential off-target loci were amplified with corresponding primers firstly (Supplementary Table 9). After another round of PCR with primers containing sample-specific barcodes and adaptor, amplicons were sequenced for 2×150 paired-end reads with MiSeq Sequencing System (Illumina). The deep sequencing data was analyzed by CRISPResso software43. In particular, we used a minimum alignment identity of 75%, window size of 2 bp around the cleavage site to quantify indels, an average PHRED quality score of 30 and excluded substitutions to limit potential false positives. For OT10, in which the amplicon includes homologous genomic sequences, we used a minimum alignment identity of 90%.
Flow cytometry for F-cell, enucleation and cell size analysis
Intracellular staining was performed as described previously. Cells were fixed with 0.05% glutaraldehyde (Sigma) for 10 min at room temperature and then permeabilized with 0.1% Triton X-100 (Life Technologies) for 5 min at room temperature. Cells were stained with anti-human antibodies for HbF (clone HbF-1 with FITC; Life Technologies) for 30 min in the dark. Cells were washed to remove unbound antibody before FACS analysis. Control cells without staining were used as negative control. For the enucleation analysis, cells were stained with 2 μg ml−1 of the cell-permeable DNA dye Hoechst 33342 (Life Technologies) for 10 min at 37 °C. The Hoechst 33342 negative cells were further gated for cell size analysis with Forward Scatter (FSC) A parameter. Median value of forward scatter intensity normalized by data from healthy donors collected at the same time was used to characterize the cell size.
ImageStream analysis
In vitro differentiated D18 erythroid cells stained with Hoechst 33342 were resuspended with 150 μl DPBS for analysis with Imagestream X Mark II (Merck Millipore). Well-focused Hoechst negative single cells were gated for circularity analysis with IDEAS software. Cells with circularity score above 15 were further gated to exclude cell debris and aggregates. No fewer than 2000 gated cells were analyzed to obtain a median circularity score.
Preparation of 3xNLS-SpCas9
The plasmid expressing 3xNLS-SpCas9 was constructed in the pET21a expression plasmid (Novagen) and is available on Addgene (ID #114365). The recombinant S. pyogenes Cas9 with a 6xHis tag and c-Myc-like nuclear localization signal (NLS) at the N-terminus44, SV40 and nucleoplasmin NLS at the C-terminus was expressed in E. coli Rosetta (DE3)pLysS cells (EMD Millipore). Cells were grown at 37 degrees to an OD600 of ~0.2, then shifted to 18 degrees and induced at an OD600 of ~0.4 for 16 hours with IPTG (1 mM final concentration). Following induction, cells were resuspended with Nickel-NTA buffer (20 mM TRIS + 500 mM NaCl + 20 mM imidazole + 1 mM TCEP, pH 8.0) supplemented with HALT protease inhibitor and lysed with M-110s Microfluidizer (Microfluidics) following the manufacturer’s instructions. The protein was purified with Ni-NTA resin and eluted with elution buffer (20 mM TRIS, 250 mM NaCl, 250 mM Imidazole, 10% glycerol, pH 8.0). Subsequently, 3xNLS-SpCas9 protein was further purified by cation exchange chromatography (Column = 5 ml HiTrap-S, Buffer A = 20 mM HEPES pH 7.5 + 1 mM TCEP, Buffer B = 20 mM HEPES pH 7.5 + 1 M NaCl + 1 mM TCEP, Flow rate = 5 ml/min, CV = column volume = 5 ml) and size-exclusion chromatography (SEC) on Hiload 16/600 Superdex 200 pg column (Isocratic size-exclusion running buffer = 20 mM HEPES pH 7.5, 150 mM NaCl, 1 mM TCEP), then reconstituted in a formulation of 20 mM HEPES + 150 mM NaCl, pH 7.4.
CIRCLE-seq library preparation and data analysis
CIRCLE-seq experiments were performed as described previously15. In brief, purified genomic DNA was sheared to an average length of 300 bp, end repaired, A tailed, and ligated to uracil-containing stem-loop adaptor. Adaptor-ligated DNA was treated with Lambda Exonuclease (NEB) and E. coli Exonuclease I (NEB), followed by treatment with USER enzyme (NEB) and T4 polynucleotide kinase (NEB), then circularized with T4 DNA ligase, and treated with Plasmid-Safe ATP-dependent DNase (Epicentre) to degrade linear DNA. The circularized DNA was in vitro cleaved by SpCas9 RNP coupled with sgRNA-1617. Cleaved products were A tailed, ligated with a hairpin adaptor, treated with USER enzyme (NEB), and amplified by Kapa HiFi polymerase (Kapa Biosystems). The libraries were sequenced with 150 bp paired-end reads on an Illumina MiSeq instrument. The CIRCLE-seq sequencing data was analyzed by open-source Python package circleseq (https://github.com/tsailabSJ/circleseq).
Microhomology analysis
The sequence around sgRNA-1617 target site of BCL11A enhancer region was uploaded to Microhomology-Predictor of CRISPR RGEN tools (http://www.rgenome.net/mich-calculator/) for microhomology sequence analysis. The 13-bp and 15-bp deletions have corresponding pattern scores of 283.2 and 261.0 respectively. The corresponding indel patterns were also identified by deep sequencing analysis. For BCL11A enhancer and AAVS1, indel sizes from −9 to −20 (representing most of the RGEN-predicted microhomology indels) were classified as MMEJ repaired alleles and indel sizes from −8 to +6 were classified as NHEJ repaired alleles.
Statistics and reproducibility
We utilized unpaired two-tailed Student’s t-test, Pearson correlation and Spearman correlation using GraphPad Prism, for analyses as indicated in Figure Legends.
Data Availability Statement
The data that support the findings of this study are available within the paper and its supplementary information files. The deep sequencing data that support the findings of this study are publicly accessible from the National Center for Biotechnology Information Bioproject database with the accession number PRJNA517275 (https://www.ncbi.nlm.nih.gov/bioproject/PRJNA517275), including the editing efficiency, pre- or post- mice transplant data in Figure 1–4 and the off-target assessment in Extended Data Figure 6. The analytical results and statistics used to generate Figure 1–4 and Extended Data Figure 6 are provided in Supplementary Table 9. There are no restrictions on availability of the data from this study.
Extended Data
Extended Data Figure 1 |. Cas9 RNP dose dependent editing of BCL11A enhancer for HbF induction in CD34+ HSPCs.
a, Comparison of indel frequencies with in vitro transcribed (IVT), synthetic (syn) and modified synthetic (MS) sgRNAs in CD34+ HSPCs by TIDE analysis. b, Comparison of viability of CD34+ HSPCs edited with in vitro transcribed (IVT), synthetic (syn) and modified synthetic (MS) sgRNAs. c, Dose dependent editing rates with Cas9 coupled with MS-sgRNA-1617 and −1639 targeting BCL11A enhancer and -e2 targeting BCL11A exon2 in CD34+ HSPCs by TIDE analysis. d, Comparison of indel frequencies with different molar ratios of Cas9 to MS-sgRNA in CD34+ HSPCs by TIDE analysis. e, Comparison of viability of CD34+ HSPCs edited with different molar ratios of Cas9 to MS-sgRNA. f. Percent HbF+ cells by flow cytometry analysis in erythroid cells in vitro differentiated from CD34+ HSPCs edited by RNP coupled with various sgRNAs (each targeting BCL11A enhancer). Error bars indicate standard deviation (n = 3 replicates). g, Summary of deep sequencing data derived from the Cas9 RNP (coupled with MS-sgRNA-1617) edited CD34+ HSPCs. Asterisk indicates unedited allele. h, HbF induction by HPLC analysis in erythroid cells in vitro differentiated from RNP edited CD34+ HSPCs. i, Genotyping and β-like globin expression analysis of clonal erythroid cells derived from single CD34+ HSPCs. Error bars indicate standard deviation (n = 3 technical replicates per colony). j, BCL11A expression in CD34+ HSPCs edited with Cas9 coupled with various MS-sgRNAs targeting BCL11A enhancer. Expression normalized to CAT, measured by RT-qPCR on day 11 of in vitro differentiation. Error bars indicate standard deviation (n = 3 replicates). k, Correlation of γ-globin mRNA expression determined by RT-qPCR versus HbF by HPLC. Black dots represent samples edited with 2xNLS-Cas9 coupled with various MS-sgRNAs. l, Correlation of BCL11A mRNA versus γ-globin mRNA determined by RT-qPCR. Black dots represent samples edited with 2xNLS-Cas9 coupled with various sgRNAs. m, n, Genotyping and HbF level by HPLC of clonal erythroid cells derived from single CD34+ cells from two independent healthy donors (βAβA#1 in m and βAβA#3 in n) edited with MS-sgRNA-1617. o, Correlation of percent γ-globin mRNA determined by RT-qPCR versus HbF by HPLC. Black dots represent single colonies edited with 2xNLS-Cas9 coupled with MS-sgRNA-1617. The Pearson correlation coefficient (r) is shown. In all panels, data are plotted as mean ± SD. Data are representative of three biologically independent replicates.
Extended Data Figure 2 |. Indel frequencies from deep sequencing.
a. Frequency distribution of alleles with and without indels (shown in blue and red respectively) from deep sequencing of CD34+ HSPCs edited with 2xNLS-Cas9 RNP with indicated MS-sgRNAs targeting BCL11A enhancer. b, Correlation of indel frequencies by deep sequencing versus indel frequencies by TIDE analysis. The Pearson correlation coefficient (r) is shown.
Extended Data Figure 3 |. Long-term multi-lineage engraftment of BCL11A enhancer edited HSPCs in immunodeficient mice.
CD34+ HSPCs from two healthy donors were electroporated with 2xNLS-SpCas9 RNP (coupled with MS-sgRNA-1617) and transplanted into NBSGW mice. Non-electroporated cells were transplanted as controls. 0.4 million cells per mouse were infused for donor βAβA#1, and 0.8 million cells per mouse for donor βAβA#2. a, Mouse bone marrow (BM) was analyzed for human cell chimerism by flow cytometry 16 weeks after transplantation, defined as %hCD45+/(%hCD45++%mCD45+) cells. Each symbol represents a mouse, and mean for each group is shown. b, Indels at the human BCL11A enhancer were determined by TIDE analysis in the input HSPCs prior to transplant and in the mouse bone marrow 16 weeks after transplant. Each engrafted dot represents one mouse, and mean for each group is shown. c, BM collected 16 weeks after transplantation was analyzed by flow cytometry for multilineage reconstitution (calculated as percentage of hCD45+ cells). d, BM collected 16 weeks after transplantation was analyzed by flow cytometry for CD235a+ erythroid cells (calculated as percentage of mCD45−hCD45− cells). e-g, Gene expression analysis by RT-qPCR in human cells (from donor βAβA#2) from BM of engrafted mice. BCL11A expression normalized by CAT in human B cells (e) or human erythroid cells (f) sorted from BM of engrafted mice, and β-like globin expression (g) by RT-qPCR in human erythroid cells sorted from BM. h, BM from one engrafted mouse with unedited control or edited cells (from donor βAβA#1) were transplanted to three secondary NBSGW mice each (control mouse shown with black circle and edited mouse with green diamond symbol in (a, b, d). After 16 weeks, BM was analyzed for human cell chimerism by flow cytometry. i, Indel frequencies within human BCL11A enhancer in BM 16 weeks after secondary transplantation. Each symbol represents an individual recipient mouse. Data are plotted as mean ± SD for (c). Median of each group with 2 to 4 mice is shown as line for the other panels.
Extended Data Figure 4 |. Highly efficient editing of BCL11A enhancer in CD34+ HSPCs.
a, Dose dependent viability enhancement with glycerol or glycine after electroporation. 0.27 M = 2% glycerol, 0.2 M = 1.5% glycine. b, Quantification of editing frequency from deep sequencing of CD34+ HSPCs edited with 3xNLS-Cas9 RNP with MS-sgRNA-1617. c, Length distribution of alleles with and without indels (shown in blue and red respectively) from deep sequencing of the 2xNLS-Cas9 RNP with ms-sgRNA-1617. d, e, Reduction of BCL11A mRNA by RT-qPCR or protein by western blot after editing of human BCL11A enhancer with 2xNLS-Cas9 or 3xNLS-Cas9 RNP with MS-sgRNA-AAVS1 or −1617 on various days of in vitro differentiation. Relative areas under curve (AUCs) are indicated. f, g, β-like globin expression by RT-qPCR and HbF level by HPLC in erythroid cells in vitro differentiated from 3xNLS-Cas9 RNP coupled with MS-sgRNA-1617 edited CD34+ HSPCs. All data represent the mean ±SD. Statistically significant differences are indicated as follows: *P < 0.05 as determined by unpaired t test. P= 0.0152 for (f) and 0.0443 for (g). In all panels, data are plotted as mean ± SD and analyzed using unpaired two-tailed Student’s t tests. Data are representative of three biologically independent replicates.
Extended Data Figure 5 |. Long-term multi-lineage reconstituting HSCs edited with 3xNLS-Cas9.
a-d, NBSGW mice were transplanted with 3xNLS-Cas9 RNP with MS-sgRNA-1617 edited healthy donor CD34+ HSPCs 2 h (day 0), 24 h (day 1) or 48 h (day 2) after electroporation. BM were collected 16 weeks after transplantation and analyzed by flow cytometry for human cell chimerism (a), multilineage reconstitution (b) or human erythroid cells (c) in BM, as well as indel frequencies determined by TIDE analysis (d). e-h, NBSGW mice were transplanted with 3xNLS-Cas9 RNP with MS-sgRNA-1617 edited healthy donor CD34+ HSPCs supplemented with 2%, 4% or 6% of glycerol for electroporation. BM were collected 16 weeks after transplantation and analyzed by flow cytometry for human cell chimerism (e), multilineage reconstitution (f) or human erythroid cells (g) in BM, as well as the indel frequencies determined by TIDE analysis (h). i, Multilineage reconstitution analysis of BM collected from mice engrafted with control or edited CD34+ HSPCs (from donor βAβA#4). Error bars indicate standard deviation. Data are plotted as mean ± SD for (b, f, i). Median of each group with 1 to 3 mice is shown as line for the other panels.
Extended Data Figure 6 |. Off-target analysis of human CD34+ HSPCs edited by SpCas9 RNP targeting BCL11A enhancer.
a, Off-target sites detected by CIRCLE-seq for MS-sgRNA-1617 targeting human BCL11A enhancer. b, Deep sequencing analysis of potential off-target sites detected by CIRCLE-seq or in silico computational prediction within human CD34+ HSPCs edited by 2xNLS-Cas9 or 3xNLS-Cas9 RNP (coupled with MS-sgRNA-1617) targeting BCL11A enhancer. On-target sequence is at the BCL11A enhancer. Dotted line at 0.1% denotes sensitivity of deep sequencing to detect indels. c, RT-qPCR analysis of p21 expression after gene editing. Relative expression to GAPDH is shown. Data are plotted as mean ± SD and representative of three biologically independent replicates.
Extended Data Figure 7 |. Editing of BCL11A enhancer in SCD patient (βSβS) HSPCs.
NBSGW mice were transplanted with 3xNLS-Cas9 RNP with MS-sgRNA-1617 edited βSβS#1 CD34+ HSPCs 24 h (day 1) or 48 h (day 2) after electroporation. BM were collected 16 weeks after transplantation and analyzed by flow cytometry for human cell chimerism (a), multilineage reconstitution (b) or human erythroid cells (c) in BM, as well as the indel frequencies determined by TIDE analysis (d). Error bars indicate standard deviation. e, Editing efficiency of 3xNLS-Cas9 coupled with MS-sgRNA-AAVS1 for control and −1617 for BCL11A enhancer editing in βSβS#2 CD34+ HSPCs as measured by TIDE analysis. f, β-like globin expression by RT-qPCR analysis in erythroid cells in vitro differentiated from RNP edited βSβS#2 CD34+ HSPCs. Error bars indicate standard deviation (n = 3 replicates). g, Multilineage reconstitution analysis of BM collected from mice engrafted with control or edited CD34+ HSPCs (from donor βSβS#2). h, Analysis of in vitro sickling of unedited control or edited enucleated βSβS#2 erythroid cells. Images were taken every 1 minute after MBS treatment. Result shown as percent sickled cells at each time point. Data are plotted as mean ± SD for (b, e, f, g). Median of each group with 1 to 3 mice is shown as line for the other panels.
Extended Data Figure 8 |. Summary of engraftment analysis.
a, Indel frequencies of indicated input HSPCs and engrafted human cells in 16 week BM. b. Correlation between input cell number and human engraftment rates in 16 week BM. c, Correlation of BCL11A mRNA versus γ-globin mRNA determined by RT-qPCR. Black dots represent erythroid cells from CD34+ HSPCs edited with SpCas9 coupled with various sgRNAs differentiated in vitro without engraftment; red dots represent erythroid cells sorted from mice BM engrafted from human CD34+ HSPCs edited with SpCas9 coupled with MS-sgRNA-1617. The Pearson correlation coefficient (r) is shown. d, BM cells (engrafted from donor βAβA#1 and βSβS#1) collected from engrafted mice were in vitro differentiated to human erythroid cells for HbF level analysis by HPLC. Each dot represents erythroid cells differentiated from BM of one mouse, and mean ± SD for each group is shown. e, Relative loss of indels in HSC-enriched CD34+ CD38- CD90+ CD45RA- sorted population as compared to bulk pre-sorted HSPCs after editing by 2 μM or 5 μM RNP. All data represent the mean ±SD. Statistically significant differences are indicated as follows: ****P < 0.0001, **P < 0.01 (P=0.0046) as determined by unpaired t test. f. Comparison of β-like globin expression by RT-qPCR between erythroid cells in vitro differentiated from RNP edited CD34+ HSPCs (pre-engraftment) and engrafted bone marrow (post-engraftment). Statistically significant differences are indicated as follows: ****P < 0.0001, ***P < 0.001 (P=0.0006), **P < 0.01 (P=0.0092) as determined by unpaired t test. In all panels, data are plotted as mean ± SD and analyzed using unpaired two-tailed Student’s t tests. Data are from indicated number of mice for (a, b, d) or representative of three biologically independent replicates for (c, e, f).
Extended Data Figure 9 |. Indel spectrums of engrafted bone marrow and corresponding input cells.
Indel spectrums of engrafted bone marrow (BM) and corresponding input cells from four donors electroporated with 2xNLS-Cas9 or 3xNLS-Cas9 coupled with MS-sgRNA-1617 (a) or -AAVS1 (b) supplemented with different concentration of glycerol (0%G to 6%G). c, Relative loss of edited alleles repaired by MMEJ and gain of edited alleles repaired by NHEJ in mice BM 16 weeks after transplant. The indel spectrum was determined by TIDE analysis. Indel length from −8 to +6 bp was calculated as NHEJ, and from −9 to −20 bp as MMEJ. These data comprise 28 mice transplanted with 8 BCL11A enhancer edited inputs and 5 mice transplanted with 2 AAVS1 edited inputs. Median of each group is shown as line, **P < 0.005, ****P < 0.0001 as determined by Kolmogorov–Smirnov test. d, e, Summary of most frequent indels by deep sequencing of bone marrow cells from primary recipient (d) and secondary recipient (e) engrafted with BCL11A enhancer edited CD34+ HSPCs. Asterisk indicates unedited allele. f, g, Indel spectra of HSPCs stained and sorted 2h after RNP electroporation with 3xNLS-Cas9 with sgRNA-AAVS1. HSPCs prestimulated for 24h prior to electroporation. HSPCs stained with CD34, CD38, CD90, CD45RA in (f) and with Pyronin Y, Hoechst 33342 in (g). Indels determined by Sanger sequencing with TIDE analysis after culturing cells for 4 days after sort. Data are representative of three biologically independent replicates.
Extended Data Figure 10 |. Flow cytometry of CD34+ HSPCs with 24 hours of culture.
Cryopreserved G-CSF mobilized CD34+ HSPCs were stained with CD34, CD38, CD90, and CD45RA antibodies (in a), or stained with Hoechst 33342 and Pyronin Y (in b) at 0 hours following thaw or after 24 hours in culture with SCF, TPO and FLT3-L. HSPCs were electroporated with RNP with 3x-NLS-SpCas9 with BCL11A enhancer or AAVS1 targeting sgRNA. After 2 hour recovery, cells were stained with CD34, CD38, CD90, and CD45RA or with Hoechst 33342 and Pyronin Y, and sorted according to gates as shown in c-d.
Supplementary Material
Supplementary Table 2 | HBB genotype of β-thalassemia patients.
Supplementary Table 3 | Primary xenotransplant of Cas9 RNP edited CD34+ HSPCs to 33 NBSGW recipients.
Supplementary Table 1 | Genotyping of single colonies from BCL11A enhancer edited human CD34+ HSPCs.
Supplementary Table 4 | Off-target sites identified by CIRCLE-seq.
Supplementary Table 5 | Off-target sites identified by CRISPOR prediction.
Supplementary Table 6 | Rapid Heme Panel (clinically approved 95-gene targeted deep sequencing panel) analysis of hematologic malignancy associated loci.
Supplementary Table 7 | Predicted MMEJ patterns after sgRNA-1617 editing by CRISPR RGEN.
Supplementary Table 8 | Published reports of genome editing in human CD34+ hematopoietic stem and progenitor cells.
Supplementary Table 9 | Primers used in this study.
Enucleated erythroid cells were in vitro differentiated from BM of NBSGW mice transplanted with unedited or BCL11A enhancer edited βSβS CD34+ HSPCs. The videos were recorded from 0.5 min to 30 min following MBS induction. Data are representative of three biologically independent replicates.
Enucleated erythroid cells were in vitro differentiated from BM of NBSGW mice transplanted with unedited or BCL11A enhancer edited βSβS CD34+ HSPCs. The videos were recorded from 0.5 min to 30 min following MBS induction. Data are representative of three biologically independent replicates.
Acknowledgements
We thank David Chui for genetic analyses, Natasha Barteneva for Imagestream analysis, Ronald Mathieu and BCH flow cytometry staff for technical assistance, Zachary Herbert and DFCI molecular biology core for deep sequencing assistance, and Gerda Menard and Rodel Rosales for assistance with hemoglobin HPLC analysis. We appreciate useful discussions with Jonathan Hsu, Ben Croker, Coleman Lindsley, Kevin Holden, Megan Hoban, Matthew Canver and Stuart Orkin. This project was funded in part by the Translational Research Program at BCH. D.A.W. and C.B. were supported by NHLBI (U01HL11772) and D.A.W. and E.B.E. by NHLBI (R01HL137848). The trial for SCD HSPC procurement was supported by research funding from bluebird bio to A.B. L.P. was supported by NHGRI (R00HG008399). S.A.W. was supported by NIAID (R01AI117839) and NIGMS (R01GM115911). D.E.B. was supported by NIDDK (K08DK093705, R03DK109232), NHLBI (DP2OD022716, P01HL032262), Harvard Stem Cell Institute Seed Grant, St. Jude Children’s Research Hospital Collaborative Research Consortium, Burroughs Wellcome Fund, American Society of Hematology, and the Doris Duke Charitable, Charles H. Hood, and Cooley’s Anemia Foundations.
Footnotes
Competing Interests Statement
The authors declare competing financial interests, Y.W., J.Z., S.A.W., D.E.B. have applied for patents related to therapeutic gene editing including US Patent Applications 13/72236, 15/572,523, 18/34618, 18/43073.
References
- 1.Lettre G & Bauer DE Fetal haemoglobin in sickle-cell disease: From genetic epidemiology to new therapeutic strategies. Lancet 387, 2554–2564 (2016). [DOI] [PubMed] [Google Scholar]
- 2.Bauer DE et al. An Erythroid Enhancer of BCL11A Subject to Genetic Variation Determines Fetal Hemoglobin Level. Science 342, 253–257 (2013). [DOI] [PMC free article] [PubMed] [Google Scholar]
- 3.Canver MC et al. BCL11A enhancer dissection by Cas9-mediated in situ saturating mutagenesis. Nature 527, 192–197 (2015). [DOI] [PMC free article] [PubMed] [Google Scholar]
- 4.Smith E et al. Strict in vivo specificity of the Bcl11a erythroid enhancer. Blood 128, 2338–2342 (2016). [DOI] [PMC free article] [PubMed] [Google Scholar]
- 5.Vierstra J et al. Functional footprinting of regulatory DNA. Nat. Methods 12, 927–30 (2015). [DOI] [PMC free article] [PubMed] [Google Scholar]
- 6.Chang K-H et al. Long-Term Engraftment and Fetal Globin Induction upon BCL11A Gene Editing in Bone-Marrow-Derived CD34+ Hematopoietic Stem and Progenitor Cells. Mol. Ther. - Methods Clin. Dev 4, 137–148 (2017). [DOI] [PMC free article] [PubMed] [Google Scholar]
- 7.Kim S, Kim D, Cho SW, Kim J & Kim J Highly efficient RNA-guided genome editing in human cells via delivery of purified Cas9 ribonucleoproteins. Genome Res 24, 1012–1019 (2014). [DOI] [PMC free article] [PubMed] [Google Scholar]
- 8.Lin S, Staahl B, Alla RK & Doudna J. a. Enhanced homology-directed human genome engineering by controlled timing of CRISPR/Cas9 delivery. Elife 3, 1–13 (2014). [DOI] [PMC free article] [PubMed] [Google Scholar]
- 9.Hendel A et al. Chemically modified guide RNAs enhance CRISPR-Cas genome editing in human primary cells. Nat. Biotechnol 33, 985–989 (2015). [DOI] [PMC free article] [PubMed] [Google Scholar]
- 10.Tsai S-F et al. Cloning of cDNA for the major DNA-binding protein of the erythroid lineage through expression in mammalian cells. Nature 339, 446–451 (1989). [DOI] [PubMed] [Google Scholar]
- 11.McIntosh BE et al. Nonirradiated NOD,B6.SCID Il2r??−/− kitW41/W41 (NBSGW) mice support multilineage engraftment of human hematopoietic cells. Stem Cell Reports 4, 171–180 (2015). [DOI] [PMC free article] [PubMed] [Google Scholar]
- 12.Lu X, Wood DK & Higgins JM Deoxygenation Reduces Sickle Cell Blood Flow at Arterial Oxygen Tension. Biophys. J 110, 2751–2758 (2016). [DOI] [PMC free article] [PubMed] [Google Scholar]
- 13.Estcourt L, Fortin P, Hopewell S, Trivella M & Wang WC Blood transfusion for preventing primary and secondary stroke in people with sickle cell disease. Cochrane DataBase Syst. Rev 1–88 (2017). doi: 10.1002/14651858.CD003146.pub3.www.cochranelibrary.com [DOI] [PMC free article] [PubMed] [Google Scholar]
- 14.Lin S, Staahl B, Alla RK & Doudna J. a. Enhanced homology-directed human genome engineering by controlled timing of CRISPR/Cas9 delivery. Elife 3, 1–13 (2014). [DOI] [PMC free article] [PubMed] [Google Scholar]
- 15.Tsai SQ et al. CIRCLE-seq: A highly sensitive in vitro screen for genome-wide CRISPR-Cas9 nuclease off-targets. Nat. Methods 14, 607–614 (2017). [DOI] [PMC free article] [PubMed] [Google Scholar]
- 16.Haapaniemi E, Botla S, Persson J, Schmierer B & Taipale J CRISPR – Cas9 genome editing induces a p53- mediated DNA damage response. Nat. Med (2018). doi: 10.1038/s41591-018-0049-z [DOI] [PubMed] [Google Scholar]
- 17.Ihry RJ et al. p53 inhibits CRISPR – Cas9 engineering in human pluripotent stem cells. Nat. Med (2018). doi: 10.1038/s41591-018-0050-6 [DOI] [PubMed] [Google Scholar]
- 18.Kluk MJ et al. Validation and Implementation of a Custom Next-Generation Sequencing Clinical Assay for Hematologic Malignancies. J. Mol. Diagnostics 18, 507–515 (2016). [DOI] [PMC free article] [PubMed] [Google Scholar]
- 19.Lagresle-Peyrou C et al. Plerixafor enables the safe, rapid, efficient mobilization of haematopoietic stem cells in sickle cell disease patients after exchange transfusion. Haematologica haematol 2017.184788 (2018). doi: 10.3324/haematol.2017.184788 [DOI] [PMC free article] [PubMed] [Google Scholar]
- 20.Boulad F et al. Safety and efficacy of plerixafor dose escalation for the mobilization of CD34+ hematopoietic progenitor cells in patients with sickle cell disease: interim results. Haematologica Epub ahead, haematol.2017.187047 (2018). [DOI] [PMC free article] [PubMed] [Google Scholar]
- 21.Esrick EB et al. Successful hematopoietic stem cell mobilization and apheresis collection using plerixafor alone in sickle cell patients. Blood Adv 2, 2505–2512 (2018). [DOI] [PMC free article] [PubMed] [Google Scholar]
- 22.Bae S, Kweon J, Kim HS & Kim J-S Microhomology-based choice of Cas9 nuclease target sites. Nat. Methods 11, 705–706 (2014). [DOI] [PubMed] [Google Scholar]
- 23.Truong LN et al. Microhomology-mediated End Joining and Homologous Recombination share the initial end resection step to repair DNA double-strand breaks in mammalian cells. Proc. Natl. Acad. Sci 110, 7720–7725 (2013). [DOI] [PMC free article] [PubMed] [Google Scholar]
- 24.Sfeir A & Symington LS Microhomology-Mediated End Joining: A Back-up Survival Mechanism or Dedicated Pathway? Trends Biochem. Sci 40, 701–714 (2015). [DOI] [PMC free article] [PubMed] [Google Scholar]
- 25.Mohrin M et al. Hematopoietic stem cell quiescence promotes error-prone DNA repair and mutagenesis. Cell Stem Cell 7, 174–185 (2010). [DOI] [PMC free article] [PubMed] [Google Scholar]
- 26.DeWitt MA et al. Selection-free genome editing of the sickle mutation in human adult hematopoietic stem/progenitor cells. Sci. Transl. Med 8, (2016). [DOI] [PMC free article] [PubMed] [Google Scholar]
- 27.Dever DP et al. CRISPR/Cas9 β-globin gene targeting in human haematopoietic stem cells. Nature 539, 384–389 (2016). [DOI] [PMC free article] [PubMed] [Google Scholar]
- 28.Genovese P et al. Targeted genome editing in human repopulating haematopoietic stem cells. Nature 510, 235–40 (2014). [DOI] [PMC free article] [PubMed] [Google Scholar]
- 29.Wang J et al. Homology-driven genome editing in hematopoietic stem and progenitor cells using ZFN mRNA and AAV6 donors. Nat. Biotechnol 33, 1256–1263 (2015). [DOI] [PMC free article] [PubMed] [Google Scholar]
- 30.Hoban MD et al. Correction of the sickle-cell disease mutation in human hematopoietic stem/progenitor cells. Blood 125, 2597–604 (2015). [DOI] [PMC free article] [PubMed] [Google Scholar]
- 31.De Ravin SS et al. CRISPR-Cas9 gene repair of hematopoietic stem cells from patients with X-linked chronic granulomatous disease. Sci. Transl. Med 9, 1–10 (2017). [DOI] [PubMed] [Google Scholar]
- 32.Gundry MC et al. Highly Efficient Genome Editing of Murine and Human Hematopoietic Progenitor Cells by CRISPR/Cas9. Cell Rep 17, 1453–1461 (2016). [DOI] [PMC free article] [PubMed] [Google Scholar]
- 33.Holt N et al. Human hematopoietic stem/progenitor cells modified by zinc-finger nucleases targeted to CCR5 control HIV-1 in vivo. Nat. Biotechnol 28, 839–847 (2010). [DOI] [PMC free article] [PubMed] [Google Scholar]
- 34.Diez B et al. Therapeutic gene editing in CD 34 + hematopoietic progenitors from Fanconi anemia patients 9, 1574–1588 (2017). [DOI] [PMC free article] [PubMed] [Google Scholar]
- 35.Kosicki M, Tomberg K & Bradley A Repair of CRISPR–Cas9-induced double-stranded breaks leads to large deletions and complex rearrangements. Nat. Biotechnol (2018). doi: 10.1038/nbt.4192 [DOI] [PMC free article] [PubMed] [Google Scholar]
- 36.Traxler EA et al. A genome-editing strategy to treat β-hemoglobinopathies that recapitulates a mutation associated with a benign genetic condition. Nat. Med 22, 987–990 (2016). [DOI] [PMC free article] [PubMed] [Google Scholar]
- 37.Liu N et al. Direct Promoter Repression by BCL11A Controls the Fetal to Adult Hemoglobin Switch. Cell 173, 430–442.e17 (2018). [DOI] [PMC free article] [PubMed] [Google Scholar]
- 38.Martyn GE et al. Natural regulatory mutations elevate fetal globin via disruption of BCL11A or ZBTB7A binding. Nat. Genet 50, 498–503 (2018). [DOI] [PubMed] [Google Scholar]
- 39.Vakulskas CA et al. A high-fidelity Cas9 mutant delivered as a ribonucleoprotein complex enables efficient gene editing in human hematopoietic stem and progenitor cells. Nat. Med (2018). doi: 10.1038/s41591-018-0137-0 [DOI] [PMC free article] [PubMed] [Google Scholar]
- 40.Xu S et al. Editing aberrant splice sites efficiently restores β-globin expression in β-thalassemia. Blood, (2019). Accepted. [DOI] [PMC free article] [PubMed] [Google Scholar]
- 41.An X et al. Global transcriptome analyses of human and murine terminal erythroid differentiation. Blood 123, 3466–3478 (2014). [DOI] [PMC free article] [PubMed] [Google Scholar]
- 42.Guda S et al. miRNA-embedded shRNAs for lineage-specific BCL11A knockdown and hemoglobin F induction. Mol. Ther 23, 1465–1474 (2015). [DOI] [PMC free article] [PubMed] [Google Scholar]
- 43.Eddaoudi A, Canning SL & Kato I in Cellular Quiescence: Methods and Protocols, Methods in Molecular Biology 1686, 49–57 (2018). [DOI] [PubMed] [Google Scholar]
- 44.Pinello L et al. CRISPResso: sequencing analysis toolbox for CRISPR-Cas9 genome editing. Nat. Biotechnol 34, 695–697 (2016). [DOI] [PMC free article] [PubMed] [Google Scholar]
- 45.Makkerh JPS, Dingwall C & Laskey RA Comparative mutagenesis of nuclear localization signals reveals the importance of neutral and acidic amino acids. Curr. Biol 6, 1025–1027 (1996). [DOI] [PubMed] [Google Scholar]
Associated Data
This section collects any data citations, data availability statements, or supplementary materials included in this article.
Supplementary Materials
Supplementary Table 2 | HBB genotype of β-thalassemia patients.
Supplementary Table 3 | Primary xenotransplant of Cas9 RNP edited CD34+ HSPCs to 33 NBSGW recipients.
Supplementary Table 1 | Genotyping of single colonies from BCL11A enhancer edited human CD34+ HSPCs.
Supplementary Table 4 | Off-target sites identified by CIRCLE-seq.
Supplementary Table 5 | Off-target sites identified by CRISPOR prediction.
Supplementary Table 6 | Rapid Heme Panel (clinically approved 95-gene targeted deep sequencing panel) analysis of hematologic malignancy associated loci.
Supplementary Table 7 | Predicted MMEJ patterns after sgRNA-1617 editing by CRISPR RGEN.
Supplementary Table 8 | Published reports of genome editing in human CD34+ hematopoietic stem and progenitor cells.
Supplementary Table 9 | Primers used in this study.
Enucleated erythroid cells were in vitro differentiated from BM of NBSGW mice transplanted with unedited or BCL11A enhancer edited βSβS CD34+ HSPCs. The videos were recorded from 0.5 min to 30 min following MBS induction. Data are representative of three biologically independent replicates.
Enucleated erythroid cells were in vitro differentiated from BM of NBSGW mice transplanted with unedited or BCL11A enhancer edited βSβS CD34+ HSPCs. The videos were recorded from 0.5 min to 30 min following MBS induction. Data are representative of three biologically independent replicates.
Data Availability Statement
The data that support the findings of this study are available within the paper and its supplementary information files. The deep sequencing data that support the findings of this study are publicly accessible from the National Center for Biotechnology Information Bioproject database with the accession number PRJNA517275 (https://www.ncbi.nlm.nih.gov/bioproject/PRJNA517275), including the editing efficiency, pre- or post- mice transplant data in Figure 1–4 and the off-target assessment in Extended Data Figure 6. The analytical results and statistics used to generate Figure 1–4 and Extended Data Figure 6 are provided in Supplementary Table 9. There are no restrictions on availability of the data from this study.


