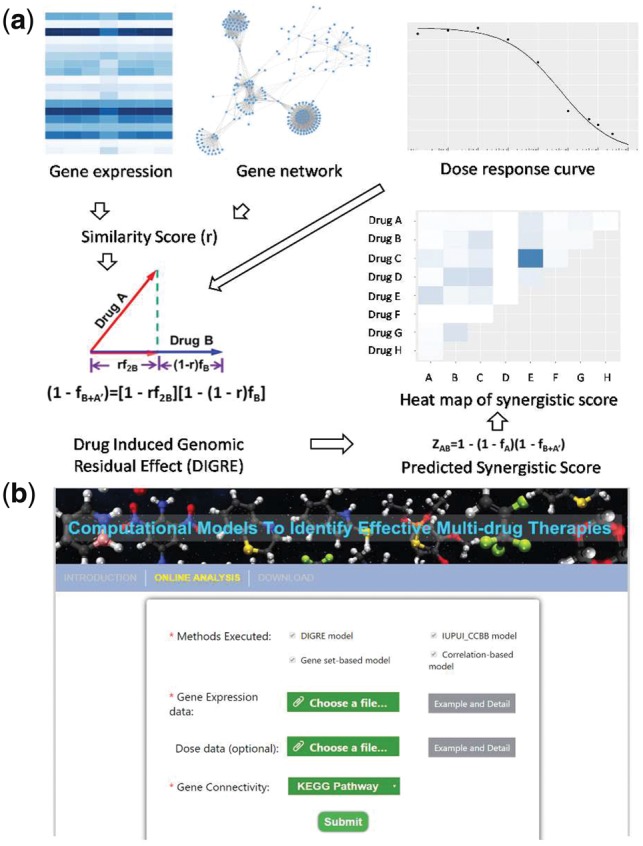
Fig. 1.

(a) DIGRE model workflow: (1) Drug-treated gene expression and gene–gene interaction network are used to generate similarity scores (r); (2) combine r and dose–response curve to compute the genomic residual effect; (3) then the synergistic score is calculated and visualized. (b) DIGREM website analysis page interface
