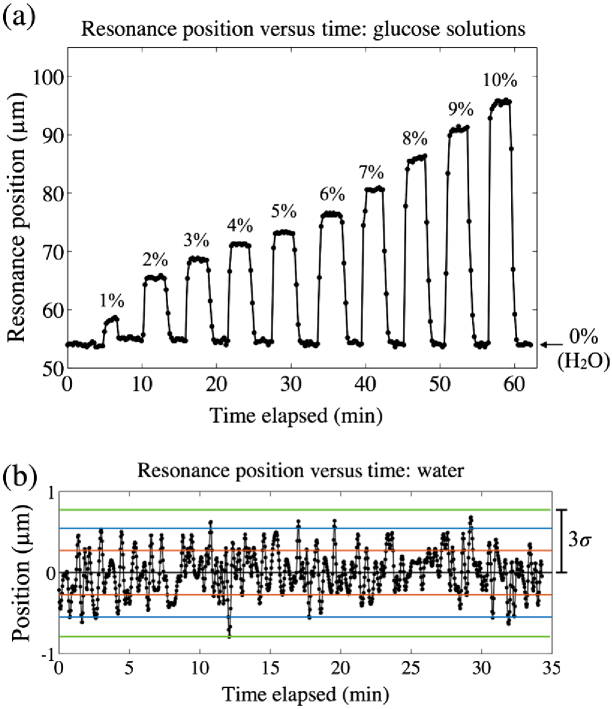
Fig. 3.
(a) Position of the resonance peak versus time as different glucose solutions are introduced, where the percentages indicate the %w/v glucose concentration. Water (0%) was introduced between each sugar solution. (b) Position versus time for water only, centered about the mean. The red, blue, and green lines indicate one, two, and three standard deviations () away from the mean, respectively.

