Abstract
Purpose:
Swept source optical coherence tomography angiography (SS-OCTA) was used to measure the age-dependent changes in macular choriocapillaris (CC) flow deficits (FDs) in normal eyes.
Design:
A prospective, cross-sectional study.
Methods:
Subjects with normal eyes ranging in age from their 20s to their 80s were imaged using a 100-kHz SS-OCTA instrument (PLEX® Elite 9000, Carl Zeiss Meditec). Both 3×3 mm and 6×6 mm scans were used to image the macular CC. Visualization of the CC and quantification of FDs were performed using a previously validated algorithm. The percentage of FDs (FD%) in the central 1 mm circle (C1), 1.5 mm rim (R1.5), and 2.5 mm circle (C2.5) from the 3×3 mm and 6×6 mm scans and FD% in the 2.5 mm rim (R2.5) and 5 mm circle (C5) from the 6×6 mm scans were measured and correlated with age and axial length.
Results:
A total of 164 subjects were enrolled with at least 10 subjects from each decade of life. No meaningful correlations were found between FD% and axial length (∣r∣ < 0.30). FD% in all fields increased with increasing age (all r > 0.50; all P < 0.001); however, the greatest increases were found in the central macula C1 regions and the smallest increases in the peripheral macula R2.5 regions.
Conclusions:
In normal aging, the FD% increased with age across the central 5 mm of the macula, but the greatest increase was found in the central 1 mm region of the macula.
INTRODUCTION
The choriocapillaris (CC) is a thin, single-layer of densely interconnected capillaries that provide nutritional support for the retinal pigment epithelium (RPE) and the outer retina.1 Histopathological studies have shown decreased CC density associated with aging,2 in retinal diseases such as age-related macular degeneration (AMD),3,4 and diabetic retinopathy (DR).5 Ramrattan et al. studied 95 histologically normal eyes ranging in age from 6 to 100 years old and found that in the macula, age was highly correlated with CC density.2 In eyes with AMD, Sarks et al. found that loss of the RPE was associated with atrophy of CC,3 and McLeod et al. confirmed a linear relationship between the loss of RPE and CC in geography atrophy (GA).4 They also reported extreme constriction of CC in the borders of GA and choroidal neovascularization (CNV) without RPE atrophy. In early AMD, Mullins et al. showed that CC loss was associated with increasing drusen density.6
Until recently, visualization of the CC was limited to postmortem histology or indirect observations from dye-based angiography in which the perfusion patterns were assumed to reflect the CC.7 Due to the location of this capillary network, its small intercapillary spaces, and the fenestrated nature of the CC beneath the highly lightscattering RPE, it cannot be directly visualized using fluorescein angiography (FA) or indocyanine green angiography (ICGA). In FA, the RPE prevents fluorescent excitation and detection and the fenestrated CC results in rapid diffusion of the fluorescein into the extravascular space. In conventional ICGA, the resolution of the imaging technique is inadequate to detect the CC, and even though the CC is not directly visualized, its presence is inferred from the diffuse background fluorescent haze that results late in the ICGA transit phases.
With the development of optical coherence tomography angiography (OCTA), the CC can now be visualized in vivo. Choi et al. reported CC imaging of normal human subjects in vivo by using a long wavelength, 400 kHz swept-source OCTA (SS-OCTA) prototype,8 and the en face CC images of the central fovea and temporal retina were consistent with Olver’s electron micrographs of methyl methacrylate casts.9 Additional studies using the same OCTA system have shown alterations within the CC around GA, under nascent GA, and in eyes with DR.10-14 Using adaptive optics OCTA (AO-OCTA), Kurokawa et al. visualized the CC and performed quantitative morphometry of the CC at the level of individual capillaries using a small field of view in healthy human eyes.15 Using both high speed (1.7MHz) and standard speed (170kHz) SS-OCTA imaging systems, Gorczynska et al. visualized the CC meshwork.16 However, all of these studies used investigational, research OCTA systems that were laboratory-based and not commercially available.
Using commercially available spectral domain (SD) and swept source (SS) OCTA instruments, researchers have imaged the CC in several retina diseases.17-23 While visualization of the actual CC vessels was below the resolution limit of these instruments in the central macula, the researchers detected areas where flow signals were not detectable and these areas were larger than the resolution limits for these instruments. Spaide investigated age-dependent changes in the flow characteristics of the CC in normal eyes using SD-OCTA.17 He identified areas where the flow signal was not detectable, which he called flow voids, and his results suggested that the number of these flow voids increased with age and a history of hypertension. However, age-dependent changes in the CC using a validated, more reliable SS-OCTA imaging algorithm24,25 have not been reported.
To investigate changes in the CC associated with disease, especially in late-onset conditions such as AMD, it is important to understand how the CC changes with normal aging. In this study we used a commercially available SS-OCTA instrument and our novel algorithm24,25 to quantitate CC flow deficits within the macula and determine the changes in the macular CC associated with aging.
METHODS
The study protocol was approved by the Institutional Review Board (IRB) of the University of Miami Miller School of Medicine Medical Sciences Subcommittee for the Protection of Human Subjects and was performed in accordance with Health Insurance Portability and Accountability Act of 1996 regulations. All subjects signed an IRB approved consent before OCT imaging was performed. From November 2016 to February 2018, we prospectively enrolled volunteers with no known ocular disease for this study at the Bascom Palmer Eye Institute. Subjects had no visual complaints, a normal ocular history, and no identified optic disc, retinal, or choroidal pathology on examination.
Initially, we wanted to include at least 10 subjects in each decade of life ranging from the 20s through the 80s. The exclusionary criteria included any history of an ocular disease, any retinal or choroidal pathology detected on examination or with OCT imaging, a refractive error of greater than −6.0 diopters, axial length longer than 26.00 mm, and any history diabetes mellitus even without clinical evidence of DR. At the time of enrollment, both axial length measurements and SS-OCTA imaging were performed. Axial length measurements were performed using a noncontact biometry instrument (IOL Master, Carl Zeiss Meditec). Each subject was then scanned using the SS-OCTA instrument (PLEX® Elite 9000, Carl Zeiss Meditec, Dublin, CA), which has been cleared by the FDA for commercial use. This SS-OCTA instrument has a scanning rate of 100,000 A-scans per second, a central wavelength of 1,060 nm, a bandwidth of 100 nm, an A-scan depth of 3.0mm in tissue (1536 pixels), a full width at half maximum axial resolution of ~5μm in tissue, and a lateral resolution at the retinal surface estimated at ~14μm. FastTrac motion correction software was used while the images were acquired. The scan protocols for imaging the CC were a 3×3 mm scan and a 6×6 mm scan centered on the fovea. Each 3×3 mm scan consisted of 300 A-scans per B-scan, repeated four times at each of the 300 B-scan positions. As a result, a homogenous sampling grid was obtained with an A-scan separation of 10μm. Each 6×6 mm scan consisted of 500 A-scans per B-scan, repeated two times at each of the 500 B-scan positions, which resulted a homogenous sampling grid with a separation of 12μm. For all the participants, each eye was imaged separately, and one eye from each subject was selected to be analyzed in the study. The right eye was the default selection unless gross eye movements and poor signal were noted in scans of the right eye. Images were excluded from the study if significant media opacity was present, if signal strength was less than seven as defined by manufacturer, which prevented high-quality imaging, or if there was severe motion artifact. Due to variation in the OCT signal strength among the subjects, we normalized all the OCT images to a signal strength of nine before the OCTA images were processed.26 This treatment should mitigate the influence of the OCT signal strength variation among the subjects on the final CC maps.
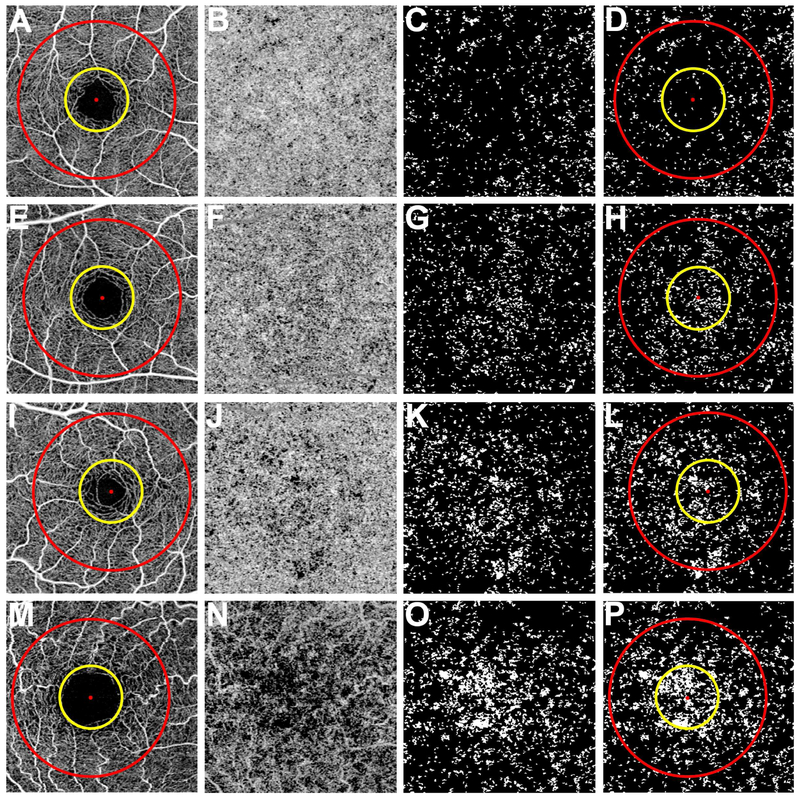
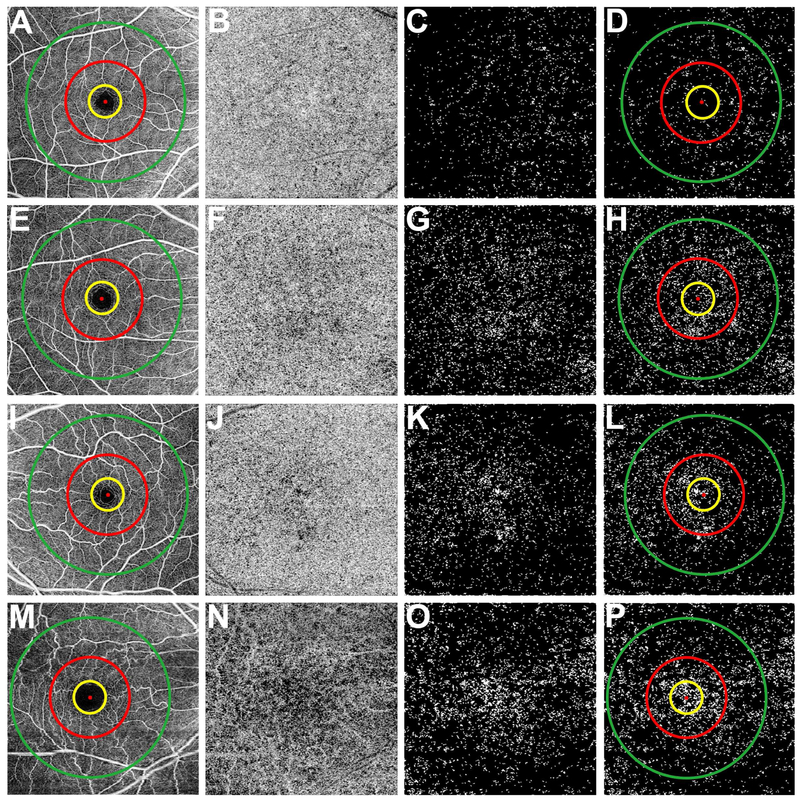
The method for visualizing CC and quantitating the flow deficits (FDs) was previously described.24 In that work we also demonstrated high repeatability of FD measurements in both normal eyes and eyes with drusen. As previous studies have documented, the CC was best visualized by selecting a slab slightly below the anatomic CC boundary due to the phenomenon of decorrelation tails.10,13,27,28 A 20μm thickness slab was used with the inner boundary located beneath Bruch’s membrane. The CC en face flow images were then corrected by using the corresponding en face structural image to compensate for signal loss due to the overlying anatomy, and retinal vessel projection artifacts were removed from the CC en face flow images for more accurate quantification, as previously described.24,29 Threshold values for the 3×3 mm and 6×6 mm images to isolate FDs were obtained based on standard deviations of the CC from 20 eyes randomly chosen from subjects with ages in their 20s to 30s. The shadows cast by the large retinal vessels on the CC images have been excluded from the flow deficits analysis. FDs were identified after thresholding and binarization of CC en face flow images.24 Very small FDs were likely to represent SS-OCT speckle noise in the images rather than physiologically meaningful signals.25 The actual average intercapillary distance based on AO-OCT studies was shown to be about 39 μm.15 We used similar consideration based on a histogram analysis of flow deficit sizes in our sample of normal eyes to derive a cut-off criterion for small FDs. The histogram distribution demonstrated two dominant modes, and following a radial power spectrum analysis, the bimodal histogram indicated the average inter-capillary distance within the CC map was 24 μm. This value was then selected as a cut-off threshold and all FDs with a diameter less than 24 μm were removed.25 Quantitation of the CC on the 3×3 mm scan was performed by calculating the percentage of FDs (FD %) in 1 mm circle (C1), 1.5 mm rim (R1.5), and the entire 2.5 mm circle (C2.5) centered on the fovea (Figure 1D, 1H, 1L and 1P). On the 6×6 mm scans, FD% within the same C1, R1.5, C2.5 were calculated, as well as the 2.5 mm rim (R2.5), and 5 mm circle (C5) centered on the fovea (Figure 2D, 2H, 2L and 2P). The location of the fovea was determined manually by examining the B-scans vertically and horizontally.30 In addition, areas were excluded from analysis if the OCT signal strength was less than twice that of the system noise floor calculated from the region within foveal avascular zone.
Figure 1: Visualization of the choriocapillaris and the regions used to calculate the percentage of flow deficits from the 3×3 mm scans.
First column (A, E, I, and M): 3×3 mm total retina en face flow images showing the 1 mm diameter yellow circle and 2.5 mm diameter red circle centered on the fovea resulting in three regions: the 2.5 mm circle comprised of a 1 mm circle and a 1.5 mm rim. Second column (B, F, J, and N): 3×3 mm choriocapillaris en face flow images after artifact removal and structural compensation. Third column (C, G, K, and O): 3×3 mm en face flow image after binarization, thresholding, and removal of flow deficits with diameter smaller than 24 μm. The white areas correspond to the flow deficits. Fourth column (D, H, L, and P): 3×3 mm en face flow deficit images with the circles used to measure the percentage of flow deficits within the regions. (A-D) Images from a 26-year-old subject. (E-H) Images from a 48-year-old subject. (I-L) Images from a 63-year-old subject. (M-P) Images from an 87-year-old subject.
Figure 2: Visualization of the choriocapillaris and the regions used to calculate the percentage of flow deficits from the 6×6 mm scans.
First column (A, E, I, and M): 6×6 mm total retina en face flow images showing the 1 mm diameter yellow circle, 2.5 mm diameter red circle, and the 5 mm diameter green circle centered on the fovea resulting in four regions: the 5 mm circle comprised of a 1 mm circle, a 1.5 mm inner rim, and a 2.5 mm outer rim. Second column (B, F, J, and N): 6×6 mm choriocapillaris en face flow images after artifact removal and structural compensation. Third column (C, G, K, and O): 6×6 mm en face flow image after binarization, thresholding, and removal of flow deficits with diameter smaller than 24 μm. The white areas correspond to the flow deficits. Fourth column (D, H, L, and P): 6×6 mm en face flow deficit images with the circles used to measure the percentage of flow deficits within the regions. (A-P) Correspond to the same subjects shown in Figure 1. (A-D) Images from a 26-year-old subject. (E-H) Images from a 48-year-old subject. (I-L) Images from a 63-year-old subject. (M-P) Images from an 87-year-old subject.
Data were summarized with means, standard deviations, and ranges. Our aim was to use linear regression to create normal tolerance (prediction) limits for FD% for each scan type and region (3×3 mm scans: C1, R1.5, and C2.5; 6×6 mm scans: C1, R1.5, C2.5, R2.5, and C5) following our previously employed strategy.31 Inspection of data plots and regression residuals identified two problems: heteroscedasticity of variances in FD% between age groups, which was confirmed with Levene’s test, and departure from linearity of the relationship between FD% and age. Box-Cox analysis32 suggested square root transformation of the FD% to overcome this heteroscedasticity. To account for departures from linearity, we supplemented linear regression fits with two-slope piecewise fits using an inflection point at 50 years of age. To obtain clinically useful normal ranges, tolerance limits were back-transformed to the original FD% scale. The strength of associations between FD% for each scan and region with age and axial length were assessed with Pearson correlation coefficients. Statistical analyses were performed using the IBM Statistical Package for the Social Sciences (SPSS) software version 21 (IBM Corporation, Armonk, NY) and results with a P value less than 0.05 were considered to be statistically significant.
RESULTS
A total of 164 subjects with normal eyes were enrolled in the study. The distribution of eyes in each age group is shown in Table 1 and Table 2. The mean age was 56 years old (SD=19 years) ranging from 19 to 88 years old. Women comprised 56% of the studied population. The mean axial length of the analyzed eyes was 23.0 mm (SD=1.0 mm).
Table 1:
Percentage of choriocapillaris flow deficits in the 3×3 mm scans by decade of age.
| Age Group | |||||||
|---|---|---|---|---|---|---|---|
| Region Quantified |
19-29 N=18 |
30-39 N=23 |
40-49 N=22 |
50-59 N=23 |
60-69 N=28 |
70-79 N=31 |
80-89 N=19 |
| 1 mm Circle (SD) [range] | 6.0 (3.5) [1.3-12.2] | 9.1 (3.8) [4.0-20.6] | 12.3 (5.0) [3.4-20.8] | 15.5 (5.1) [6.9-25.4] | 16.4 (5.9) [5.3-26.4] | 22.0 (7.9) [8.1-39.0] | 23.0 (9.8) [12.1-51.1] |
| 1.5 mm Rim (SD) [range] | 7.4 (1.7) [5.3-11.5] | 9.3 (3.0) [4.3-16.6] | 11.1 (3.3) [4.9-18.4] | 12.8 (2.3) [9.4-19.1] | 13.7 (3.6) [6.6-20.4] | 14.2 (3.5) [5.9-21.9] | 15.8 (2.7) [11.8-22.3] |
| 2.5 mm Circle (SD) [range] | 7.2 (1.7) [4.9-11.3] | 9.2 (3.0) [4.8-17.2] | 11.3 (3.1) [4.7-16.5] | 13.3 (2.0) [10.6-17.7] | 14.2 (3.5) [6.4-21.0] | 15.5 (3.6) [7.2-24.5] | 17.0 (3.3) [12.8-27.2] |
Abbreviation: standard deviation, SD
Table 2:
Percentage of choriocapillaris flow deficits in the 6×6 mm scans by each decade of age.
| Age Group | |||||||
|---|---|---|---|---|---|---|---|
| Region Quantified |
19-29 N=18 |
30-39 N=23 |
40-49 N=22 |
50-59 N=23 |
60-69 N=28 |
70-79 N=31 |
80-89 N=19 |
| 1 mm Circle (SD) [range] | 5.4 (3.1) [0.9-11.8] | 6.7 (4.5) [0.6-15.9] | 9.7 (5.3) [3.3-23.9] | 14.4 (6.7) [1.7-29.4] | 14.5 (5.5) [4.4-25.3] | 17.9 (9.4) [4.6-42.3] | 20.4 (9.3) [8.7-39.8] |
| 1.5 mm Rim (SD) [range] | 5.6 (2.6) [2.2-11.6] | 8.3 (4.4) [1.7-17.4] | 10.0 (4.5) [3.0-18.8] | 13.1 (5.0) [4.2-27.7] | 13.0 (3.6) [4.8-19.7] | 13.0 (5.2) [4.6-29.2] | 13.5 (3.9) [6.8-21.3] |
| 2.5 mm Circle (SD) [range] | 5.6 (2.5) [1.9-10.5] | 8.0 (4.3) [1.6-16.4] | 10.0 (4.3) [3-19.1] | 13.3 (5.0) [3.8-27.0] | 13.2 (3.7) [4.8-20.2] | 13.8 (5.6) [5.3-30.6] | 14.7 (4.3) [7.6-24.4] |
| 2.5 mm Rim (SD) [range] | 3.3 (1.1) [1.8-5.3] | 5.3 (2.5) [2.1-10.6] | 6.7 (3.2) [2.5-12.1] | 7.7 (2.2) [3.6-11.4] | 8.4 (2.5) [2.3-15.4] | 7.6 (2.9) [3.2-15.6] | 8.1 (2.6) [4.3-14.5] |
| 5 mm Circle (SD) [range] | 3.9 (1.3) [1.8-6.6] | 6.0 (2.8) [2.2-12.1] | 7.6 (3.3) [2.7-12.1] | 9.2 (2.7) [3.7-13.6] | 9.6 (2.6) [3.0-16.6] | 9.3 (3.2) [4.2-16.6] | 9.8 (2.2) [5.4-15.0] |
Abbreviation: standard deviation, SD
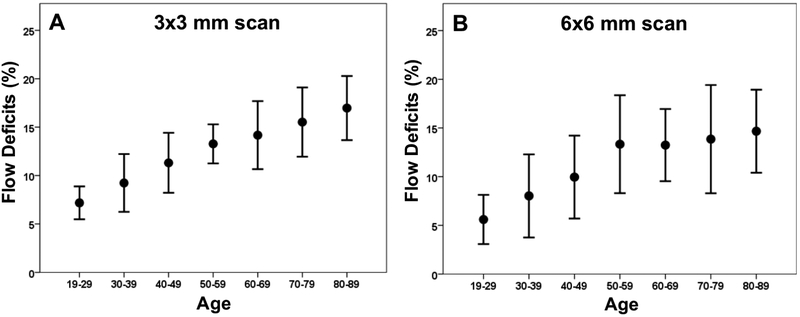
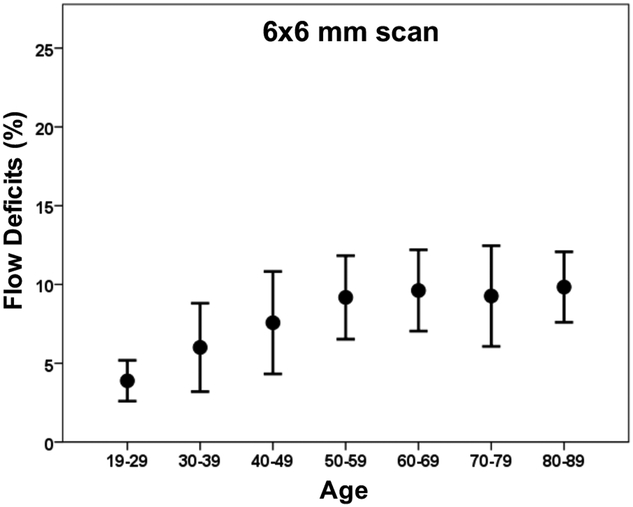
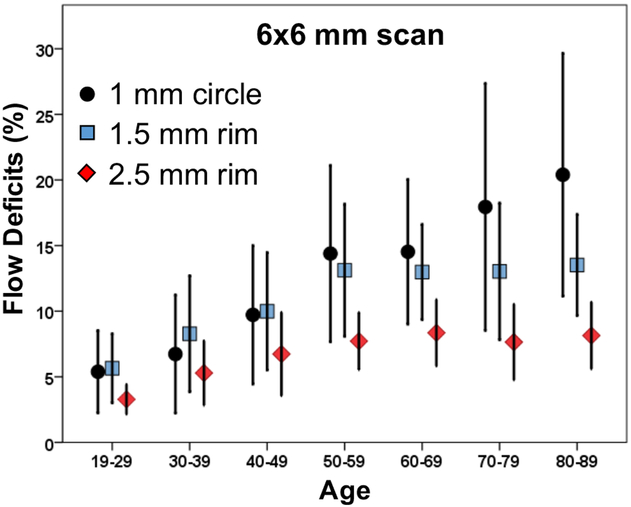
Increasing amounts of FDs were observed on both 3×3 mm and 6×6 mm CC images with age (Figures 1, 2), and the FDs appeared to increase predominantly in the central macular regions. The FD% measurements are shown in Tables 1 and Table 2 for a variety of circle and rim sizes by decade of age. Mean FD% of C2.5 increased with age in both the 3×3 mm and 6×6 mm scans (Figure 3). The same correlation could be observed in the C1 and R1.5 from both scans (Figure 4). The measurements of FD% in C2.5, C1, and R1.5 from both scans were comparable, but the 6×6 mm scan measurements were slightly smaller than the 3×3 mm scan measurements (Figure 5). For 6×6 mm scan measurements, the FD% in C5 increased with age, and the plot plateaued by the sixth decade of life (Figure 6). The flattening of this trend was due to the age dependent divergence between the changes in the center 2.5 mm (C1 and R1.5) and the 2.5 mm rim area (R2.5) (Figure 7). Moreover, the age-dependent increase in FD% appears to be largely driven by the central 1 mm circle centered on the fovea (Figure 7). Of note, larger standard deviations in the FD% were seen in the older groups compared with the younger groups for all the quantified regions, especially in 1mm central circle.
Figure 3: Relationship between the percentage of flow deficits and age within the 2.5 mm circles from the 3×3 mm scans and the 6×6 mm scans.
The average percentage of flow deficits within the 2.5 mm circles centered on the fovea and the corresponding standard deviations are plotted versus each decade of age. (A) 3×3 mm scan. (B) 6×6 mm scan.
Figure 4: Relationship between the percentage of flow deficits and age within the 1 mm circles and the 1.5 mm rims from the 3×3 mm scans and the 6×6 mm scans.
The average percentage of flow deficits within the 1 mm circles and the 1.5 mm rims centered on the fovea and the corresponding standard deviations are plotted versus each decade of age. (A) 3×3 mm scan. (B) 6×6 mm scan.
Figure 5: Comparison between the percentage of flow deficits in the 2.5 mm circles, 1 mm circles, and 1.5 mm rims from the 3×3 mm and 6×6 mm scans.
The average percentage of flow deficits are compared between the 3×3 mm and 6×6 mm scans for the 2.5 mm circles (A), 1 mm circles (B), and 1.5 mm rims (C) centered on the fovea.
Figure 6: Relationship between the percentage of flow deficits and age in the 5 mm circles from the 6×6 mm scans.
The average percentage of flow deficits within the 5 mm circles centered on the fovea and the corresponding standard deviations are plotted versus each decade of age.
Figure 7: Relationship between the percentage of flow deficits and age within the 1 mm circles, 1.5 mm rims, and 2.5 mm rims from the 6×6 mm scans.
The average percentage of flow deficits within the 1 mm circles, the 1.5 mm rims, and the 2.5 mm rims centered on the fovea and the corresponding standard deviations are plotted versus each decade of age.
For each scan and region, linear regression models using the square root FD% with respect to age were fitted, and highly significant relationships for each parameter were found (all P<0.001). Correlation coefficients from the linear regression fits can be found in the supplemental Table S1. However, three parameters in the 6×6 mm scan displayed significant deviation from a linear fit (R1.5, P=0.029; R2.5, P=0.002; C5, P=0.004). For these three parameters, piece-wise regression models with an inflection point at 50 years of age were fitted and the slope relating FD% to age was not different from zero after the age of 50 (all P>0.25; Table S2). Normal tolerance limits for these parameters obtained from piecewise regression differed only modestly from those of the linear regression fits, and we recommend the use of the latter for all parameters (Table 3).
Table 3:
95% Normal range of flow deficit percentages by each decade of age.
| Age Group | ||||||||
|---|---|---|---|---|---|---|---|---|
| Scan pattern |
Regions Quantified |
19-29 | 30-39 | 40-49 | 50-59 | 60-69 | 70-79 | 80-89 |
| 3×3 mm Scan | 1 mm Circle | 1-18 | 2-21 | 3-25 | 4-29 | 6-34 | 8-39 | 10-43 |
| 1.5 mm Rim | 3-14 | 4-16 | 5-18 | 6-19 | 7-21 | 8-23 | 9-25 | |
| 2.5 mm Circle | 3-14 | 4-16 | 5-18 | 7-20 | 8-22 | 9-24 | 11-26 | |
| 6×6 mm Scan | 1 mm Circle | 0-18 | 0-21 | 1-25 | 2-29 | 3-33 | 5-38 | 6-42 |
| 1.5 mm Rim | 1-16 | 2-18 | 2-20 | 3-22 | 4-24 | 5-26 | 6-28 | |
| 2.5 mm Circle | 1-16 | 2-18 | 2-20 | 3-22 | 4-25 | 5-27 | 7-30 | |
| 2.5 mm Rim | 1-10 | 1-11 | 2-12 | 2-13 | 3-14 | 3-16 | 4-17 | |
| 5 mm Circle | 1-11 | 2-12 | 2-13 | 3-15 | 3-16 | 4-18 | 5-19 | |
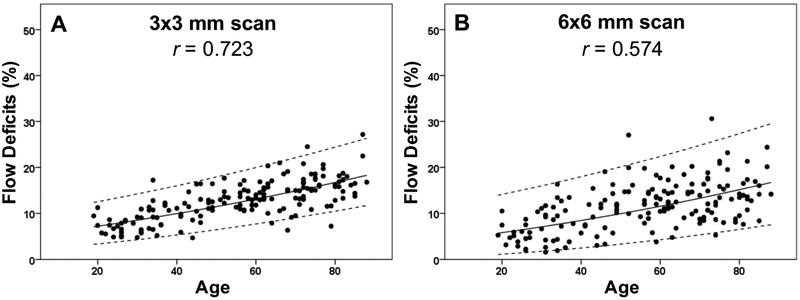
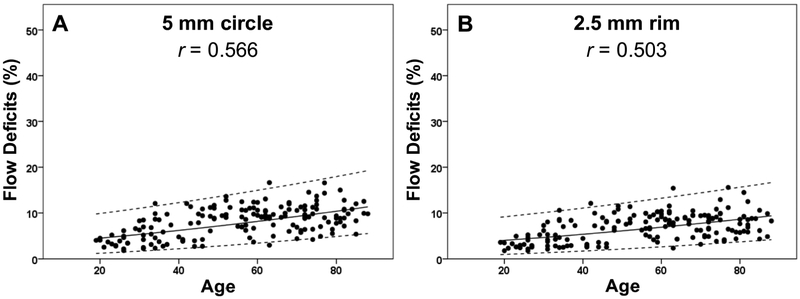
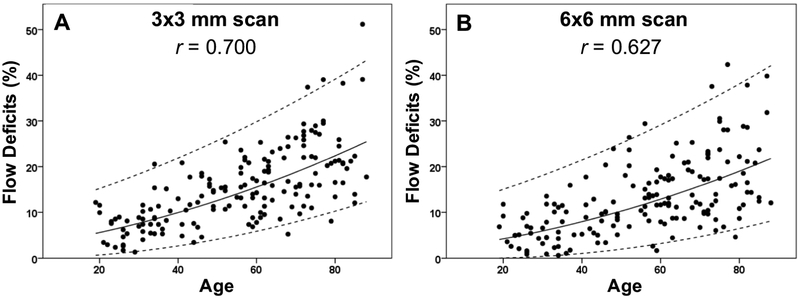
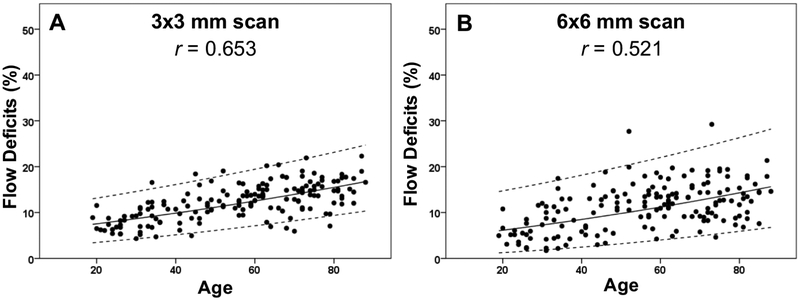
Figures 8-11 show the linear regression models for the results along with the 95% normal limits after back-transformation of the data. Based on the linear fit of the square root FD% and age, Table 3 shows the 95% normal FD% range for each region of the macula according to decade of age (Table 3). A statistically significant effect of hypertension was found on the normal FD% at all locations with both scan sizes (P ranging from 0.026 to <0.001), but these relationships disappeared after accounting for the more highly significant effect of age. Of note, for the 3×3 mm scans, the correlations between axial length and FD% for the R1.5 and C2.5 regions were small but significant (both r= −0.18, both P=0.02). For all the other regions, including the C1 in the 3×3 mm scans and the C1, R1.5, C2.5, R2.5, C5 in the 6×6 mm scans, there was no significant correlation between axial length and FD% (all ∣r∣0.3, all P>0.05).
Figure 8: Adjusted scatter plots showing all the flow deficit percentages in the 2.5 mm circles with the 95% normal limits from the 3×3 mm scans and the 6×6 mm scans.
The solid line is the linear regression line after Y-axis back transformed from the square root of the flow deficit percentages. The dash lines represent the 95% normal limits. The correlation coefficient is r. (A) 3×3 mm scan. (B) 6×6 mm scan.
Figure 11: Adjusted scatter plots showing all the flow deficit percentages in the 5 mm circles and the 2.5 mm rims with the 95% normal limits from the 6×6 mm scans.
The solid line is the linear regression line after Y-axis back transformed from the square root of the flow deficit percentages. The dash lines represent the 95% normal limits. The correlation coefficient is r. (A) 5 mm circle. (B) 2.5 mm rim.
DISCUSSION
In the current study, SS-OCTA imaging of the CC in normal eyes over many decades of life showed that the FD% within the macula increases with age and the greatest increase was found in the central 1 mm circle of the macula. While the impact of age on normal CC perfusion is not a new finding since a significant negative correlation between age and CC density was shown histologically back in 1994,2 our study demonstrated this correlation in vivo using a commercially available SS-OCTA instrument. Moreover, we showed that the greatest perfusion abnormality occurred in the center of the macula. We also noted that the variability of the FD% measurements increased with age. Explanations for why the central macula preferentially loses CC perfusion with age and why the variability of FD% increases with age are not known at this time, but most likely they will be associated with underlying systemic conditions such as hypertension and cardiovascular disease. In our study, we did not document the underlying health status of all subjects. No doubt, future studies will explore the association between a subject’s overall health and CC perfusion.
The preferential decrease of CC perfusion in the central macula with age raises some intriguing possibilities when it comes to AMD. This age-dependent decrease in perfusion may explain why the central macula appears to be uniquely susceptible to neovascularization in AMD. Perhaps, in individuals with a genetic risk for developing AMD, the preferential loss of the CC perfusion with age in the central macula predisposes to macular neovascularization (MNV), or this genetic susceptibility may exacerbate the formation of FDs and increase the risk of MNV. While this central macular region may be uniquely susceptible to ischemia-induced neovascularization,33-35 it does not appear to be the area most susceptible to the formation of GA in AMD, which usually arises in the parafoveal macula.36-38 Future studies of the CC in AMD and other macular diseases may help to identify the forces responsible to the changes that lead to vision loss in specific diseases as compared with changes related to normal aging. Perhaps the changes in CC perfusion are associated with disease may be analogous to accelerated aging of the CC. By understanding the CC in normal aging and disease, we hope to develop better diagnostic imaging strategies that may predict disease onset and progression, as well develop better imaging endpoints for clinical trials.
Several studies have investigated the CC in retinal diseases using OCTA. Using SD-OCTA imaging, Nesper et al. reported that eyes with reticular pseudodrusen (RPD) had significantly larger areas of decreased CC perfusion compared with eyes with drusen and no RPD,18 which was consistent with findings of two other groups.39 Borrelli et al. reported that eyes with intermediate AMD in which the fellow eye had neovascular AMD showed an increase in the average CC flow void size compared with intermediate AMD eyes that didn’t have neovascular AMD in the fellow eye.19,40 Sacconi et al. found CC impairment surrounding GA margin which preceded RPE alterations at fundus autofluorescence.41 In addition, other research groups have shown macular CC alterations in DR,20,42 central serous chorioretinopathy,21 macular holes,22 Bietti crystalline dystrophy,43 choroidal naevi,23,44 hamartomas,45 hypertensive choroidopathy,46 pseudoxanthoma elasticum,47 and uveitis.48,49 Some studies even used SD-OCTA systems to monitoring CC changes after pars plana vitrectomy and photodynamic therapy.50-52 However, one of the limitations of SD-OCTA is its laser wavelength of 850 nm, which is highly scattered by the RPE and results in significant sensitivity roll-off when imaging beneath the RPE.53 Moreover, in the presence of drusen, the attenuation of SD-OCT signal becomes even more obvious with false-positive flow impairment appearing under drusen with SD-OCTA imaging that were not present using SS-OCTA imaging.14,28
SS-OCTA has advantages when it comes to imaging the CC. With a longer and safer laser wavelength of 1060 nm, there is less scattering of the light by the RPE, less sensitivity roll-off into the choroid, and a higher laser power can be used so that the CC can be imaged with a better signal to noise ratio. Moreover, with a faster scanning rate of 100,000 A-scans per second, denser scan patterns with closer spacing of A-scans and B-scans can be obtained, for a given field of view and acquisition time, compared with those obtained using a SD-OCTA instrument and this denser scan pattern results in better image quality. With the commercial availability of SS-OCTA instruments, reliable CC imaging is now possible and strategies have been developed to increase the quality of the images by improving the signal to noise of the images through averaging of multiple scans,54 and by developing novel algorithms that remove retinal projection artifacts, that compensate for any signal reduction due to shadowing from overlying structural abnormalities in the RPE/Bruch’s membrane complex such as the shadowing from drusen, and that threshold the images to remove noise.24
In this study, we excluded subjects with a refraction greater than −6D or axial length longer than 26 mm to avoid results that could be related to high myopia rather than aging. Interestingly, a recent report described increased FDs of the CC in myopic eyes using SD-OCTA.55 However, within the range of axial lengths studied, we did not find a strong influence of axial length on the FD% in the CC. Even though the P values of axial length and FD% in R1.5 and C2.5 of 3×3 mm scans were 0.02, which are statistically significant, the correlation coefficients were too small to be clinically significant. It is interesting that we previously demonstrated a negative correlation between choroidal thickness and axial length,31 and we were expecting a similar correlation between FD% and axial length since CC perfusion and choroidal thickness are both part of the choroidal circulation. However, our results are consistent with other studies that have shown no correlation between the CC and subfoveal choroidal thickness.56,57
The major limitation of this study is the lack of detailed medical histories on all patients, particularly the lack of documenting cardiovascular disease status, the severity of hypertension, and the medications being taken by the subjects. Another limitation is our reliance on a single SS-OCTA scan. Recent studies have shown that imaging of the CC can be improved by averaging multiple scans,25,54 and future studies will incorporate this averaging strategy. In addition, we used a fixed global threshold to identify the flow deficits in all the cases. The threshold was generated from the CC images obtained from 20 eyes randomly chosen from subjects with ages in their 20s to 30s. While such a strategy was shown to produce measurements of flow deficits with good repeatability, both in normal and drusen cases,24 it is possible that a global threshold might fail to properly identify some FDs due to local signal variation within the scanned region. This potential issue should be mitigated here by our normalization of the images, as well as by the use of the structural signal to compensate for local signal variations. Further development and refinement of the algorithm with the adoption of an appropriate local thresholding technique may possibly result in improvements in the accuracy of the FDs measurements.
In summary, we found that CC FDs within the macula had a statistically significant negative correlation with increasing age and the FDs increased preferentially in the central macula. We were able to establish the 95% normal FD ranges for different decades of life for both the 3×3 mm and 6×6 mm scans using the commercially available SS-OCTA system. By understanding the changes that occur in the CC with normal aging, we now have the confidence to investigate and identify the disease-specific changes in the CC that arise in macular diseases.
Supplementary Material
Figure 9: Adjusted scatter plots showing all the flow deficit percentages in the 1 mm circles with the 95% normal limits from the 3×3 mm scans and the 6×6 mm scans.
The solid line is the linear regression line after Y-axis back transformed from the square root of the flow deficit percentages. The dash lines represent the 95% normal limits. The correlation coefficient is r. (A) 3×3 mm scan. (B) 6×6 mm scan.
Figure 10: Adjusted scatter plots showing all the flow deficit percentages in the 1.5 mm rims with the 95% normal limits from the 3×3 mm scans and the 6×6 mm scans.
The solid line is the linear regression line after Y-axis back transformed from the square root of the flow deficit percentages. The dash lines represent the 95% normal limits. The correlation coefficient is r. (A) 3×3 mm scan. (B) 6×6 mm scan.
ACKNOWLEDGMENTS/DISCLOSURES:
a. Funding/Support: Research supported by grants from Carl Zeiss Meditec, Inc. (Dublin, CA), the National Eye Institute (R01EY024158, R01EY028753), the Salah Foundation, an unrestricted grant from the Research to Prevent Blindness, Inc., New York, NY, and the National Eye Institute Center Core Grant (P30EY014801) to the Department of Ophthalmology, University of Miami Miller School of Medicine. The funding organization had no role in the design or conduct of this research.
b. Financial Disclosures: Dr. Gregori, Dr. Wang and Dr. Rosenfeld received research support from Carl Zeiss Meditec, Inc.
Dr. Gregori and the University of Miami co-own a patent that is licensed to Carl Zeiss Meditec, Inc.
Dr. Rosenfeld also received additional research support from Genentech and Tyrogenex. He is a consultant for Achillion Pharmaceuticals, Boehringer-Ingelheim, Carl Zeiss Meditec, Chengdu Kanghong Biotech, Ocunexus Therapeutics, Genentech, Healios K.K, Hemera Biosciences, F. Hoffmann-La Roche Ltd., Isarna Pharmaceuticals, Lin Bioscience, NGM Biopharmaceuticals, Ocunexus, Ocudyne, Tyrogenex, and Unity Biotechnology. Dr. Rosenfeld as has equity interest in Apellis, Verana Health, and Ocudyne.
Dr. Wang discloses intellectual property owned by the Oregon Health and Science University and the University of Washington related to OCT angiography, and licensed to commercial entities, which are related to the technology and analysis methods described in parts of this manuscript. Dr. Wang also receives research support from Tasso Inc. He is a consultant to Insight Photonic Solutions, and Kowa.
Drs. de Sisternes and Durbin are employed by Carl Zeiss Meditec, Inc.
Drs. Zheng, Zhang, Shi, Russell, Motulsky, Banta, Chen, and Patel have no disclosures. Miss. Chu and Mr. Feuer have no disclosures.
Footnotes
Publisher's Disclaimer: This is a PDF file of an unedited manuscript that has been accepted for publication. As a service to our customers we are providing this early version of the manuscript. The manuscript will undergo copyediting, typesetting, and review of the resulting proof before it is published in its final citable form. Please note that during the production process errors may be discovered which could affect the content, and all legal disclaimers that apply to the journal pertain.
REFERENCES
- 1.Nickla DL, Wallman J. The multifunctional choroid. Prog Retin Eye Res. 2010;29(2):144–168. [DOI] [PMC free article] [PubMed] [Google Scholar]
- 2.Ramrattan RS, van der Schaft TL, Mooy CM, de Bruijn WC, Mulder PG, de Jong PT. Morphometric analysis of Bruch's membrane, the choriocapillaris, and the choroid in aging. Invest Ophthalmol Vis Sci. 1994;35(6):2857–2864. [PubMed] [Google Scholar]
- 3.Sarks JP, Sarks SH, Killingsworth MC. Evolution of geographic atrophy of the retinal pigment epithelium. Eye. 1988;2 ( Pt 5):552–577. [DOI] [PubMed] [Google Scholar]
- 4.McLeod DS, Grebe R, Bhutto I, Merges C, Baba T, Lutty GA. Relationship between RPE and choriocapillaris in age-related macular degeneration. Invest Ophthalmol Vis Sci. 2009;50(10):4982–4991. [DOI] [PMC free article] [PubMed] [Google Scholar]
- 5.Cao J, McLeod S, Merges CA, Lutty GA. Choriocapillaris degeneration and related pathologic changes in human diabetic eyes. Arch Ophthalmol. 1998;116(5):589–597. [DOI] [PubMed] [Google Scholar]
- 6.Mullins RF, Johnson MN, Faidley EA, Skeie JM, Huang J. Choriocapillaris vascular dropout related to density of drusen in human eyes with early age-related macular degeneration. Invest Ophthalmol Vis Sci. 2011;52(3):1606–1612. [DOI] [PMC free article] [PubMed] [Google Scholar]
- 7.Pauleikhoff D, Spital G, Radermacher M, Brumm GA, Lommatzsch A, Bird AC. A fluorescein and indocyanine green angiographic study of choriocapillaris in age-related macular disease. Arch Ophthalmol. 1999;117(10):1353–1358. [DOI] [PubMed] [Google Scholar]
- 8.Choi W, Mohler KJ, Potsaid B, et al. Choriocapillaris and choroidal microvasculature imaging with ultrahigh speed OCT angiography. PLoS One. 2013;8(12):e81499. [DOI] [PMC free article] [PubMed] [Google Scholar]
- 9.Olver JM. Functional anatomy of the choroidal circulation: methyl methacrylate casting of human choroid. Eye. 1990;4 ( Pt 2):262–272. [DOI] [PubMed] [Google Scholar]
- 10.Choi W, Moult EM, Waheed NK, et al. Ultrahigh-Speed, Swept-Source Optical Coherence Tomography Angiography in Nonexudative Age-Related Macular Degeneration with Geographic Atrophy. Ophthalmology. 2015;122(12):2532–2544. [DOI] [PMC free article] [PubMed] [Google Scholar]
- 11.Choi W, Waheed NK, Moult EM, et al. Ultrahigh Speed Swept Source Optical Coherence Tomography Angiography of Retinal and Choriocapillaris Alterations in Diabetic Patients with and without Retinopathy. Retina. 2017;37(1):11–21. [DOI] [PMC free article] [PubMed] [Google Scholar]
- 12.Moult EM, Waheed NK, Novais EA, et al. Swept-Source Optical Coherence Tomography Angiography Reveals Choriocapillaris Alterations in Eyes with Nascent Geographic Atrophy and Drusen-Associated Geographic Atrophy. Retina. 2016;36 Suppl 1:S2–S11. [DOI] [PMC free article] [PubMed] [Google Scholar]
- 13.Moreira-Neto CA, Moult EM, Fujimoto JG, Waheed NK, Ferrara D. Choriocapillaris Loss in Advanced Age-Related Macular Degeneration. J Ophthalmol. 2018;2018:8125267. [DOI] [PMC free article] [PubMed] [Google Scholar]
- 14.Waheed NK, Moult EM, Fujimoto JG, Rosenfeld PJ. Optical Coherence Tomography Angiography of Dry Age-Related Macular Degeneration. Dev Ophthalmol. 2016;56:91–100. [DOI] [PMC free article] [PubMed] [Google Scholar]
- 15.Kurokawa K, Liu Z, Miller DT. Adaptive optics optical coherence tomography angiography for morphometric analysis of choriocapillaris [Invited]. Biomed Opt Express. 2017;8(3):1803–1822. [DOI] [PMC free article] [PubMed] [Google Scholar]
- 16.Gorczynska I, Migacz JV, Jonnal R, Zawadzki RJ, Poddar R, Werner JS. Imaging of the human choroid with a 1.7 MHz A-scan rate FDML swept source OCT system. Proc Spie. 2017;10045. [Google Scholar]
- 17.Spaide RF. Choriocapillaris Flow Features Follow a Power Law Distribution: Implications for Characterization and Mechanisms of Disease Progression. Am J Ophthalmol. 2016;170:58–67. [DOI] [PubMed] [Google Scholar]
- 18.Nesper PL, Soetikno BT, Fawzi AA. Choriocapillaris Nonperfusion is Associated With Poor Visual Acuity in Eyes With Reticular Pseudodrusen. Am J Ophthalmol. 2017;174:42–55. [DOI] [PMC free article] [PubMed] [Google Scholar]
- 19.Borrelli E, Uji A, Sarraf D, Sadda SR. Alterations in the Choriocapillaris in Intermediate Age-Related Macular Degeneration. Invest Ophthalmol Vis Sci. 2017;58(11):4792–4798. [DOI] [PubMed] [Google Scholar]
- 20.Nesper PL, Roberts PK, Onishi AC, et al. Quantifying Microvascular Abnormalities With Increasing Severity of Diabetic Retinopathy Using Optical Coherence Tomography Angiography. Invest Ophthalmol Vis Sci. 2017;58(6):BIO307–BIO315. [DOI] [PMC free article] [PubMed] [Google Scholar]
- 21.Qu Y, Gong D, Yu W, Dong F. Characteristics of the Choriocapillaris Layer in Optical Coherence Tomography Angiography of Acute Central Serous Chorioretinopathy. Ophthalmic Surg Lasers Imaging Retina. 2017;48(12):1000–1005. [DOI] [PubMed] [Google Scholar]
- 22.Ahn J, Yoo G, Kim JT, Kim SW, Oh J. Choriocapillaris layer imaging with swept-source optical coherence tomography angiography in lamellar and full-thickness macular hole. Graefes Arch Clin Exp Ophthalmol. 2018;256(1):11–21. [DOI] [PubMed] [Google Scholar]
- 23.Ali ZC, Gray J, Balaskas K. Features of choroidal naevi on swept source optical coherence tomography angiography and structural reverse flow optical coherence tomography. Graefes Arch Clin Exp Ophthalmol. 2018;256(7):1319–1323. [DOI] [PubMed] [Google Scholar]
- 24.Zhang Q, Zheng F, Motulsky EH, et al. A Novel Strategy for Quantifying Choriocapillaris Flow Voids Using Swept-Source OCT Angiography. Invest Ophthalmol Vis Sci. 2018;59(1):203–211. [DOI] [PMC free article] [PubMed] [Google Scholar]
- 25.Zhang Q, Shi Y, Zhou H, et al. Accurate estimation of choriocapillaris flow deficits beyond normal intercapillary spacing with swept source OCT angiography. Quant Imaging Med Surg. 2018;8(7):658–666. [DOI] [PMC free article] [PubMed] [Google Scholar]
- 26.Zhang Q, Zhang A, Lee CS, et al. Projection artifact removal improves visualization and quantitation of macular neovascularization imaged by optical coherence tomography angiography. Ophthalmol Retina. 2017;1(2):124–136. [DOI] [PMC free article] [PubMed] [Google Scholar]
- 27.Moult E, Choi W, Waheed NK, et al. Ultrahigh-speed swept-source OCT angiography in exudative AMD. Ophthalmic Surg Lasers Imaging Retina. 2014;45(6):496–505. [DOI] [PMC free article] [PubMed] [Google Scholar]
- 28.Lane M, Moult EM, Novais EA, et al. Visualizing the Choriocapillaris Under Drusen: Comparing 1050-nm Swept-Source Versus 840-nm Spectral-Domain Optical Coherence Tomography Angiography. Invest Ophthalmol Vis Sci. 2016;57(9):OCT585–590. [DOI] [PMC free article] [PubMed] [Google Scholar]
- 29.Zhang A, Zhang Q, Wang RK. Minimizing projection artifacts for accurate presentation of choroidal neovascularization in OCT micro-angiography. Biomed Opt Express. 2015;6(10):4130–4143. [DOI] [PMC free article] [PubMed] [Google Scholar]
- 30.Wang F, Gregori G, Rosenfeld PJ, Lujan BJ, Durbin MK, Bagherinia H. Automated detection of the foveal center improves SD-OCT measurements of central retinal thickness. Ophthalmic Surg Lasers Imaging. 2012;43(6 Suppl):S32–37. [DOI] [PubMed] [Google Scholar]
- 31.Abbey AM, Kuriyan AE, Modi YS, et al. Optical coherence tomography measurements of choroidal thickness in healthy eyes: correlation with age and axial length. Ophthalmic Surg Lasers Imaging Retina. 2015;46(1):18–24. [DOI] [PubMed] [Google Scholar]
- 32.Box GEP, Draper NR. Empirical model building and response surfaces. New York: Wiley & Sons; 1987. [Google Scholar]
- 33.Shweiki D, Itin A, Soffer D, Keshet E. Vascular endothelial growth factor induced by hypoxia may mediate hypoxia-initiated angiogenesis. Nature. 1992;359(6398):843–845. [DOI] [PubMed] [Google Scholar]
- 34.Shima DT, Adamis AP, Ferrara N, et al. Hypoxic induction of endothelial cell growth factors in retinal cells: identification and characterization of vascular endothelial growth factor (VEGF) as the mitogen. Mol Med. 1995;1(2):182–193. [PMC free article] [PubMed] [Google Scholar]
- 35.Grunwald JE, Metelitsina TI, Dupont JC, Ying GS, Maguire MG. Reduced foveolar choroidal blood flow in eyes with increasing AMD severity. Invest Ophthalmol Vis Sci. 2005;46(3):1033–1038. [DOI] [PubMed] [Google Scholar]
- 36.Fleckenstein M, Mitchell P, Freund KB, et al. The Progression of Geographic Atrophy Secondary to Age-Related Macular Degeneration. Ophthalmology. 2018; 125(3):369–390. [DOI] [PubMed] [Google Scholar]
- 37.Lindner M, Boker A, Mauschitz MM, et al. Directional Kinetics of Geographic Atrophy Progression in Age-Related Macular Degeneration with Foveal Sparing. Ophthalmology. 2015;122(7):1356–1365. [DOI] [PubMed] [Google Scholar]
- 38.Sunness JS, Rubin GS, Zuckerbrod A, Applegate CA. Foveal-Sparing Scotomas in Advanced Dry Age-Related Macular Degeneration. J Vis Impair Blind. 2008;102(10):600–610. [PMC free article] [PubMed] [Google Scholar]
- 39.Chatziralli I, Theodossiadis G, Panagiotidis D, Pousoulidi P, Theodossiadis P. Choriocapillaris' alterations in the presence of reticular pseudodrusen compared to drusen: study based on OCTA findings. Int Ophthalmol. 2018;38(5):1887–1893. [DOI] [PubMed] [Google Scholar]
- 40.Alten F, Heiduschka P, Clemens CR, Eter N. Exploring choriocapillaris under reticular pseudodrusen using OCT-Angiography. Graefes Arch Clin Exp Ophthalmol. 2016;254(11):2165–2173. [DOI] [PubMed] [Google Scholar]
- 41.Sacconi R, Corbelli E, Carnevali A, Querques L, Bandello F, Querques G. Optical Coherence Tomography Angiography in Geographic Atrophy. Retina. 2018;38(12):2350–2355. [DOI] [PubMed] [Google Scholar]
- 42.Conti FF, Qin VL, Rodrigues EB, et al. Choriocapillaris and retinal vascular plexus density of diabetic eyes using split-spectrum amplitude decorrelation spectral-domain optical coherence tomography angiography. Br J Ophthalmol. 2018. [DOI] [PubMed] [Google Scholar]
- 43.Miyata M, Oishi A, Hasegawa T, et al. Choriocapillaris flow deficit in Bietti crystalline dystrophy detected using optical coherence tomography angiography. Br J Ophthalmol. 2018;102(9):1208–1212. [DOI] [PubMed] [Google Scholar]
- 44.Ghassemi F, Mirshahi R, Fadakar K, Sabour S. Optical coherence tomography angiography in choroidal melanoma and nevus. Clin Ophthalmol. 2018; 12:207–214. [DOI] [PMC free article] [PubMed] [Google Scholar]
- 45.Arrigo A, Corbelli E, Aragona E, et al. Optical Coherence Tomography and Optical Coherence Tomography Angiography Evaluation of Combined Hamartoma of the Retina and Retinal Pigment Epithelium. Retina. 2018. [DOI] [PubMed] [Google Scholar]
- 46.Saito M, Ishibazawa A, Kinouchi R, Yoshida A. Reperfusion of the choriocapillaris observed using optical coherence tomography angiography in hypertensive choroidopathy. Int Ophthalmol. 2018;38(5):2205–2210. [DOI] [PubMed] [Google Scholar]
- 47.Spaide RF. Choriocapillaris Signal Voids in Maternally Inherited Diabetes and Deafness and in Pseudoxanthoma Elasticum. Retina. 2017;37(11):2008–2014. [DOI] [PubMed] [Google Scholar]
- 48.Kim EL, Thanos A, Yonekawa Y, et al. Optical Coherence Tomography Angiography Findings in Punctate Inner Choroidopathy. Ophthalmic Surg Lasers Imaging Retina. 2017;48(10):786–792. [DOI] [PubMed] [Google Scholar]
- 49.Yannuzzi NA, Swaminathan SS, Zheng F, et al. Swept-Source OCT Angiography Shows Sparing of the Choriocapillaris in Multiple Evanescent White Dot Syndrome. Ophthalmic Surg Lasers Imaging Retina. 2017;48(1):69–74. [DOI] [PubMed] [Google Scholar]
- 50.Yu Y, Teng Y, Gao M, Liu X, Chen J, Liu W. Quantitative Choriocapillaris Perfusion Before and After Vitrectomy in Idiopathic Epiretinal Membrane by Optical Coherence Tomography Angiography. Ophthalmic Surg Lasers Imaging Retina. 2017;48(11):906–915. [DOI] [PubMed] [Google Scholar]
- 51.Nassisi M, Lavia C, Alovisi C, Musso L, Eandi CM. Short-Term Choriocapillaris Changes in Patients with Central Serous Chorioretinopathy after Half-Dose Photodynamic Therapy. Int J Mol Sci. 2017;18(11). [DOI] [PMC free article] [PubMed] [Google Scholar]
- 52.Demircan A, Yesilkaya C, Alkin Z. Early choriocapillaris changes after half-fluence photodynamic therapy in chronic central serous chorioretinopathy evaluated by optical coherence tomography angiography: Preliminary results. Photodiagnosis Photodyn Ther. 2018;21:375–378. [DOI] [PubMed] [Google Scholar]
- 53.Potsaid B, Gorczynska I, Srinivasan VJ, et al. Ultrahigh speed spectral / Fourier domain OCT ophthalmic imaging at 70,000 to 312,500 axial scans per second. Opt Express. 2008;16(19):15149–15169. [DOI] [PMC free article] [PubMed] [Google Scholar]
- 54.Uji A, Balasubramanian S, Lei J, Baghdasaryan E, Al-Sheikh M, Sadda SR. Choriocapillaris Imaging Using Multiple En Face Optical Coherence Tomography Angiography Image Averaging. JAMA Ophthalmol. 2017;135(11):1197–1204. [DOI] [PMC free article] [PubMed] [Google Scholar]
- 55.Al-Sheikh M, Phasukkijwatana N, Dolz-Marco R, et al. Quantitative OCT Angiography of the Retinal Microvasculature and the Choriocapillaris in Myopic Eyes. Invest Ophthalmol Vis Sci. 2017;58(4):2063–2069. [DOI] [PubMed] [Google Scholar]
- 56.Al-Sheikh M, Falavarjani KG, Pfau M, Uji A, Le PP, Sadda SR. Quantitative Features of the Choriocapillaris in Healthy Individuals Using Swept-Source Optical Coherence Tomography Angiography. Ophthalmic Surg Lasers Imaging Retina. 2017;48(8):623–631. [DOI] [PubMed] [Google Scholar]
- 57.Wang Q, Chan S, Yang JY, et al. Vascular Density in Retina and Choriocapillaris as Measured by Optical Coherence Tomography Angiography. Am J Ophthalmol. 2016;168:95–109. [DOI] [PubMed] [Google Scholar]
Associated Data
This section collects any data citations, data availability statements, or supplementary materials included in this article.


