

Abstract
Background
Influenza vaccinations are currently recommended in the care of people with COPD, but these recommendations are based largely on evidence from observational studies, with very few randomised controlled trials (RCTs) reported. Influenza infection causes excess morbidity and mortality in people with COPD, but there is also the potential for influenza vaccination to cause adverse effects, or not to be cost effective.
Objectives
To determine whether influenza vaccination in people with COPD reduces respiratory illness, reduces mortality, is associated with excess adverse events, and is cost effective.
Search methods
We searched the Cochrane Airways Trials Register, two clinical trials registries, and reference lists of articles. A number of drug companies we contacted also provided references. The latest search was carried out in December 2017.
Selection criteria
RCTs that compared live or inactivated virus vaccines with placebo, either alone or with another vaccine, in people with COPD.
Data collection and analysis
Two review authors independently extracted data. All entries were double‐checked. We contacted study authors and drug companies for missing information. We used standard methods expected by Cochrane.
Main results
We included 11 RCTs with 6750 participants, but only six of these included people with COPD (2469 participants). The others were conducted on elderly and high‐risk individuals, some of whom had chronic lung disease. Interventions compared with placebo were inactivated virus injections and live attenuated intranasal virus vaccines. Some studies compared intra‐muscular inactivated vaccine and intranasal live attenuated vaccine with intra‐muscular inactivated vaccine and intranasal placebo. Studies were conducted in the UK, USA and Thailand.
Inactivated vaccine reduced the total number of exacerbations per vaccinated participant compared with those who received placebo (mean difference (MD) –0.37, 95% confidence interval (CI) –0.64 to –0.11; P = 0.006; two RCTs, 180 participants; low quality evidence). This was due to the reduction in 'late' exacerbations, occurring after three or four weeks (MD –0.39, 95% CI –0.61 to –0.18; P = 0.0004; two RCTs, 180 participants; low quality evidence). Both in people with COPD, and in older people (only a minority of whom had COPD), there were significantly more local adverse reactions in people who had received the vaccine, but the effects were generally mild and transient.
There was no evidence of an effect of intranasal live attenuated virus when this was added to inactivated intramuscular vaccination.
Two studies evaluating mortality for influenza vaccine versus placebo were too small to have detected any effect on mortality. However, a large study (N=2215) noted that there was no difference in mortality when adding live attenuated virus to inactivated virus vaccination,
Authors' conclusions
It appeared, from the limited number of RCTs we were able to include, all of which were more than a decade old, that inactivated vaccine reduced exacerbations in people with COPD. The size of effect was similar to that seen in large observational studies, and was due to a reduction in exacerbations occurring three or more weeks after vaccination, and due to influenza. There was a mild increase in transient local adverse effects with vaccination, but no evidence of an increase in early exacerbations. Addition of live attenuated virus to the inactivated vaccine was not shown to confer additional benefit.
Plain language summary
Influenza vaccine for people with chronic obstructive pulmonary disease (COPD)
Question
Do influenza vaccines reduce episodes of respiratory illness or death in people with chronic obstructive pulmonary disease (COPD)?
Background
COPD is an umbrella term used to describe progressive lung diseases, including emphysema, chronic bronchitis, and refractory (non‐reversible) asthma. The disease is characterized by increasing breathlessness. Despite the almost universal recommendation that people with COPD should receive an annual influenza vaccination, very few randomised controlled trials (studies in which a number of similar people are randomly assigned to two (or more) groups to test a specific drug, treatment or other intervention) have evaluated the effect of this treatment. Influenza vaccines may be produced with an inactivated virus (small particles of the virus wall) or live attenuated virus (reduced power but still alive).
To try to answer our question, we conducted a detailed search for studies from around the world that investigated the use of influenza vaccines for people with COPD.
Study characteristics
We included six studies with 2469 participants with COPD, and a further five studies with 4281 older or high risk participants, a proportion of whom had chronic lung disease.
Key resuIts
We found some moderate‐quality evidence that inactivated influenza vaccine did decrease 'flare ups' of COPD, especially those that are related to the influenza virus itself. The inactivated influenza virus vaccine was given as an injection in the muscle, and was associated with an increase in local side effects (such as pain) at the site of injection, which were short‐lived. The inactivated virus vaccine did not cause influenza, or any significant worsening of COPD. Adding a live attenuated virus to the inactivated virus did not add any further protection for the participants.
Quality of the evidence
The evidence was of moderate quality. There have been no new trials since 2004. We conducted the last literature search in December 2017.
Summary of findings
Summary of findings for the main comparison. Influenza vaccine compared to placebo for chronic obstructive pulmonary disease (COPD).
| Influenza vaccine compared to placebo for chronic obstructive pulmonary disease (COPD) | ||||||
| Patient or population: chronic obstructive pulmonary disease (COPD) Setting: community Intervention: inactivated influenza vaccine Comparison: placebo | ||||||
| Outcomes | Anticipated absolute effects* (95% CI) | Relative effect (95% CI) | № of participants (studies) | Certainty of the evidence (GRADE) | Comments | |
| Risk with placebo | Risk with Influenza vaccine | |||||
| Total exacerbations per participant | The mean number of total exacerbations per participant ranged across placebo groups from 0.83 to 1.35 | MD 0.37 lower (0.64 lower to 0.11 lower) | ‐ | 180 (2 RCTs) | ⊕⊕⊝⊝ Low a | Despite the effect size, this is based on a very small number of trials and participants. However there was good agreement between these two studies (low I2). One study was not conducted in an epidemic year. We extrapolated some data. Ideally more trials would be done to refine these effect sizes. |
| Early exacerbations per participant | The mean number of early exacerbations per participant ranged across placebo groups from 0.14 to 0.34 | MD 0.01 higher (0.11 lower to 0.13 higher) | ‐ | 180 (2 RCTs) | ⊕⊕⊝⊝ Low a | See above |
| Late exacerbations per participant | The mean number of late exacerbations per participant ranged across placebo groups from 0.48 to 1.21 | MD 0.39 lower (0.61 lower to 0.18 lower) | ‐ | 180 (2 RCTs) | ⊕⊕⊝⊝ Lowa | See above |
| Days disability from respiratory illness | not reported | |||||
| Hospital admissions | 76 per 1000 | 26 per 1000 (7 to 93) | OR 0.33 (0.09 to 1.24) | 180 (2 RCTs) | ⊕⊕⊝⊝ Low a,b | |
| Mortality | 76 per 1000 | 67 per 1000 (23 to 182) | OR 0.87 (0.28 to 2.70) | 180 (2 RCTs) | ⊕⊕⊝⊝ Low a,b | |
| Local effects at injection site | 63 per 1000 | 274 per 1000 (106 to 546) | OR 5.57 (1.75 to 17.71) | 125 (1 RCT) | ⊕⊕⊝⊝ Lowa | Single study on participants who all had COPD (Wongsurakiat 2004a), but very similar findings in studies with a mixed population (Cate 1977; Govaert 1994) |
| GRADE Working Group grades of evidence High certainty: we are very confident that the true effect lies close to that of the estimate of the effect Moderate certainty: we are moderately confident in the effect estimate: the true effect is likely to be close to the estimate of the effect, but there is a possibility that it is substantially different Low certainty: our confidence in the effect estimate is limited: the true effect may be substantially different from the estimate of the effect Very low certainty: we have very little confidence in the effect estimate: the true effect is likely to be substantially different from the estimate of effect | ||||||
aSmall number of studies which are over ten years old limit our confidence in the generalisability of these findings to currently available vaccines (downgraded once for indirectness).
b Studies too small and events too infrequent to detect a consistent effect (downgraded once for imprecision)
Background
Description of the condition
Chronic obstructive pulmonary disease (COPD) occurs predominantly in older people who have smoked, and is characterised by progressive airflow obstruction that is largely irreversible. As the disease progresses, exacerbations may occur several times per year, and may require hospital admission. These exacerbations can take several weeks to resolve, during which time considerable morbidity may occur and result in significant health care costs. Infection with influenza is an important cause of excess mortality and morbidity in people with COPD (Rothbart 1995). It may affect the progression of the disease (Centanni 1997), and frequency of exacerbations (Sethi 2002). People with COPD are at an increased risk for respiratory illness‐related hospitalisation during influenza outbreaks, irrespective of age and degree of morbidity (Monto 1987).
Description of the intervention
Annual influenza vaccination is almost universally recommended in COPD guidelines (ATS 1995; ATS 2004; BTS 1997; GOLD 2018; NICE 2010; Siafakas 1995; Yang 2017). The largest body of evidence to support this recommendation comes from observational studies in the older population. In a large, serial cohort study of nearly 150,000 older people, those who had been vaccinated had a reduction of about 32% in the rates of hospitalisation for all respiratory conditions, and a reduction of approximately 50% in all‐cause mortality over their untreated counterparts (Nichol 1998). In people with chronic lung disease, those who were vaccinated had a 52% reduction in hospitalisations and a 70% reduction in death rate during influenza seasons (Nichol 1999). A meta‐analysis of 20 cohort studies of influenza vaccination in older people showed a 56% reduction in respiratory illness, a 53% reduction in pneumonia, a 50% reduction in hospitalisation, and a 68% reduction in deaths from all causes during influenza outbreaks (Gross 1995). The benefit was seen especially in epidemic years, when the vaccine strain was identical or similar to the epidemic strain (Gross 1995). Most studies suggest that vaccination is very cost effective. For example, Nichol and colleagues estimated that vaccination was associated with a reduction in health care costs of about USD 171 per year per high risk person vaccinated (Nichol 1998).
How the intervention might work
The effectiveness of the vaccine depends on the immunocompetence of the vaccine recipient and the degree of similarity between virus strains in the vaccine and those in circulation (ACIP 1999). Most vaccine programmes use an inactivated virus vaccine, which contains three virus strains (usually 2 type A and 1 type B), representing the influenza viruses likely to circulate in the upcoming winter. The vaccine is made from highly purified, egg‐grown viruses that have been inactivated. These vaccines may be whole virus, sub virion, or purified‐surface‐antigen preparations. The mechanism of protection by the vaccine is thought to occur via circulating antibodies to HA (Hemagglutinin) and NA (Neuramidase), acting against severe infection of the lower respiratory tract. Stimulation of cytotoxic T‐cell responses may also be important (Patriarca 1994). In general, older people have lower phagocytic function, and mount less of an immune response to vaccination than younger people (Treanor 1992). To improve vaccine efficacy, live attenuated viruses have been trialled. Levels of secretory anti‐HAs, immunoglobulins (Igs) and anti‐influenza A virus cytotoxic T‐cell responses were better in people with COPD after immunisation with monovalent live attenuated vaccine than with inactivated influenza A virus vaccines (Gorse 1991; Gorse 1995; Gorse 1996). Some investigators have co‐administered more than one type of vaccine, such as cold attenuated virus with inactivated virus vaccine, in an attempt to increase vaccine efficacy in people with COPD (Gorse 1997).
Why it is important to do this review
Despite guideline recommendations, vaccination of older people (the age group that includes most people with COPD) is not universal. In the USA in 1997, only 65.5% of older people were vaccinated in the previous year (BRFSS 1998). Yet, the only absolute contraindication to vaccination is chicken egg allergy. Other reasons for not vaccinating include uncertainty about the degree and longevity of protection in the older population and concern about adverse effects (Patriarca 1994). People with COPD, and their doctors, often express concern that vaccination precipitates exacerbations, despite the fact that it is not possible to contract influenza from inactivated virus. Adverse effects usually manifest within 24 hours of vaccination, and can be local or systemic. Several studies have shown that mild local side effects, at the site of injection, are more common in those who were vaccinated, than in those given placebo (Govaert 1994; Nichol 1995). Systemic reactions include myalgia, fatigue, headache, and low‐grade fever. These are more common in females, and after the administration of whole‐virus than sub virion vaccines. Higher doses and levels of pre‐existing antibody also increase the likelihood of these reactions (Cate 1977). The most feared complication of influenza vaccination is Guillain‐Barre Syndrome (GBS). However, this is extremely rare (approximately 1/1,000,000), and the benefits of the vaccine are thought to far out‐weigh the risks of developing vaccine‐associated GBS (ACIP 1999).
This systematic review evaluated the evidence from RCTs that had studied the effect of influenza vaccination in people with COPD. The review was originally published in 2000 (Poole 2000), and updated in 2006 (Poole 2006).
Objectives
To determine whether influenza vaccination in people with COPD:
Reduces respiratory illness;
Reduces mortality;
Is associated with excess adverse events; and
Is cost effective.
Methods
Criteria for considering studies for this review
Types of studies
We included randomised controlled trials (RCT).
Types of participants
We included studies of adults with COPD, as defined by the American Thoracic Society (ATS 1995), or European Respiratory Society (Siafakas 1995). We also included studies with participants who were defined as having chronic bronchitis.
Types of interventions
We included studies randomising people to receive at least one annual influenza vaccination. Influenza vaccination may have been one of the following types: live attenuated whole virus, inactivated, or a split‐virus type vaccine, and may have been administered by either intramuscular injection or intranasal spray.
Types of outcome measures
We classified outcomes as early or late. 'Early' referred to the early post vaccination period, when immunity may not yet have developed, but adverse effects may have occurred
Primary outcomes
Exacerbations of COPD, defined as an increase in breathlessness, volume or purulence of sputum, or a combination. This was assessed in terms of both total numbers of exacerbations and participants with one or more exacerbations in the study period.
Days of disability from respiratory illness, defined as days in bed, days off work, or days when the person was unable to undertake normal activities
Hospital admissions
Mortality in the year following vaccination (All cause and respiratory‐related)
Secondary outcomes
Change in lung function from baseline, at the end of the study period
Adverse effects: acute
Acute respiratory illnesses subsequently proven to be influenza‐related
Cost effectiveness
Studies would be excluded if they:
Did not report outcomes of interest for this review
Were not placebo controlled
Search methods for identification of studies
Electronic searches
We identified trials from the Cochrane Airways Trials Register, which is maintained by the Information Specialist for the Group. The most recent search was conducted in December 2017. The Cochrane Airways Trials Register contains studies identified from several sources:
Monthly searches of the Cochrane Central Register of Controlled Trials (CENTRAL), through the Cochrane Register of Studies Online (crso.cochrane.org);
Weekly searches of MEDLINE Ovid SP;
Weekly searches of Embase Ovid SP;
Monthly searches of PsycINFO Ovid SP;
Monthly searches of CINAHL EBSCO (Cumulative Index to Nursing and Allied Health Literature);
Monthly searches of AMED EBSCO (Allied and Complementary Medicine);
Handsearches of the proceedings of major respiratory conferences.
Studies contained in the Trials Register are identified through search strategies based on the scope of Cochrane Airways. Details of these strategies, as well as a list of handsearched conference proceedings are in Appendix 1. See Appendix 2 for search terms used to identify studies for this review.
Searching other resources
We searched for additional articles of interest in the bibliographic lists from all full‐text papers we retrieved. In 2006, we searched bibliographies of large reviews of influenza vaccination trials (Galasso 1977; Gross 1995), and recommendations of Advisory Councils (ACIP 1999; BRFSS 1998).
To locate other published or unpublished RCT data in 2006, we contacted pharmaceutical companies that had been involved in the conduct of vaccine trials, the manufacture of vaccines, or both. We contacted the following companies: Smith Kline Beecham, Glaxo‐Wellcome, Merck Sharp and Dohme, Astra, Parke Davis, Wyeth, Pasteur Merieux, and Commonwealth Serum Laboratories. In 2006, we also wrote to authors who had published extensively in the field to ask if they were aware of any further RCTs, published or unpublished.
For the review update (December 2017), we searched clinical trials registries (ClinicalTrials.gov and the World Health Organization International Clinical Trials Registry Platform) for current, recently completed, and ongoing studies.
Data collection and analysis
Selection of studies
For the original review, three review authors (PJP, RWB, EC) independently screened the titles and abstracts for potentially eligible studies and then retrieved the full texts to further screen for inclusion. For the updates this was done by two review authors (PJP and ZK). We resolved disagreement through discussion.
Data extraction and management
Review authors agreed the format of data extraction sheets. Two review authors independently extracted data. One review author entered the data onto the data extraction sheets, and then into Review Manager 4. A second review author double‐checked each entry. For versions of this review published after the 2006 update, we used Review Manager 5 (RevMan 2014).
Assessment of risk of bias in included studies
Two review authors (PJP, ZK) independently assessed the risk of bias for all included studies, using the criteria outlined in the Cochrane Handbook of Systematic Reviews of interventions (Higgins 2011). We resolved disagreements through discussion. We assessed the risk of bias according to the following items:
Random sequence generation;
Allocation concealment;
Blinding;
Incomplete outcome data
Selective outcome reporting;
Other potential bias.
We judged each potential source of bias as high, low or unclear risk of bias. We summarised our judgements of the risk of bias across different studies for each of the items listed.
Measures of treatment effect
We analysed continuous data as mean differences (MD) with 95% confidence intervals (CI) and dichotomous data as odds ratios (OR) with 95% CI or Peto odds ratios (Peto) with 95% CIs where pooling of odds ratios, or approximation to the odds ratio (i.e. for rare events) was required and appropriate i.e. intervention and control groups have similar numbers and number of events were rare (Higgins 2011).
Unit of analysis issues
The participant was the unit of analysis.
Dealing with missing data
Where there were insufficient data in the paper, we requested further data by writing to the author or pharmaceutical company sponsoring the study.
Assessment of heterogeneity
We assessed heterogeneity by visual inspection of the forest plots and calculation of the I² value; which was interpreted broadly as follows:
0 to 40%: may represent negligible/low heterogeneity
30 to 60%: moderate heterogeneity
50 to 90%: substantial heterogeneity
75 to 100%: considerable heterogeneity (Higgins 2011).
Assessment of reporting biases
We had planned to assess publication bias using a funnel plot, if there were a sufficient number of studies in a forest plot (more than 10).
Data synthesis
We used a fixed‐effect model and performed a sensitivity analysis with a random‐effects model.
We anticipated that the follow‐up period would be 12 months. Because of the small number of studies involved in this review, we did not annualise the event rate. If further data become available, it may be necessary to annualise the event rate, particularly if follow‐up periods vary.
Subgroup analysis and investigation of heterogeneity
In the case of significant heterogeneity, we had planned to run a sensitivity analysis based on risk of bias. If any heterogeneity could not be explained in terms of risk of bias, we planned the following sub‐group analyses:
Type of control group
Vaccine type
Severity of COPD (by baseline lung function)
Setting of study
Match between strain of vaccine and infecting strains
Age of participants
'Summary of findings' tables
We created a 'Summary of findings' table using the GRADEPro software (GRADEpro GDT 2015). We included all primary outcomes and adverse events. We used the five GRADE considerations (risk of bias, consistency of effect, imprecision, indirectness, and publication bias) to assess the quality of a body of evidence as it related to the studies that contributed data for the prespecified outcomes. We used the methods and recommendations described in Section 8.5 and Chapter 12 of the Cochrane Handbook for Systematic Reviews of Interventions (Higgins 2011). We justified all decisions to downgrade the quality of studies using footnotes.
Results
Description of studies
Results of the search
For the original review, we screened 105 abstracts of papers from the initial searches. After excluding those that were clearly ineligible, we obtained full texts for 25. An additional 40 articles were identified from bibliographies and references provided by pharmaceutical companies. Commonwealth Serum Laboratories provided another 70 references from an independent search. We obtained full‐text articles when the title and abstract indicated the study was possibly eligible. We reviewed a total of 70 full texts for possible inclusion.
The 2003 search yielded four new abstracts, including two reports of the same eligible study (Gorse 2003; Neuzil 2003). The 2004 search yielded a further five abstracts, including two reports of the same eligible study (Wongsurakiat 2003; Wongsurakiat 2004a). Dr Wongsurakiat identified a further study, published after the 2006 search (Wongsurakiat 2004b).
We did not identify any new eligible studies from searches conducted in December 2017 (see Figure 1 and 'Characteristics of excluded studies' table for further detail).
1.
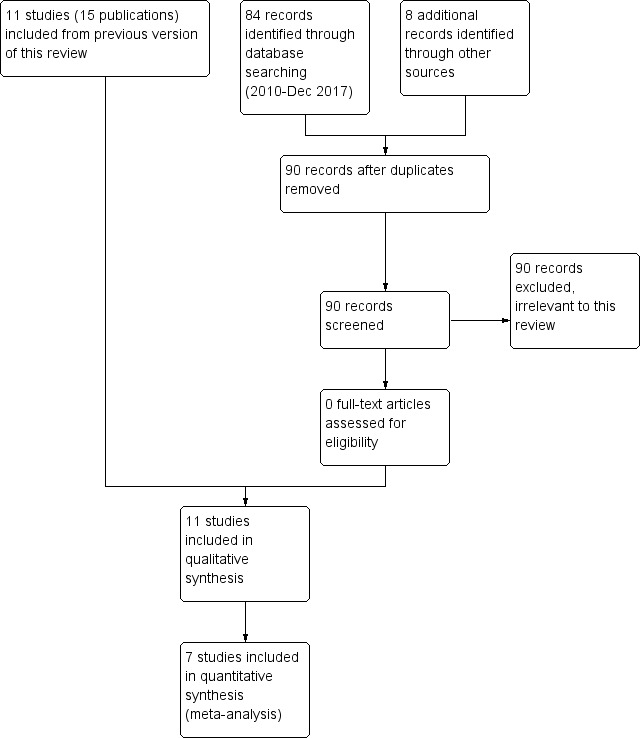
Study flow diagram for 2018 update
We included 11 studies (reported in 16 publications) in this review, with 6750 participants. We wrote, requesting more information, on six of them (Cate 1977; Gorse 1995; Govaert 1994/Govaert 1994a; Treanor 1992; Treanor 1994; Wongsurakiat 2004a). Dr Treanor and Dr Cate kindly supplied individual participant data. We received a reply from Dr Gorse but he was unable to supply us with further data. Dr Wongsurakiat kindly provided useful further information.
Included studies
Eleven studies met the entry criteria (see 'Characteristics of included studies' table); all were RCTs, using a parallel group design. All studies were double‐blind and placebo‐controlled, except for Gorse 1995 and Gorse 1997. These two studies were single‐blind and compared intra‐muscular inactivated vaccine and intranasal live attenuated vaccine with intra‐muscular inactivated vaccine and intranasal placebo. Because these studies assessed the additional benefit of a second vaccine, we assessed them as a separate comparison in this review.
Population
Six of the 11 trials in this review studied participants with COPD or chronic bronchitis alone (Fell 1977; Gorse 1997; Gorse 2003; Howells 1961; MRC 1980; Wongsurakiat 2004a). These studies ranged in size from 29 participants in Gorse 1997, to 2215 in Gorse 2003, and included a total of 2469 participants. The other five trials were conducted in older or chronically ill people, or both, a proportion of whom had chronic lung disease. In these studies, the percentage of people with chronic lung diseases varied from 32% in Gorse 1995, to 5% in Cate 1977. From these authors, we sought individual participant data for the subgroup with chronic lung disease, in particular COPD. Where possible, data from the lung disease subgroup are included, although in none of these studies was it possible to ascertain whether this lung disease subgroup had COPD. The studies that included a minority of people with chronic lung disease are described in the discussion section for comparison with the six studies carried out exclusively in people with COPD.
The following descriptions refer only to the six studies specifically investigating influenza vaccination in COPD or chronic bronchitis alone:
Timing: three studies were conducted during winter months (Fell 1977; Gorse 2003; Howells 1961).
Setting: Fell 1977 was in a group practice, and four were in hospital outpatient clinics (Gorse 1997; Gorse 2003; Howells 1961; Wongsurakiat 2004a).
Duration: length of trials varied from as little as three weeks with MRC 1980, to one year (Wongsurakiat 2004a).
Inclusion and exclusion criteria: Howells 1961, MRC 1980, and Fell 1977 studied people with chronic bronchitis. Gorse 1997, Gorse 2003, and Wongsurakiat 2004a specifically studied people with pre‐existing COPD, categorised by FEV1/FVC ratio less than 70% (forced expiratory volume in the first second/Forced vital capacity). Exclusion criteria were varied. They were explicit in Gorse 1997, Gorse 2003, Wongsurakiat 2004a, and MRC 1980, limited in Howells 1961 to Grade 4 bronchitis, and were not reported at all in Fell 1977.
Participant characteristics: the mean age was 67.3 years in the five studies that reported it (Fell 1977; Gorse 1997; Gorse 2003; Howells 1961; Wongsurakiat 2004a). The percentage of males ranged from 64% in Fell 1977 to 100% (Gorse 1997). The latter was a study in US veterans.
Comorbidities: 31% of the treatment group in Gorse 1997 had underlying liver disease. Both treatment and control groups in this study had similar proportions of other underlying diseases. 30% of the treatment group of Fell 1977 was on digoxin, and 8% had coexistent asthma and chronic bronchitis. In Gorse 2003, 95% had comorbidities, and in Wongsurakiat 2004a, this level was 33%.
Smoking history: 97% of the participants of Gorse 1997 had a smoking history, 93% in Fell 1977, 95% in Gorse 2003, and 96% in Wongsurakiat 2004a.
Lung function: the mean peak flow was 280 L/min from the two studies that reported these measurements. Wongsurakiat 2004a stratified the participants in the study by baseline FEV1. Thirty‐six per cent of people had an FEV1 ≥ 70% predicted, 26% an FEV1 of 50% to 69%, and 38% an FEV1 < 50%. The mean baseline FEV1 in Gorse 2003 was 1.38 L (43.5% predicted).
The treatment and control samples were generally well matched, except in Fell 1977, where baseline adverse symptoms were higher in the vaccinated group. This particular study was unusual in that it used the early post vaccination symptoms as the baseline for assessing late post vaccination symptoms. In this study, despite randomisation, there was a significant difference between treatment and control in baseline symptom scores, serum antibody levels, and comorbidities. No details of baseline characteristics were provided by one study (MRC 1980).
Intervention
Vaccination type: two studies used inactivated virus (Howells 1961; Wongsurakiat 2004a). Four studies assessed the effects of live attenuated intranasal virus vaccines (Fell 1977; Gorse 1997; Gorse 2003; MRC 1980), with Gorse 1997 and Gorse 2003 assessing the add‐on benefit of live intranasal virus, while both treatment and control groups received inactivated virus vaccine intramuscularly. We examined these studies separately in the analysis.
Match between vaccine and influenza strains: Fell 1977 reported that their study was carried out in a non‐epidemic year. Wongsurakiat 2004a reported their study was carried out in a non‐epidemic year; however, there was a good match between the influenza that did occur and the serotypes in the vaccine. Gorse 2003 reported a regional outbreak in the study area, with a virus antigenically similar to a vaccine strain. The other studies did not report the match.
Outcome measures
Clinical outcomes that could be evaluated included: exacerbations (Fell 1977; Gorse 1997; Gorse 2003; Howells 1961; Wongsurakiat 2004a), hospitalisations, lung function, adverse effects, and mortality. An assessment of serological outcomes alone was not the purpose of this review. Outcomes were defined as 'early' and 'late' to try and address whether vaccination led to an increase in exacerbations before immunity had developed. We had planned to define 'early' as one to two weeks after vaccination, but Howells 1961 used a period of three weeks, and Wongsurakiat 2004a, four weeks. Wongsurakiat 2004a recorded all acute respiratory infections (ARIs; total of 269 events), which were then subdivided by presentation into common cold (85 events), influenza‐like illnesses (20 events), acute exacerbations (161 events), and pneumonia (three events). Thus, the commonest presentation was 'acute exacerbation' (60% of events). He also conducted an economic evaluation (Wongsurakiat 2003). Gorse 2003a assessed health status by the chronic lung disease index (CLDI), reported by vaccination status.
Dropouts: there was a range of 0% to 19% of participant withdrawals. There were none reported in Gorse 1997. In the MRC 1980 multi‐centre study, 16 participants from one centre had no baseline data and 15 had incomplete records. In Gorse 2003 (the largest study with 2215 participants), 9% dropped out. In Wongsurakiat 2004a, three out of 125 participants dropped out.
Excluded studies
The main reasons for study exclusion were a lack of randomisation, and absence of primary outcome data (Gorse 1988; Gorse 1996; Lama 1998). We excluded another two studies because they lacked a placebo control (Ambrosch 1979; MRC 1959). See 'Characteristics of excluded studies' table for full details.
Risk of bias in included studies
See Figure 2 for a summary of the 'Risk of bias' assessments. We judged many domains as unclear risk of bias, due to lack of detail present in the publications. This is unsurprising, considering all included trials were published in 2004 or earlier, when standards and guidelines for reporting were less stringent.
2.
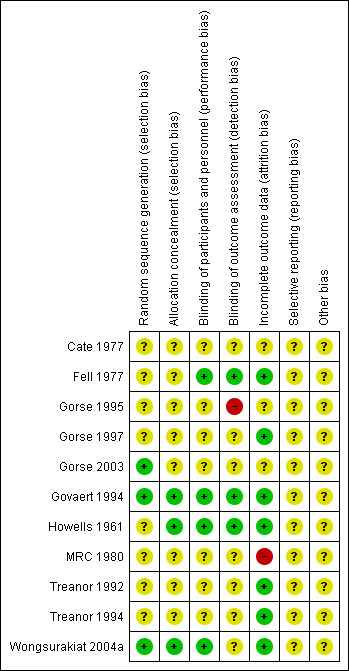
Risk of bias summary: review authors' judgements about each risk of bias item for each included study
Allocation
We judged three trials (Gorse 2003; Govaert 1994; Wongsurakiat 2004a) at low risk of bias for random sequence generation, but the remaining eight studies reported insufficient information to permit a judgement. We judged three trials (Govaert 1994; Howells 1961; Wongsurakiat 2004a) to be at low risk of bias for concealment of the allocation sequence, while the remaining eight were unclear.
Blinding
We judged four trials to be at low risk for performance bias (Fell 1977; Govaert 1994; Howells 1961; Wongsurakiat 2004a) and three at low risk of detection bias (Fell 1977; Govaert 1994; Howells 1961) as they described suitably identical placebos, however, the remaining studies were unclear; this was due either to not describing the nature of the placebo, the nurse delivering the intervention not being blinded, or a lack of detail about blinding procedures.
One trial did not blind the outcome assessor and consequently, we marked it as high risk of bias (Gorse 1995). We judged three as low risk because they used blinded outcome assessors, but seven studies didn't describe this in sufficient detail to permit a judgement other than unclear.
Incomplete outcome data
We judged one study to be at high risk of attrition bias owing to the fact that 11 of the vaccinated participants were excluded from the study from a single centre (MRC 1980). Seven studies were judged to be at low risk (Fell 1977; Gorse 1997; Govaert 1994; Howells 1961; Treanor 1992; Treanor 1994; Wongsurakiat 2004a), and three were at unclear risk (Cate 1977; Gorse 1995; Gorse 2003).
Selective reporting
All studies were reported in insufficient detail to permit a decision.
Other potential sources of bias
None noted.
Effects of interventions
See: Table 1
Influenza vaccination versus placebo
Results that follow relate to the six trials in people with COPD, chronic bronchitis, or both.
Primary outcome
Exacerbations of COPD
Two studies in 180 participants with COPD, chronic bronchitis, or both (both used inactivated virus vaccination) reported continuous data for exacerbation rates (Howells 1961; Wongsurakiat 2004a). Vaccination significantly reduced the number of exacerbations per participant during the follow‐up period (MD –0.37 exacerbations, 95% CI –0.64 to –0.11; P = 0.006; two RCTs, 180 participants; Analysis 1.1).
1.1. Analysis.
Comparison 1 Inactivated influenza vaccine versus placebo, Outcome 1 Total exacerbations per participant.
We determined the number of early or late exacerbations per participant by further interpretation of the data. For the placebo group of Howells 1961, 20 participants experienced 24 exacerbations. Since there were eight participants experiencing early exacerbations, there would have been at least eight early exacerbations. Similarly, since there were 12 participants experiencing late exacerbations, there would have been at least 12 late exacerbations. Thus the assumption was made that in order to make up the total of 24 exacerbations, there were two more early and two more late exacerbations. In support of this conclusion is the statement in the paper that similar numbers of early exacerbations were recorded in both placebo and vaccinated groups. Sensitivity analysis using 12 early and 12 late exacerbations showed no difference in the significance of our results. Wongsurakiat 2004a provided the number of early and late exacerbations without a spread. As the number of early exacerbations was small, it was assumed that these occurred in separate participants, and we calculated the SD accordingly. We allocated the SD of the 'total exacerbations'' per participant provided by the author to the 'late exacerbations'.
While there was no statistically significant effect of vaccination on early exacerbation rates (MD 0.01, 95% CI –0.11 to 0.13; P = 0.87; two RCTs, 180 participants; Analysis 1.2), inactivated influenza vaccination significantly reduced late exacerbation rates (MD –0.39, 95% CI –0.61 to –0.18; P < 0.001; two RCTs, 180 participants; Analysis 1.3).
1.2. Analysis.
Comparison 1 Inactivated influenza vaccine versus placebo, Outcome 2 Early exacerbations per participant.
1.3. Analysis.
Comparison 1 Inactivated influenza vaccine versus placebo, Outcome 3 Late exacerbations per participant.
Wongsurakiat 2004a reported no clear difference in the overall incidence or severity of acute respiratory infections (ARIs) between the vaccination and placebo groups.
Participants with at least one exacerbation or acute respiratory illness in the study period
Three studies, with 444 participants, contributed to this outcome (Fell 1977; Howells 1961; Wongsurakiat 2004a). There was no significant difference between vaccination and placebo‐treated participants with respect to the number of participants having at least one exacerbation or acute respiratory illness (Peto 0.81, 95% CI 0.44 to 1.48; P = 0.49; three RCTs, 444 participants; Analysis 1.4). However, there was significant heterogeneity in this result (P = 0.001), so it must be treated with caution. A sensitivity analysis by vaccine type showed that if only the two studies that used inactivated virus vaccine were included, this heterogeneity was removed, with a reduction in the number of participants with at least one exacerbation or acute respiratory illness in the study period with vaccination (OR 0.42, 95% CI 0.21 to 0.85; P = 0.02; two RCTs, 180 participants). Results from Howells 1961 and Wongsurakiat 2004a showed no significant difference in the number of individual participants with early exacerbations (Peto 1.08, 95% CI 0.52 to 2.26; P = 0.84; two RCTs, 180 participants; Analysis 1.5), but Howells 1961 did show a significant reduction in the number of participants with late exacerbations (Peto 0.13, 95% CI 0.04 to 0.45; P = 0.002; one RCT, 55 participants; Analysis 1.6). In Wongsurakiat 2004a, nine of 76 exacerbations in the vaccination group were early; while 10 of 85 exacerbations in the placebo group were early. We assumed that they each occurred in a different participant. Clearly, over the course of the study, there were some participants who had more than one exacerbation; the number of individual participants in each group who had late exacerbations was not reported.
1.4. Analysis.
Comparison 1 Inactivated influenza vaccine versus placebo, Outcome 4 Participants with at least one exacerbation or acute respiratory illness.
1.5. Analysis.
Comparison 1 Inactivated influenza vaccine versus placebo, Outcome 5 Participants with early exacerbations.
1.6. Analysis.
Comparison 1 Inactivated influenza vaccine versus placebo, Outcome 6 Participants with late exacerbations.
Days of disability from respiratory illness
Not reported.
Hospital admissions
Two studies, with 180 participants, reported data on this outcome (Howells 1961; Wongsurakiat 2004a). There was no significant effect of vaccination over placebo on hospitalisation (Peto 0.33, 95% CI 0.09 to 1.24; P = 0.52; two RCTs, 180 participants; Analysis 1.7). In Howells 1961 there were no hospitalised participants in the treatment group, and only two in the control group. Wongsurakiat 2004a reported the number of hospitalisations for influenza‐related respiratory infections only. There were two in the vaccine group and five in the placebo group. They reported no clear difference in the severity of acute respiratory infections between groups, including no clear difference in the chance of being hospitalised (P = 0.2 by log rank test). None of the vaccinated participants required mechanical ventilation for acute respiratory infection, whereas five in the placebo group did.
1.7. Analysis.
Comparison 1 Inactivated influenza vaccine versus placebo, Outcome 7 Hospital admissions.
Mortality
Two studies, with 180 participants, reported all‐cause mortality; there was a total of 13 deaths (Howells 1961; Wongsurakiat 2004a. There was no significant difference between vaccine and placebo‐treated groups (Peto 0.87, 95% CI 0.28 to 2.70; P = 0.81; two RCTs, 180 participants; Analysis 1.8). One control participant died during an acute exacerbation (Howells 1961). In Wongsurakiat 2004a, 12 of 125 participants died (eight of which were unrelated to acute respiratory infection); of those that were ARI related there was no demonstrable difference between vaccination and control (OR 0.33, 95% CI 0.03 to 3.24; Analysis 1.9).
1.8. Analysis.
Comparison 1 Inactivated influenza vaccine versus placebo, Outcome 8 Mortality (all cause).
1.9. Analysis.
Comparison 1 Inactivated influenza vaccine versus placebo, Outcome 9 Mortality (acute respiratory illness‐related).
Secondary outcomes
Lung function
One small study (55 participants) reported FEV1 changes from baseline (MRC 1980). There was no significant difference between the groups' overall change in FEV1 (MD –0.02, 95% CI –0.12 to 0.08; Analysis 1.10), nor in their change in early FEV1 (MD ‐0.01, 95% CI ‐0.09 to 0.07; Analysis 1.11) but there was insufficient evidence to prove no difference in treatments. Wongsurakiat 2004b reported no clear difference in lung function between groups at one and four weeks after vaccination.
1.10. Analysis.
Comparison 1 Inactivated influenza vaccine versus placebo, Outcome 10 Overall change in lung function (FEV¹, L).
1.11. Analysis.
Comparison 1 Inactivated influenza vaccine versus placebo, Outcome 11 Change in early lung function (FEV¹, L).
Adverse effects and acute respiratory illness subsequently proven to be influenza‐related
Wongsurakiat 2004b evaluated local and systemic symptoms in the weeks following vaccination. There was no significant difference in the incidence of systemic adverse effects between the treated and placebo groups (OR 0.74, 95% CI 0.31 to 1.74; Analysis 1.12). The only significant difference observed was in the local reaction at the injection site; seen in 27% of vaccinees and 6% of the placebo group (OR 5.57, 95% CI 1.75 to 17.71; Analysis 1.13).
1.12. Analysis.
Comparison 1 Inactivated influenza vaccine versus placebo, Outcome 12 Systemic adverse effects.
1.13. Analysis.
Comparison 1 Inactivated influenza vaccine versus placebo, Outcome 13 Local effects at injection site.
Fell 1977 (44 participants) reported early (within two weeks of vaccination) upper respiratory tract symptoms. One vaccinated participant also developed pleuritic pain. There was no statistically significant difference between vaccinated and control participants in terms of breathlessness or tightness (Peto 1.28, 95% CI 0.38 to 4.31; P = 0.696; Analysis 1.14; Analysis 1.15). The occurrence of a wheeze within the first two weeks was greater in vaccinated participants (Peto 3.57, 95% CI 1.10 to 11.56; P = 0.034; Analysis 1.16).No statistically significant difference between groups was noted for cough (Peto 4.09, 95% CI 0.74 to 22.49; P = 0.106; Analysis 1.17).
1.14. Analysis.
Comparison 1 Inactivated influenza vaccine versus placebo, Outcome 14 Participants with early breathlessness.
1.15. Analysis.
Comparison 1 Inactivated influenza vaccine versus placebo, Outcome 15 Participants with early tightness.
1.16. Analysis.
Comparison 1 Inactivated influenza vaccine versus placebo, Outcome 16 Participants with early wheeze.
1.17. Analysis.
Comparison 1 Inactivated influenza vaccine versus placebo, Outcome 17 Participants with early cough.
Two studies assessed the clinical presentations to see if they were related to influenza virus infection (Howells 1961; Wongsurakiat 2004a). Howells 1961 used the hemagglutination inhibition (HAI) test, and Wongsurakiat 2004a used both serology and virology swabs. Overall, inactivated influenza vaccination resulted in a marked decrease in influenza‐related respiratory infections (OR 0.19, 95% CI 0.07 to 0.48; P < 0.001; two RCTs, 180 participants; Analysis 1.18). The effect was similar whether participants had mild, moderate, or severe COPD, or chronic bronchitis (test for heterogeneity P = 0.73). Influenza accounted for 8% (13/161) of the acute exacerbations in the Wongsurakiat 2004a study. Further, the study demonstrated that there was no significant difference in early ARI (OR 0.72, 95% CI 0.34 to 1.50; Analysis 1.19).
1.18. Analysis.
Comparison 1 Inactivated influenza vaccine versus placebo, Outcome 18 Acute respiratory illness subsequently documented as influenza‐related.
1.19. Analysis.
Comparison 1 Inactivated influenza vaccine versus placebo, Outcome 19 Early acute respiratory illness (ARI).
In terms of sputum production no significant difference was noted between the vaccination group and control (Peto 2.03, 95% CI 0.48 to 8.66; P = 0.338; Analysis 1.20). Breathlessness was recorded significantly less often (P < 0.05) in the 5 of 21 participants who had a serological response to vaccination than in the placebo group.
1.20. Analysis.
Comparison 1 Inactivated influenza vaccine versus placebo, Outcome 20 Participants with early sputum production.
The Treanor 1994 paper reports that 12% of the older people vaccinated with live attenuated virus reported systemic symptoms of malaise and myalgias, as did 10% of inactivated virus vaccinees. The placebo group reported none. Twenty‐six per cent of those who received the live virus reported lower respiratory tract symptoms of hoarseness and non‐productive cough, as did 13% of those who received the inactivated virus, and 9% of those who received placebo. Twenty‐nine per cent of those who received live virus reported upper respiratory tract symptoms of sneezy, runny, or stuffy nose or sore throat, as did 37% of those who received the inactivated virus, and 18% of those who received placebo. Six per cent of those who received the live virus experienced fever, as did 2.5% of those who received the inactivated virus. None of the placebo group reported any febrile illness. In the subgroup of participants with chronic lung disease in this study, of the 20 participants who received some form of influenza vaccination, 11 reported a total of 20 adverse effects, while of the two participants who received the placebo, one participant reported two adverse effects.
The Govaert 1994 paper reports 25% of high risk vaccinees experienced one or more adverse reactions, compared to 16% of those who received placebo, however, effects, if any, appeared to have been mild and transitory. Eleven per cent of all vaccinees experienced systemic effects, as did 9.4% of the placebo recipients. When a multiple regression analysis that looked at the effect of lung disease on systemic adverse reactions was performed, the difference between vaccinees and the placebo group was statistically significant (OR 1.95, 95% CI 1.24 to 3.07). Local effects were experienced by 17.5% of all vaccinees in this study, but in only 7.3% of the placebo group (P < 0.001). This study also showed that differences between the treatment groups for adverse effects reduced with age.
The Cate 1977 paper reports 7.8% of those who received inactivated virus reported mild systemic reactions, and 4.9% reported moderate to severe ones. The control group who received saline placebo reported similar numbers of mild systemic reactions, but no moderate to severe ones. Most systemic reactions resolved within two days of vaccination. In the vaccinated group, 18.5% of participants experienced erythema (local redness) with or without induration (hardening) at the injection site, compared to none in the control group.
Cost effectiveness
Wongsurakiat calculated the incremental cost effectiveness ratios of inactivated virus vaccination by applying the direct medical costs from a Thai health provider perspective to the results obtained in the RCT (Wongsurakiat 2004a). There were two types of cost: cost of treatment as an outpatient, and cost of hospitalisation. More than 90% of the costs of influenza‐related acute respiratory illness (ARI) were costs of hospitalisation. In people with moderate or severe COPD, more than 90% of the hospital costs were due to costs of treating those who required mechanical ventilation. The costs were based on 1997 prices using Thai Bhat (THB), with vaccination costing 248.40 THB. In the paper the author concluded that cost savings would be 629,538 THB for every 100 people with mild COPD vaccinated, 184 THB for every 100 with moderate COPD, and 680,647 THB for those with severe COPD, i.e. vaccination was very cost effective, but more so in those with more severe COPD.
Live attenuated intranasal vaccine plus inactivated intramuscular vaccine versus placebo intranasal or inactivated intramuscular vaccine
Four studies (2817 participants) evaluated the effect of adding live attenuated virus to inactivated virus vaccination (Gorse 2003; Gorse 1995; Gorse 1997; Treanor 1992). The Gorse 1997 and Gorse 2003 studies were specifically conducted on people with COPD, but the others were carried out in older people, only a minority of whom had lung disease. For simplicity, 'treatment' refers to the live intranasal plus inactivated group, and 'control' to the placebo intranasal plus inactivated vaccine group. Only the Gorse 1997 and Gorse 2003 studies provided data in a form that could be used in analyses.
Primary outcomes
Exacerbations of COPD
There were no significant differences in the total number of exacerbations per participant between the two groups (MD 0.01, 95% CI ‐0.35 to 0.37; P = 0.96; two RCTs; 1137 participants; Analysis 2.1). In the former, exacerbations were defined as the occurrence of increased cough, shortness of breath, sputum production, or a combination. There was no clear difference in either the early exacerbation rate per participant (MD –0.21, 95% CI –0.55 to 0.13; P = 0.23; one RCT, 29 participants; Analysis 2.2), or late exacerbations (MD –0.23, 95% CI –0.08 to 0.54, P = 0.14; one RCT, 29 participants; Analysis 2.3) between groups. In the latter, participants were asked to report any febrile influenza‐like illness (ILI). This was then investigated by serology, swabs, or both to determine if it was influenza‐related.
2.1. Analysis.
Comparison 2 Inactivated + live virus versus inactivated virus + placebo, Outcome 1 Total exacerbations per participant.
2.2. Analysis.
Comparison 2 Inactivated + live virus versus inactivated virus + placebo, Outcome 2 Early exacerbations per participant.
2.3. Analysis.
Comparison 2 Inactivated + live virus versus inactivated virus + placebo, Outcome 3 Late exacerbations per participant.
There was no clear difference in the number of participants who reported improvements in their exacerbations (Peto 1.48, CI 0.30 to 7.42; P = 0.63; one RCT, 29 participants; Analysis 2.4); this finding was consistent when broken down into early improvements (Peto 1.65, 95% CI 0.16 to 17.49; one RCT, 29 participants; Analysis 2.5), and late improvements (Peto 1.26, 95% CI 0.19 to 8.43; one RCT, 29 participants; Analysis 2.6).
2.4. Analysis.
Comparison 2 Inactivated + live virus versus inactivated virus + placebo, Outcome 4 Participants with improvement in exacerbations.
2.5. Analysis.
Comparison 2 Inactivated + live virus versus inactivated virus + placebo, Outcome 5 Participants with early improvements.
2.6. Analysis.
Comparison 2 Inactivated + live virus versus inactivated virus + placebo, Outcome 6 Participants with late improvements.
In the Gorse 2003a paper, a univariate and stepwise multivariate logistic regression analysis of associations was performed, with at least a 15% improvement or worsening in health status, as measured by the chronic lung disease symptom index. This was a secondary study outcome. Analysis showed that 217 (21%) in the group that received inactive vaccine plus intranasal vaccine had at least a 15% improvement at the end of the study over pre‐vaccine status, compared with 163 (16%) in the control group that had received inactivated virus vaccine alone (OR 1.39, CI 1.10 to1.74).
Days of disability from respiratory illness
Not reported
Hospital admissions
Not reported
Mortality
In the Gorse 2003 paper, the largest study with 2215 participants, there were 64 deaths (3%); there was no difference between intervention and control groups for this outcome (OR 1.14, 95% CI 0.69 to 1.87; one RCT, 215 participants; Analysis 2.7). Of the 64 participants who died, five participants in the treatment group and two in the placebo group had influenza‐like illnesses, four of which were laboratory‐documented.
2.7. Analysis.
Comparison 2 Inactivated + live virus versus inactivated virus + placebo, Outcome 7 Mortality.
Secondary outcomes
Lung function
There was no consistent effect on early changes in lung function in Gorse 1997either in terms of percent predicted FEV1 (MD 2.90; 95% CI ‐14.14 to 19.94; one RCT, 20 participants; Analysis 2.8) or FEV1/FVC ratio (MD ‐0.90; 95% CI ‐12.02 to 10.22; one RCT, 29 participants; Analysis 2.9). The results from Gorse 2003 suggested significant effect on lung function in favour of the active virus group (MD ‐0.05; 95% CI ‐0.10 to 0.00, one RCT, 2215 participants; Analysis 2.10), however, there was a significant difference between the two study groups at baseline reported in the paper, with the active group being lower, and improving more. The investigators reported that they did not believe this to be clinically important. The lung functions of the two groups at the end of the study were similar. Gorse 1997 reported that more participants in the active virus group experienced a one category improvement in lung function compared to control, however, this was found to be non‐significant (Peto 4.00; 95% CI 0.68 to 23.60; one RCT, 29 participants; Analysis 2.11). The investigators also reported that a small number of participants in the active virus group experienced a one‐category decrease in lung function, however, once again this was found to be non‐significant (Peto 7.04; 95% CI 0.66 to 74.68; one RCT, 29 participants; Analysis 2.12). Gorse 2003 measured FEV1at the end of the study period and found that there was no evidence of an effect on lung function for those receiving the active virus compared to control (MD ‐0.05; 95% CI ‐0.16 to 0.06; one RCT, 382 participants; Analysis 2.13).
2.8. Analysis.
Comparison 2 Inactivated + live virus versus inactivated virus + placebo, Outcome 8 Early changes in lung function (% predicted FEV¹).
2.9. Analysis.
Comparison 2 Inactivated + live virus versus inactivated virus + placebo, Outcome 9 Early changes in lung function (FEV¹/FVC %).
2.10. Analysis.
Comparison 2 Inactivated + live virus versus inactivated virus + placebo, Outcome 10 Post immunisation lung function (FEV¹).
2.11. Analysis.
Comparison 2 Inactivated + live virus versus inactivated virus + placebo, Outcome 11 Participants with increased lung function (1 category).
2.12. Analysis.
Comparison 2 Inactivated + live virus versus inactivated virus + placebo, Outcome 12 Participants with decreased lung function.
2.13. Analysis.
Comparison 2 Inactivated + live virus versus inactivated virus + placebo, Outcome 13 FEV¹ at end of study.
The Treanor 1994 paper reported no significant differences in lung function between groups. From data supplied by the author, for the subgroup with underlying chronic lung disease, those who were vaccinated had a mean decrease in FEV1 from 1.8 litres to 1.6 litres, whereas for the one placebo recipient for whom lung function was recorded, there was a small increase in FEV1.
Adverse effects
There were no significant differences in the reports of new upper respiratory tract symptoms between the groups in the Gorse 1997 study (Peto 1.89, 95% CI 0.45 to 8.04; P = 0.39; one RCT, 29 participants; Analysis 2.14).
2.14. Analysis.
Comparison 2 Inactivated + live virus versus inactivated virus + placebo, Outcome 14 Participants with adverse effects (new upper respiratory tract symptoms).
There were no statistically significant differences between treatment and control for any adverse effects in the early period (Peto 0.86, 95% CI 0.63 to 1.17; P = 0.34; two RCTs, 2244 participants; Analysis 2.15). When evaluating the results of Gorse 2003 alone, the number of days participants displayed early signs and symptoms favoured control (MD 0.40; 95% CI 0.19 to 0.61; one RCT, 2215 participants; Analysis 2.16). Furthermore, analysis of the number of participants with early adverse events, divided in to sub‐groups by type, showed no evidence of an effect between intervention or control for any single adverse effect; however, the pooled effect was significantly in favour of the active virus group (OR 0.49; 95% CI 0.26 to 0.92; P = 0.027; one RCT, 2215 participants; Analysis 2.17).
2.15. Analysis.
Comparison 2 Inactivated + live virus versus inactivated virus + placebo, Outcome 15 Participants with early adverse effects.
2.16. Analysis.
Comparison 2 Inactivated + live virus versus inactivated virus + placebo, Outcome 16 Number of days with early symptoms and signs.
2.17. Analysis.
Comparison 2 Inactivated + live virus versus inactivated virus + placebo, Outcome 17 Number of participants with early adverse effects (by type).
There was some evidence of an effect for adverse effects in the late period following vaccination, favouring the control group (Peto 2.33, 95% CI 1.22 to 4.46; P = 0.011; two RCTs, 2244 participants; Analysis 2.18). Gorse 2003 stated in their paper that the proportion of participants with adverse effects at least possibly related to immunisation, did not differ between groups. There were, however, significantly fewer participants with early signs and symptoms in the group receiving inactivated virus vaccine only, as well as a smaller number of participants with late adverse effects. In this group, there was a total number of 99 events in 88 individuals (7.9% of total).
2.18. Analysis.
Comparison 2 Inactivated + live virus versus inactivated virus + placebo, Outcome 18 Participants with late adverse effects.
From one RCT (Gorse 2003) there was no evidence of an effect between active virus and control for the outcome of influenza‐related ARI (OR 0.84; 95% CI 0.57 to 1.24; one RCT, 2215 participants; Analysis 2.19). Further, data from the same study demonstrated no statistical difference in the number of participants with at least one influenza‐like illness between groups (OR 1.07; 95% CI 0.86 to 1.33; one RCT, 2215 participants; Analysis 2.20).
2.19. Analysis.
Comparison 2 Inactivated + live virus versus inactivated virus + placebo, Outcome 19 Acute respiratory illness subsequently documented as influenza‐related.
2.20. Analysis.
Comparison 2 Inactivated + live virus versus inactivated virus + placebo, Outcome 20 Participants with at least one influenza‐like illness.
In Treanor 1992 (523 participants), which was a study with a lung disease subgroup, 24% of the treatment group experienced respiratory illnesses compared to 28% of the control group. In the treatment group, 12% of participants experienced an influenza‐like illness, compared to 16% of the control group. In the control group, there were two cases of laboratory‐documented influenza A infection, which resulted in hospitalisation. One death due to influenza virus A infection occurred in the control group, compared to none in the treatment group. This study also showed that 10.1% of the treatment group experienced early adverse reactions, compared to 8.3% of the control group. In the treatment group, 3.9% of participants reported early systemic effects consisting of headache, myalgias, malaise, or fatigue, compared to 5.0% of the control group. Of the control group, 1.1% reported fever, and 2.7% of them reported respiratory symptoms consisting of rhinitis or pharyngitis. However, 2.2% of the treatment group reported fever, and 6.7% reported respiratory symptoms. Five per cent of the live virus vaccinees experienced sore arms, compared to 18% of the inactivated virus vaccinees. None of the placebo group reported sore arms. The tendency for inactivated virus to cause local side effects to a greater extent than live virus was statistically significant in this study (P = 0.02).
In the Gorse 1995 paper it was reported that 12% of all participants experienced transient, mild pain at the site of local intramuscular injection.
Acute respiratory illness subsequently proven to be influenza‐related
Not reported
Cost effectiveness
Not reported
Discussion
Summary of main results
This systematic review evaluated the few RCTs that have reported on the effects of influenza vaccination in people with COPD. Despite iterative and exhaustive searches, we only identified 11 studies that met our inclusion criteria, with only six of these having been performed solely on 2562 people with COPD or chronic bronchitis. The entry criteria for these studies were variously reported, but where reported, they showed that the majority of participants had a smoking history and airway obstruction. The earlier studies enrolled younger participants than the more recent studies. The other studies in the review included older participants, those with chronic illnesses, or both, of whom a subset had chronic lung disease.
Influenza vaccination versus placebo
There was no evidence of any significant effect on hospitalisation, mortality rates, lung function decline, or exercise tolerance between the vaccine and placebo groups. For the infrequent outcomes of hospitalisation and mortality, the studies were probably too small to detect any difference. One participant in the control group in Gorse 2003 developed Guillain–Barré syndrome, although further details of severity and outcome were not provided. Thus, this review showed no evidence of an increase in Guillain–Barré syndrome with vaccination.
We did not intend to evaluate serological outcomes, such as a significant rise in antibody titre in this review. However, some authors looked at outcomes in the subgroup with a serological response to vaccination. The limited data from these comparisons was consistent with that of the clinical outcomes alone. It also suggested that if people seroconverted, they had fewer adverse effects.
Neuzil 2003 and Wongsurakiat 2004a studied the clinical presentation of symptomatic laboratory‐documented influenza (LDI). Using stepwise logistic regression, Neuzil 2003 found that during an influenza outbreak period, only fever and myalgia were associated with LDI. Together, they had a positive predictive value of 41%. In Wongsurakiat 2004a, the most specific presentation of LDI was 'influenza‐like illness' (namely generalised aches, fever and headache, with or without respiratory tract symptoms). However, LDI occurred in only 10% of participants, indicating a low positive predictive value of this symptom complex for LDI. The conclusion was that it was difficult to diagnose influenza infection clinically, with certainty, in people with COPD.
The one cost‐effectiveness analysis that was conducted, based on an RCT, suggested that inactivated virus vaccination was highly cost‐effective in people with COPD, particularly those with severe airways obstruction. This analysis took into account direct health care costs only, and not indirect costs, or any future health care costs that might be incurred by people with COPD living longer. It was conducted in a non‐epidemic year, and therefore, underestimated the benefits that would be gained in an epidemic year.
Influenza vaccinations were generally well tolerated. There was a significant increase in local effects ranging from pain at the site of injection, to erythema, with or without induration, but all effects appeared to be mild and transitory. These findings were consistent with results from Nichol 1994, a large, well conducted randomised placebo‐controlled trial of influenza vaccination in healthy adults, in which they observed no significant side effects of vaccination, except for arm soreness (63.8% of vaccinees compared to 24.1% placebo; P = 0.001).
One of the main barriers to increasing vaccination rates in people with COPD is the concern of patients and their health professionals that vaccination may increase early exacerbations, before immunity has developed. The evidence in this review showed that inactivated virus vaccination did not have a significant impact, on either the total number of early exacerbations, or on the number of people with COPD who had early exacerbations or early acute respiratory illnesses.
Live attenuated intranasal plus inactivated intramuscular versus placebo intranasal plus inactivated intramuscular vaccination
Because of the risk of influenza and the lesser immunogenicity of vaccines in the elderly (including people with COPD), there is interest in the extra protection afforded by the addition of live attenuated virus to inactivated virus vaccination. This approach to clinical trial design has the advantage that high‐risk groups are not denied vaccination, but larger numbers of participants are needed if the study is to have sufficient power to detect an effect. The studies in this review showed that there was no greater protective effect of live plus inactivated vaccine over inactivated vaccine alone in any of the clinical outcomes of interest. On the other hand, there may be a slight increase in adverse effects with the combination, although this was seen only in Gorse 2003, and the investigators did not regard it as significant.
Overall completeness and applicability of evidence
Recent literature searches indicated that new RCTs for influenza vaccine in COPD have stagnated, with no studies meeting our inclusion criteria since 2006. This is perhaps a reflection of consistent recommendations in major clinical guidelines for COPD management over the last decade, based on existing observational studies and limited placebo controlled RCTs. The most recent updated search for this review returned a number of studies investigating immunostimulants for COPD management, and while outside the scope of this review, may present an adjunct to disease management, by preventing respiratory tract infection and subsequent COPD exacerbations (Collet 1997).
Quality of the evidence
The main issue was that there were few RCTs of influenza vaccinations in COPD, and data were generally not reported in the same way. Where data were combined, confidence intervals were wide, making it difficult to determine whether 'no evidence of effect' actually meant 'evidence of no effect', or an effect was missed. However, the studies that were found were of satisfactory methodological quality, with almost all low or unclear risk of bias assessments in all domains. The effects observed in RCTs were internally consistent, biologically plausible, and supported by observational studies. Furthermore, result from the two main studies had little heterogeneity between them.
Potential biases in the review process
We performed the review in accordance with a pre‐published protocol to reduce biases. However, we did make some post hoc changes, See Differences between protocol and review.
Agreements and disagreements with other studies or reviews
In the original Cochrane Review in 2000, we wrote "the strong recommendations in current guidelines make it ethically difficult now to conduct large, randomised, placebo‐controlled trials of influenza vaccination, even though it would appear desirable to do so". Interestingly, and without our knowledge, such a trial had been conducted but not reported at the time (Wongsurakiat 2004a). The authors believed the study to be justified on the grounds that prior to 1997, influenza vaccine had been unavailable in Thailand. This study of inactivated influenza vaccination tracked 125 participants over one year following vaccination, with only three dropouts. An analysis with the results from Howells 1961, another carefully conducted RCT, showed that inactivated influenza vaccine significantly reduced COPD exacerbations with an effectiveness ((1‐RR) x 100%) of over 60%. Moreover, inactivated influenza vaccination had an effectiveness of over 80% in reducing influenza‐related acute respiratory illness (ARI).
The effectiveness of vaccination was confined to late exacerbations, i.e. those occurring more than three to four weeks after inactivated virus vaccination. The investigators chose to study this time period specifically, in order to allow time for immunity to develop. The authors of Wongsurakiat 2004a and others made the point that the effectiveness of the vaccine in reducing exacerbations depended on how much influenza‐related ARI was present during the study period, i.e. whether there was an epidemic or not. Fell 1977 and Wongsurakiat 2004a were conducted in non‐epidemic years, whereas Howells 1961 was undertaken in an epidemic year. Influenza virus caused 8% of the 'acute exacerbation' and 10% of the 'influenza‐like illness' presentations in Wongsurakiat 2004a, but was responsible for 37% of the acute exacerbations in Howells 1961.
To further emphasise this point, the findings of Howells 1961 and Wongsurakiat 2004a were both consistent with Govaert 1994a, a large (N = 1906), high quality RCT conducted in older people, 9% of whom had chronic lung disease. It assessed the effect of inactivated influenza virus vaccination on the development of influenza or influenza‐like illnesses. When such illnesses were diagnosed by clinical assessment, the relative risk for influenza‐related illness was 0.53 (95% CI 0.39 to 0.73). When the diagnosis was made using the International Classification of Health Problems in Primary Care (ICHPPC‐2‐Defined), the relative risk was 0.83 (95% CI 0.65 to 1.05). However, post hoc analysis showed that during an epidemic, the relative risk for influenza‐related illness diagnosed by clinical assessment was 0.41 (95% CI 0.28 to 0.61), and by ICHPPC‐2‐Defined criteria was 0.74 (95% CI 0.24 to 1.00). This study also demonstrated an overall halving of influenza risk by vaccination. Results for subgroups of those participants at high risk (including those with lung conditions) and those over the age of 70 years were not statistically significant, but the numbers in each group were small. In Treanor 1994, a study of older people who were in institutions where laboratory‐documented outbreaks of influenza A occurred, only 8% of the treatment group, compared to 20% of the control group, had respiratory illnesses. Similarly, only 4% of the treatment group, compared to 11% of the control group, experienced an influenza‐like illness. Inactivated influenza vaccination is likely to have an even greater effect in epidemic years than seen in this review.
Even though the number of RCTs (and participants) was relatively small, the effectiveness of influenza vaccination seen in this review was consistent with that seen in large observational studies. In one of these, involving 1900 older people with chronic lung disease, those who were vaccinated had a halving of the risk of hospitalisation for pneumonia, and a 70% reduction in the risk of death during influenza seasons (Nichol 1999). A meta‐analysis of 20 cohort studies of influenza vaccination in the older population showed a 56% reduction in respiratory illnesses and a 50% reduction in hospitalisation (Gross 1995). Most of these studies had been conducted in epidemic years.
Authors' conclusions
Implications for practice.
There was RCT‐based evidence that inactivated influenza vaccination had a clinically important and significant effect on influenza‐related exacerbations, and probably an effect on the total of exacerbations in people with COPD. This effect is likely to be greater in epidemic years when the proportion of exacerbations due to influenza would be higher. The sizes of the effect were similar to those seen in cohort studies, and there was no evidence that inactivated virus vaccination caused exacerbations. The addition of intranasal live attenuated virus did not confer any added benefit.
While influenza vaccine was associated with significant reductions in exacerbation rates compared with placebo, it was associated with local adverse effects.
To reduce exacerbations in COPD overall would require a combination of approaches, including vaccination, as only a small percentage were caused by the influenza virus. In people with COPD, symptomatic influenza infections were difficult to diagnose clinically, with any certainty.
Implications for research.
The evidence of effectiveness of influenza from observational studies has been viewed by many as sufficient for the strong recommendations in COPD guidelines. These studies may be biased, as there are potentially many differences between those who volunteer to be vaccinated and those who do not. Only some of the biases can be controlled for. These strong recommendations are now supported by some good quality RCT data. It is ethically difficult to conduct further large, randomised, placebo‐controlled trials of influenza vaccination, even though it would appear desirable to do so. Any planned study would need to be large, since the incidence of influenza is low (particularly in non‐epidemic years) and vaccine efficacy is less than 100% in older people. The effectiveness of influenza vaccination is best determined during epidemic years, with a good match between vaccine and circulating strains, yet this is not known until the influenza season starts, by which time trials have started. For studies conducted during non‐epidemic times, results from participants who seroconvert may be used as a surrogate to determine the effectiveness of immunisation, however, clinical outcomes need to be reported, particularly if cost‐effectiveness is to be studied.
There are still insufficient data from large enough RCTs to determine the effect of vaccination on rarer events in the trial period, such as hospitalisation or mortality. Measures of health status should be built into clinical studies of COPD as a matter of course.
Public health and policy approaches to increasing vaccine uptake need studying and incorporation into a systematic review, as do public health and other approaches to reducing the impact of influenza outbreaks. Studies should continue to look at ways to improve the effectiveness of vaccines, or combinations of vaccines. This might include adding new vaccine types, while administering the recommended inactivated virus vaccine, or conducting short term placebo‐controlled studies, at the end of which all placebo recipients are vaccinated.
What's new
| Date | Event | Description |
|---|---|---|
| 5 December 2017 | New search has been performed | Literature search keywords updated and search re‐run |
| 5 December 2017 | New citation required but conclusions have not changed | No new studies included. Updated to current review format including summary of findings table and risk of bias. |
History
Protocol first published: Issue 2, 1999 Review first published: Issue 3, 2000
| Date | Event | Description |
|---|---|---|
| 11 June 2010 | New search has been performed | Literature search re‐run; no new studies found. |
| 23 June 2009 | New search has been performed | Literature search re‐run; no new studies found. |
| 28 July 2008 | Amended | Converted to new review format. |
| 14 May 2007 | New search has been performed | Literature search conducted, no new studies found. Second published report of Gorse 2003 located via searching added, and consequential text changes made. |
| 15 August 2006 | New citation required and conclusions have changed | There are two new trials (five reports). Gorse 2003 included 2215 people with COPD and Wongsurakiat 2004 included 132 people with COPD. New outcomes have been included: *Acute infection subsequently documented as influenza‐related *Cost effectiveness *Number of people with exacerbations A significant protective effect has now been shown of influenza vaccine on exacerbations of COPD. |
Acknowledgements
Chris Cates was the contact editor for the review and commented critically on it.
We would like to acknowledge the work of original authors not involved in the update of this review:
Emme E. Chacko, who contributed to the initial literature search, reviewed papers for inclusion, contributed to the format of the data extraction sheet, data extraction, review write up, analyses, and discussion. Collaborated on 2004‐5 update.
We would like to thank the following authors for writing back with information to assist us: John J. Treanor (who supplied individual participant data from the 1994 study) Geoffrey J. Gorse (who supplied us with references to his other studies) Thomas Cate (who supplied us with data from the 1977 study) Phile Govaert (who supplied us with data from the 1993/1994 lung disease subgroup) Phunsup Wongsurakiat (who responded to a request for more data from his trial at a time when his country had just been severely affected by the Indian Ocean tsunami).
We acknowledge the support of: Steve Milan, Toby Lasserson, Karen Blackhall, Emma Jackson, Emma Dennett, and Liz Stovold (Cochrane Airways Group)
We thank the following personnel from pharmaceutical companies for assisting us in our search for studies: Angela Zyzalo (Smithkline Beecham) Rob Cummins (Wyeth, Sydney) Ian Gust and Eveline Niedermayr (Commonwealth Serum Laboratories) Mike Taylor, Leslie Weston (Glaxo‐Wellcome) Jenny Hertz (Pasteur Merieux)
The Background and Methods section of this review are based on a standard template used by Cochrane Airways.
This project was supported by the National Institute for Health Research (NIHR), via Cochrane Infrastructure funding to the Cochrane Airways Group. The views and opinions expressed therein are those of the authors and do not necessarily reflect those of the Systematic Reviews Programme, NIHR, NHS, or the Department of Health.
Appendices
Appendix 1. Sources and search methods for the Cochrane Airways Trials Register
Electronic searches: core databases
| Database | Frequency of search |
| CENTRAL (the Cochrane Library) | Monthly |
| MEDLINE (Ovid) | Weekly |
| Embase (Ovid) | Weekly |
| PsycINFO (Ovid) | Monthly |
| CINAHL (EBSCO) | Monthly |
| AMED (EBSCO) | Monthly |
Handsearches: core respiratory conference abstracts
| Conference | Years searched |
| American Academy of Allergy, Asthma and Immunology (AAAAI) | 2001 onwards |
| American Thoracic Society (ATS) | 2001 onwards |
| Asia Pacific Society of Respirology (APSR) | 2004 onwards |
| British Thoracic Society Winter Meeting (BTS) | 2000 onwards |
| Chest Meeting | 2003 onwards |
| European Respiratory Society (ERS) | 1992, 1994, 2000 onwards |
| International Primary Care Respiratory Group Congress (IPCRG) | 2002 onwards |
| Thoracic Society of Australia and New Zealand (TSANZ) | 1999 onwards |
MEDLINE search strategy used to identify trials for the Cochrane Airways Trials Register
COPD search
1. Lung Diseases, Obstructive/
2. exp Pulmonary Disease, Chronic Obstructive/
3. emphysema$.mp.
4. (chronic$ adj3 bronchiti$).mp.
5. (obstruct$ adj3 (pulmonary or lung$ or airway$ or airflow$ or bronch$ or respirat$)).mp.
6. COPD.mp.
7. COAD.mp.
8. COBD.mp.
9. AECB.mp.
10. or/1‐9
Filter to identify RCTs
1. exp "clinical trial [publication type]"/
2. (randomized or randomised).ab,ti.
3. placebo.ab,ti.
4. dt.fs.
5. randomly.ab,ti.
6. trial.ab,ti.
7. groups.ab,ti.
8. or/1‐7
9. Animals/
10. Humans/
11. 9 not (9 and 10)
12. 8 not 11
The MEDLINE strategy and RCT filter are adapted to identify trials in other electronic databases
Appendix 2. Search strategy to identify relevant trials from the Cochrane Airways Trials Register
Search via Cochrane Register of Studies (CRS Web)
#1 MeSH DESCRIPTOR Pulmonary Disease, Chronic Obstructive Explode All #2 MeSH DESCRIPTOR Bronchitis, Chronic #3 (obstruct*) near3 (pulmonary or lung* or airway* or airflow* or bronch* or respirat*) #4 COPD:MISC1 #5 (COPD OR COAD OR COBD OR AECOPD):TI,AB,KW #6 #1 OR #2 OR #3 OR #4 OR #5 #7 MeSH DESCRIPTOR Influenza Vaccines #8 MeSH DESCRIPTOR Vaccines #9 (influenza* or flu*) NEAR (vaccin* or immuni* or inoculat*) #10 flumist #11 trivalent #12 CAIV #13 LAIV #14 medimmune #15 #7 or #8 or #9 or #10 or #11 or #12 or #13 or #14 #16 #6 AND #15
Data and analyses
Comparison 1. Inactivated influenza vaccine versus placebo.
| Outcome or subgroup title | No. of studies | No. of participants | Statistical method | Effect size |
|---|---|---|---|---|
| 1 Total exacerbations per participant | 2 | 180 | Mean Difference (IV, Fixed, 95% CI) | ‐0.37 [‐0.64, ‐0.11] |
| 2 Early exacerbations per participant | 2 | 180 | Mean Difference (IV, Fixed, 95% CI) | 0.01 [‐0.11, 0.13] |
| 3 Late exacerbations per participant | 2 | 180 | Mean Difference (IV, Fixed, 95% CI) | ‐0.39 [‐0.61, ‐0.18] |
| 4 Participants with at least one exacerbation or acute respiratory illness | 3 | 222 | Peto Odds Ratio (Peto, Fixed, 95% CI) | 0.81 [0.44, 1.48] |
| 4.1 Clinical exacerbations | 2 | 97 | Peto Odds Ratio (Peto, Fixed, 95% CI) | 1.06 [0.48, 2.33] |
| 4.2 Any acute respiratory illness | 1 | 125 | Peto Odds Ratio (Peto, Fixed, 95% CI) | 0.56 [0.22, 1.42] |
| 5 Participants with early exacerbations | 2 | 180 | Peto Odds Ratio (Peto, Fixed, 95% CI) | 1.08 [0.52, 2.26] |
| 6 Participants with late exacerbations | 1 | Peto Odds Ratio (Peto, Fixed, 95% CI) | Totals not selected | |
| 7 Hospital admissions | 2 | 180 | Peto Odds Ratio (Peto, Fixed, 95% CI) | 0.33 [0.09, 1.24] |
| 7.1 Clinical exacerbations | 1 | 55 | Peto Odds Ratio (Peto, Fixed, 95% CI) | 0.14 [0.01, 2.39] |
| 7.2 Influenza‐related exacerbations | 1 | 125 | Peto Odds Ratio (Peto, Fixed, 95% CI) | 0.41 [0.09, 1.89] |
| 8 Mortality (all cause) | 2 | 180 | Peto Odds Ratio (Peto, Fixed, 95% CI) | 0.87 [0.28, 2.70] |
| 9 Mortality (acute respiratory illness‐related) | 1 | Odds Ratio (M‐H, Fixed, 95% CI) | Totals not selected | |
| 10 Overall change in lung function (FEV¹, L) | 1 | Mean Difference (IV, Fixed, 95% CI) | Totals not selected | |
| 11 Change in early lung function (FEV¹, L) | 1 | Mean Difference (IV, Fixed, 95% CI) | Totals not selected | |
| 12 Systemic adverse effects | 1 | Odds Ratio (M‐H, Fixed, 95% CI) | Totals not selected | |
| 13 Local effects at injection site | 1 | Odds Ratio (M‐H, Fixed, 95% CI) | Totals not selected | |
| 14 Participants with early breathlessness | 1 | Peto Odds Ratio (Peto, Fixed, 95% CI) | Totals not selected | |
| 15 Participants with early tightness | 1 | Peto Odds Ratio (Peto, Fixed, 95% CI) | Totals not selected | |
| 16 Participants with early wheeze | 1 | Peto Odds Ratio (Peto, Fixed, 95% CI) | Totals not selected | |
| 17 Participants with early cough | 1 | Peto Odds Ratio (Peto, Fixed, 95% CI) | Totals not selected | |
| 18 Acute respiratory illness subsequently documented as influenza‐related | 2 | 180 | Odds Ratio (M‐H, Fixed, 95% CI) | 0.19 [0.07, 0.48] |
| 18.1 FEV¹ ≥ 70% predicted | 1 | 45 | Odds Ratio (M‐H, Fixed, 95% CI) | 0.12 [0.01, 1.11] |
| 18.2 Participants with chronic bronchitis | 1 | 55 | Odds Ratio (M‐H, Fixed, 95% CI) | 0.19 [0.04, 0.96] |
| 18.3 FEV¹ < 50% predicted | 1 | 47 | Odds Ratio (M‐H, Fixed, 95% CI) | 0.11 [0.01, 0.99] |
| 18.4 FEV¹ 50% to 69% predicted | 1 | 33 | Odds Ratio (M‐H, Fixed, 95% CI) | 0.46 [0.07, 2.98] |
| 19 Early acute respiratory illness (ARI) | 1 | 250 | Odds Ratio (M‐H, Fixed, 95% CI) | 0.72 [0.34, 1.50] |
| 19.1 ARI within 1 week of vaccination | 1 | 125 | Odds Ratio (M‐H, Fixed, 95% CI) | 1.02 [0.24, 4.26] |
| 19.2 ARI between 1 and 4 weeks after vaccination | 1 | 125 | Odds Ratio (M‐H, Fixed, 95% CI) | 0.63 [0.27, 1.50] |
| 20 Participants with early sputum production | 1 | Peto Odds Ratio (Peto, Fixed, 95% CI) | Totals not selected |
Comparison 2. Inactivated + live virus versus inactivated virus + placebo.
| Outcome or subgroup title | No. of studies | No. of participants | Statistical method | Effect size |
|---|---|---|---|---|
| 1 Total exacerbations per participant | 2 | 1137 | Mean Difference (IV, Fixed, 95% CI) | 0.01 [‐0.35, 0.37] |
| 2 Early exacerbations per participant | 1 | Mean Difference (IV, Fixed, 95% CI) | Totals not selected | |
| 3 Late exacerbations per participant | 1 | 29 | Mean Difference (IV, Fixed, 95% CI) | 0.23 [‐0.08, 0.54] |
| 4 Participants with improvement in exacerbations | 1 | 29 | Peto Odds Ratio (Peto, Fixed, 95% CI) | 1.48 [0.30, 7.42] |
| 5 Participants with early improvements | 1 | Peto Odds Ratio (Peto, Fixed, 95% CI) | Totals not selected | |
| 6 Participants with late improvements | 1 | Peto Odds Ratio (Peto, Fixed, 95% CI) | Totals not selected | |
| 7 Mortality | 1 | Odds Ratio (M‐H, Fixed, 95% CI) | Totals not selected | |
| 8 Early changes in lung function (% predicted FEV¹) | 1 | Mean Difference (IV, Fixed, 95% CI) | Totals not selected | |
| 9 Early changes in lung function (FEV¹/FVC %) | 1 | Mean Difference (IV, Fixed, 95% CI) | Totals not selected | |
| 10 Post immunisation lung function (FEV¹) | 1 | Mean Difference (IV, Fixed, 95% CI) | Totals not selected | |
| 11 Participants with increased lung function (1 category) | 1 | Peto Odds Ratio (Peto, Fixed, 95% CI) | Totals not selected | |
| 12 Participants with decreased lung function | 1 | Peto Odds Ratio (Peto, Fixed, 95% CI) | Totals not selected | |
| 13 FEV¹ at end of study | 1 | Mean Difference (IV, Fixed, 95% CI) | Totals not selected | |
| 14 Participants with adverse effects (new upper respiratory tract symptoms) | 1 | 29 | Peto Odds Ratio (Peto, Fixed, 95% CI) | 1.89 [0.45, 8.04] |
| 15 Participants with early adverse effects | 2 | 2244 | Peto Odds Ratio (Peto, Fixed, 95% CI) | 0.86 [0.63, 1.17] |
| 16 Number of days with early symptoms and signs | 1 | Mean Difference (IV, Fixed, 95% CI) | Totals not selected | |
| 17 Number of participants with early adverse effects (by type) | 1 | Odds Ratio (M‐H, Fixed, 95% CI) | Subtotals only | |
| 17.1 COPD | 1 | 2215 | Odds Ratio (M‐H, Fixed, 95% CI) | 0.66 [0.30, 1.48] |
| 17.2 Dyspnoea | 1 | 2215 | Odds Ratio (M‐H, Fixed, 95% CI) | 1.81 [0.60, 5.41] |
| 17.3 Pharyngitis | 1 | 2215 | Odds Ratio (M‐H, Fixed, 95% CI) | 1.00 [0.35, 2.86] |
| 17.4 Flu syndrome | 1 | 2215 | Odds Ratio (M‐H, Fixed, 95% CI) | 0.62 [0.20, 1.91] |
| 17.5 Rhinitis | 1 | 2215 | Odds Ratio (M‐H, Fixed, 95% CI) | 1.50 [0.42, 5.34] |
| 17.6 Bronchitis | 1 | 2215 | Odds Ratio (M‐H, Fixed, 95% CI) | 2.01 [0.50, 8.05] |
| 17.7 Increased cough | 1 | 2215 | Odds Ratio (M‐H, Fixed, 95% CI) | 0.60 [0.14, 2.51] |
| 17.8 Myalgia | 1 | 2215 | Odds Ratio (M‐H, Fixed, 95% CI) | 2.51 [0.49, 12.96] |
| 17.9 Increased sputum | 1 | 2215 | Odds Ratio (M‐H, Fixed, 95% CI) | 0.75 [0.17, 3.36] |
| 17.10 Pneumonia | 1 | 2215 | Odds Ratio (M‐H, Fixed, 95% CI) | 2.01 [0.37, 10.97] |
| 17.11 Asthenia | 1 | 2215 | Odds Ratio (M‐H, Fixed, 95% CI) | 2.01 [0.37, 10.97] |
| 17.12 Guillain‐Barré syndrome | 1 | 2215 | Odds Ratio (M‐H, Fixed, 95% CI) | 0.33 [0.01, 8.19] |
| 17.13 Other | 1 | 2215 | Odds Ratio (M‐H, Fixed, 95% CI) | 0.49 [0.26, 0.92] |
| 18 Participants with late adverse effects | 2 | 2244 | Peto Odds Ratio (Peto, Fixed, 95% CI) | 2.33 [1.22, 4.46] |
| 19 Acute respiratory illness subsequently documented as influenza‐related | 1 | Odds Ratio (M‐H, Fixed, 95% CI) | Totals not selected | |
| 20 Participants with at least one influenza‐like illness | 1 | Odds Ratio (M‐H, Fixed, 95% CI) | Totals not selected |
Characteristics of studies
Characteristics of included studies [ordered by study ID]
Cate 1977.
| Methods | Duration: about 7 months Withdrawals: 8 volunteers were lost but none had experienced vaccination‐related complications. Follow‐up schedule: adverse reactions recorded on days 1 and 2 post vaccination. HAI antibody litres at 4 weeks compared after re‐vaccinations for a subgroup 5 months later. |
|
| Participants | Setting: June to Nov 1976, Texas Medical Centre, USA Number: 413; 8 withdrawals; 348 in combined vaccine groups Characteristics: all participants were ambulatory and either older (> 50 years) or high‐risk adults. The average age was 64.3 (SD 7.3) years with 60.7% female participants. About 5% had lung disease, most of which was COPD. 35% were considered high‐risk, due to cardiovascular complications, chronic and underlying disease. Baseline characteristics: no details Comorbidities: no details Diagnostic criteria: over the age of 50 years, or adults with a chronic disorder that placed them at high risk for serious complications of influenza infection. Exclusion criteria: no details |
|
| Interventions | Vaccination type: inactivated, bivalent influenza virus vaccine (A/New Jersey/76 and A/Victoria/75) in 200/200 or 400/400 CCA units, 0.5 mL dosage intramuscularly Vaccines were either subvirion or whole. Control: saline placebo, intramuscular, 0.5 mL dosage |
|
| Outcomes | Early: days 1 and 2 post vaccination. Adverse effects were recorded as symptom scores, including systemic and local reactions. Serology; HAI antibody titres were performed at 4 weeks Late: HAI antibody titres performed again after revaccination in a subgroup, about 5 months later. |
|
| Notes | Not specifically people with COPD | |
| Risk of bias | ||
| Bias | Authors' judgement | Support for judgement |
| Random sequence generation (selection bias) | Unclear risk | Quasi‐randomised |
| Allocation concealment (selection bias) | Unclear risk | Vaccines and placebo provided in randomly arranged coded sets of 10 dose vials, with a rotating sequence of administration |
| Blinding of participants and personnel (performance bias) All outcomes | Unclear risk | Placebo controlled, but did not state if placebo identical‐looking |
| Blinding of outcome assessment (detection bias) All outcomes | Unclear risk | Insufficient information to make determination |
| Incomplete outcome data (attrition bias) All outcomes | Unclear risk | Eight volunteers lost to follow‐up reported as "none known to have had any unexpected complication from the vaccination." Further details were not provided |
| Selective reporting (reporting bias) | Unclear risk | No trial registry record available |
| Other bias | Unclear risk | Used volunteers and provided reimbursement to participants. None noted |
Fell 1977.
| Methods | Duration: 20 weeks Withdrawals: 1 (vaccinated participant developed pleuritic pain on day 14 of baseline) Follow‐up schedule: during exacerbations |
|
| Participants | Setting: Nov 1975, group practice; Deddington, Oxfordshire, UK (non‐epidemic
conditions) Number: 45 enrolled; 22 in vaccinated group, 23 in control. 1 vaccinated participant withdrew during baseline Characteristics: 28 men (64%) and the average age was 59.43 years. Baseline characteristics: The average age of the vaccinated group was 61 years and 58 years in the control group. The proportion of men in the vaccinated group was 57% but 70% in the control. Smoking histories were similar. Randomisation was unsuccessful in a number of areas; symptom scores of first 2 weeks after vaccination were used. The vaccinated group had greater symptom reports (not statistically significant) and lower mean PEFR. 19% of the vaccinated group had histories of asthma and 30% were on digoxin at entry, while none in the control had either. Over 60% of the vaccinated group had circulating HAI antibody against the Wellcome Research Laboratories (WRL) 105 strain before vaccination while less than 35% of the control did. Comorbidities: past history of asthma in 19% and use of digoxin in 30 % of vaccinated Diagnostic criteria: chronic bronchitis; 3 months productive cough annually for 3 years, MRC questionnaire completed. Severity of COPD unclear Exclusion criteria: none described |
|
| Interventions | Vaccination type: live attenuated, WRL‐105 (A/Finland/4/74‐H3N2, A/Okuda/57‐H2N2), intranasal, 0.5 mL carrier, 0.25 per nostril. Control: placebo, freeze‐dried excipients of vaccine, indistinguishable by appearance or reconstitution |
|
| Outcomes | Early: adverse effects in Weeks 1 and 2 recorded by guided participant self‐assessment, hospitalisation. Late: respiratory scores of adverse reactions greater than baseline, antibody responses to vaccination. |
|
| Notes | Prescribed use of live vaccination but was a small study, conducted in a non‐ epidemic setting | |
| Risk of bias | ||
| Bias | Authors' judgement | Support for judgement |
| Random sequence generation (selection bias) | Unclear risk | Random allocation reported, however, no details regarding methods of randomisation reported |
| Allocation concealment (selection bias) | Unclear risk | Information not available |
| Blinding of participants and personnel (performance bias) All outcomes | Low risk | Placebo controlled. "The freeze‐dried excipients of the vaccine were used as placebo, which was indistinguishable from vaccine in appearance or reconstitution characteristics." |
| Blinding of outcome assessment (detection bias) All outcomes | Low risk | Participants completed self‐assessments but were blinded to intervention |
| Incomplete outcome data (attrition bias) All outcomes | Low risk | Reported exclusion of one participant from analyses |
| Selective reporting (reporting bias) | Unclear risk | No trial registry record available |
| Other bias | Unclear risk | Insufficient information to make determination |
Gorse 1995.
| Methods | Duration: 4 weeks Withdrawals: no details Follow‐up schedule: days 1 to 7 with immunological assays conducted on days 14 and 28 |
|
| Participants | Setting: 1993 to 1994; Jefferson Barracks Division Nursing home, St Louis VA Medical Centre and at St Louis Altenheim nursing home, USA Number: 50; 25 in each of treatment and control groups Characteristics: older adults, chronically ill nursing home residents, 86% male, average age 74.95 years Baseline characteristics: generally comparable with average age in the treatment group being 74.3 (SE 1.6) years and 75.6 (SE 1.9) years in the control. 28% of the treatment group had lung conditions and 36% of the control. Levels of other Comorbidities, WBC counts, cholesterol, and pre‐vaccination serum HAI antibodies were similar Comorbidities: heart 64%, lung 32%, neurologic 84%, diabetes mellitus 40%, GI 30%, renal 24%, tobacco use 70%, alcohol use 62% Diagnostic criteria: older adults > 60 years, (32% with lung disease) Exclusion criteria: 1. history of hypersensitivity to influenza virus vaccines and eggs, 2. receipt of influenza vaccination less than 6 months prior to study, 3. incompetence to give written informed consent, 4. current administration of any antineoplastic chemotherapy, 5. hematologic malignancy not in remission, 6. blood haemoglobin levels less than 11 g/dL |
|
| Interventions | Vaccination type: 1. Bivalent live attenuated influenza A virus vaccine (CAV) derived from cold‐adapted influenza A/Ann Arbor/6/60 (H2N2) and A/Kawasaki/9/86 (H1N1) and A/Beijing/353/89 (H3N2). Intranasal; 0.5 mL dose. 2. Trivalent inactivated subvirion influenza virus vaccine (TVV). The first 26 received A/Texas/36/91 (H1N1), A/Beijing/353/89 (H3N2), B/Panama/45/90. The next 26 received A/Texaz/36/91 (H1N1), A/Beijing/32/92 (H3N2), and B/Panama/45/90 Intramuscular Control: 1. Saline placebo intranasal 2. Trivalent inactivated influenza virus vaccines (TVV), Intramuscular, identical to vaccinated group |
|
| Outcomes | Early: adverse effects; mild upper respiratory symptoms, transient mild pain, malaise, febrile illness. Serology; virus titres determined and levels of anti‐influenza A virus cytotoxic activity Late: serology, some adverse effects |
|
| Notes | Not specifically COPD participants. There is a possible advantage of administering live attenuated with inactivated virus because in frail older people who have decreased immune responsiveness due to underlying disease, there is evidence of increased memory of anti‐influenza A virus cytotoxic T cell (CTL) activity. | |
| Risk of bias | ||
| Bias | Authors' judgement | Support for judgement |
| Random sequence generation (selection bias) | Unclear risk | Of each consecutive pair enrolled, one was assigned to intervention and one to control |
| Allocation concealment (selection bias) | Unclear risk | Insufficient information to make determination |
| Blinding of participants and personnel (performance bias) All outcomes | Unclear risk | Placebo‐controlled. Same delivery method with participants and laboratory personnel blinded. See below — study nurse was unblinded |
| Blinding of outcome assessment (detection bias) All outcomes | High risk | The nurse administering the immunisation was unblinded. This study nurse also "examined the vaccine injection site and evaluated the subjects for clinical signs and symptoms of influenza virus infection on 4 of the first 7 days, and 2 and 4 weeks after vaccination." |
| Incomplete outcome data (attrition bias) All outcomes | Unclear risk | Reported that three participants could not be evaluated, but no further explanation given |
| Selective reporting (reporting bias) | Unclear risk | Insufficient information to make determination |
| Other bias | Unclear risk | Insufficient information to make determination |
Gorse 1997.
| Methods | Randomisation: no details Allocation concealment: participants and study personnel were blinded but not the study nurse administering vaccines Outcome assessment was conducted under blind conditions. Duration: unclear, more than 28 days Withdrawals: none reported Follow‐up schedule: clinical evaluation 3 times between each of days 1 to 5, 7 to 10, 21 to 28 after immunisation |
|
| Participants | Setting: 1994 to 1995
Outpatient clinics of St Louis Department of Veterans Affairs Medical Centre, USA Number: 29; 16 in CAV/TVV group and 13 in TVV/placebo group Characteristics: the average age was 65.2 (SD 2.1) years. All male volunteers. Demographic characteristics and mean pre‐vaccination clinical lab tests were comparable; mean total WBC was 7710 (SD 298) cells/microL. Mean lymphocytes were 22.7% (SD 1.4) of total WBC. Mean serum albumin was 4.3 (SD 0.07) g/dL. Mean total cholesterol was 222.8 (SD 12.4) mg/dL. Baseline characteristics: demographics and lab results largely comparable. Proportions of participants with underlying medical illnesses comparable with the exception of higher proportion of liver disease in CAV/TVV group Comorbidities: 32% of CAV/TVV participants had underlying liver disease. Overall, other diseases were comparable; 21% renal, 66% heart disease, 38% neurologic, 21% diabetes mellitus. 97% of the participants reported having smoked tobacco products in the past. 90% reported having consumed alcohol in the past. Diagnostic criteria: COPD with severe obstruction to airflow on average and FEV1/FVC% < 70%. Medical history consisting of respiratory symptoms, physical examination and clinical lab tests were used. Exclusion criteria: 1. History of hypersensitivity to influenza virus and eggs 2. Receipt of influenza vaccine < 6 months prior to enrolment 3. Incompetence to give written informed consent 4. Co‐administration of immunosuppressive medication 5. Hematologic malignancy not in remission 6. Blood Hb concentration < 11g/dL |
|
| Interventions | Vaccination type: 1. Bivalent live attenuated influenza virus vaccine (CAV) derived from cold‐adapted influenza A/Ann Arbor/6/60 (H2N2) and A/Kawasaki/9/86 (H1N1) and A/Beijing/353/89 (H3N2). Intranasal with 0.4 mL in each naris. 2.Trivalent inactivated subvirion influenza virus vaccine (TVV) — A/Texas/36/91 (H1N1), A/Shandong/9/93 (H3N2), B/Panama/4?/90. Intramuscular, 15 μg of HA from each of 3 strains per 0.5 mL dose. Control: 1. Saline placebo intranasal 2. TVV, intramuscular, identical to vaccinated group |
|
| Outcomes | Early: all measured 7 to 10 days after immunisation. Clinical status; pulmonary function using basic spirometry, measuring FEV1, FVC and FEV1/FVC %. Adverse symptoms such as cough, nasal congestion, runny nose, etc. Serology; levels of anti‐HA immunoglobulins in nasal washings Late: spirometry was repeated for those who reported changes in obstruction to airflow or respiratory symptoms at 7 to 10 days. Serology; cellular immune testing of in vitro levels of interleukins 2 and 4. |
|
| Notes | To calculate standard deviations from continuous data, we assumed that only 1 exacerbation was experienced by each participant | |
| Risk of bias | ||
| Bias | Authors' judgement | Support for judgement |
| Random sequence generation (selection bias) | Unclear risk | Random allocation reported, however, no details regarding methods of randomisation reported |
| Allocation concealment (selection bias) | Unclear risk | Insufficient information to make determination |
| Blinding of participants and personnel (performance bias) All outcomes | Unclear risk | Placebo‐controlled. Same delivery method with participants and laboratory personnel blinded. Study nurse was unblinded |
| Blinding of outcome assessment (detection bias) All outcomes | Unclear risk | The nurse administering the immunisation was unblinded. Unclear who did the follow‐up checks on the days following vaccination |
| Incomplete outcome data (attrition bias) All outcomes | Low risk | All vaccinated participants were evaluated and reported in the study results |
| Selective reporting (reporting bias) | Unclear risk | Insufficient information to make determination |
| Other bias | Unclear risk | Insufficient information to make determination |
Gorse 2003.
| Methods | Duration: six + months Protocol: spirometry performed to check eligibility, then IM and intranasal vaccine given. Participants kept diary card for 7 days. Follow‐up visit 3‐4 weeks after vaccination, and antibody determination. Thereafter 2 weekly phone calls, and final follow‐up visit at 6 months. Participants reported if developed respiratory illness. Dropouts: 90 in intervention (8.1%), 110 in control (9.9%). 64 deaths | |
| Participants | Setting: Winter; USA; 1998 to1999; people with COPD meeting spirometric criteria for COPD from 20 VA Medical Centre sites Exclusion: allergic to vaccine components, received influenza vaccine less than six months previously, immunocompromised, cystic fibrosis, febrile illness 72 hours prior or exacerbation of COPD within 3 weeks prior, or history of Guillain–Barré syndrome Number: 2215; 1107 in intervention and 1108 in control group Age: 50 or over. Mean age 67.8 years, 98.2% male, 83.5% white, 95% had smoking history, 95% had comorbidity, mean FEV1 1.34 L, 42.6% predicted, FEV1/FVC 0.53 |
|
| Interventions | Trivalent inactivated influenza virus vaccine (TVV) ‐A/Beijing/262/95‐like (H1N1), A/Sydney/5/97‐like (H3N2), B/Beijing/184/93; intramuscular into deltoid; 0.5 mL dose. Same lot in all participants. On same day, participants also received either: Intervention: Trivalent, types A and B, live cold adapted influenza virus vaccine (CAIV‐T) corresponding to the strains in the TVV, 0.25 mL per nostril, or Control: intranasal saline as a large particle aerosol |
|
| Outcomes | Primary outcome:
Secondary outcomes:
Adverse reactions: early reactions monitored for 7 days using diary Additional outcome of chronic lung disease severity index (CLDSI) was reported in Gorse 2003a. |
|
| Notes | ||
| Risk of bias | ||
| Bias | Authors' judgement | Support for judgement |
| Random sequence generation (selection bias) | Low risk | Random assignment 1:1, stratified by site |
| Allocation concealment (selection bias) | Unclear risk | Insufficient information to make determination |
| Blinding of participants and personnel (performance bias) All outcomes | Unclear risk | Double‐blind, all participants received intramuscular vaccination; however, the method of intranasal delivery of intervention versus control was different |
| Blinding of outcome assessment (detection bias) All outcomes | Unclear risk | Insufficient information to make determination |
| Incomplete outcome data (attrition bias) All outcomes | Unclear risk | Insufficient information to make determination |
| Selective reporting (reporting bias) | Unclear risk | Insufficient information to make determination |
| Other bias | Unclear risk | Insufficient information to make determination |
Govaert 1994.
| Methods | Duration: 5 months Withdrawals: 47 incomplete questionnaires, none due to influenza‐related morbidity or mortality Follow‐up schedule: clinical assessments, questionnaire completed at 4, 10 and 23 weeks, serological tests at week 3 and 5 months | |
| Participants | Setting: Winter 1991‐92, 15 General Practices in Southern Netherlands Number: 1838; 927 vaccinated and 911 in the control Characteristics: Mean age 67 (SD5.6), 4 morbidity categories; heart, lung (9%), diabetes mellitus, and others, or healthy. 54% female Baseline characteristics: similar ages, sex ratios, risk status, previous vaccination rates. 13.5%heart, 11.3% lung, 2.3% diabetes mellitus in the vaccine group and 13.6% heart, 10.4% lung, 2.2% diabetes mellitus in the control. 54.7% female in the vaccine group compared to 50.7% in the control Comorbidities: cardiological, pulmonary, and other metabolic Diagnostic criteria: over 60 years of age, with conditions, if present, that were not severe enough to necessitate mandatory vaccination; not specifically COPD Influenza diagnosed serologically, by a physician or by International Classification of Health Problems in Primary Care 2nd Edition (ICHPPC‐2) defined criteria Exclusion criteria: 1. Less than 60 years of age 2. High risk groups 3. Those in old people's or nursing homes Other reasons for non‐participation included inability to consent and fear of injections |
|
| Interventions | Vaccination type:
Purified, split virion vaccine (A/Singapore/6/86 (H1N1), A/Beijing/353/89 (H3N2), B/Panama/45/90, B/Beijing/1/87) Control: physiological saline placebo |
|
| Outcomes | Early: none Late: mortality, exacerbation rates in the form of occurrence of influenza or influenza‐like illnesses, HAI antibody titres; adverse reactions assessed at week 4; local, systemic, subgroup analysis |
|
| Notes | A subsequent report, Govaert 1994a was a sub‐study of this trial reported the adverse reactions; | |
| Risk of bias | ||
| Bias | Authors' judgement | Support for judgement |
| Random sequence generation (selection bias) | Low risk | Stratified randomisation schedule used with 4 strata according to each morbidity category |
| Allocation concealment (selection bias) | Low risk | At the vaccination session, the participant revealed a previously allocated study number to the vaccination team, which enabled allocation of the participant to the next consecutive number in the appropriate stratum. |
| Blinding of participants and personnel (performance bias) All outcomes | Low risk | Placebo‐controlled using a 'visually' identical syringe |
| Blinding of outcome assessment (detection bias) All outcomes | Low risk | Researchers blinded to vaccination status analysed questionnaires completed by the participants |
| Incomplete outcome data (attrition bias) All outcomes | Low risk | Adequate reporting of participants lost to follow‐up. One death reported in the control group. Authors noted that participants with incomplete data were retained in the analyses where possible |
| Selective reporting (reporting bias) | Unclear risk | Insufficient information to make determination |
| Other bias | Unclear risk | Insufficient information to make determination |
Howells 1961.
| Methods | Duration: about 4 months Withdrawals: 1 (control group participant died during an acute exacerbation) Follow‐up schedule: initially at week 2, then every 4 weeks by both observers |
|
| Participants | Setting: Winter 1960, NW Wolverhampton, UK Number: 55 enrolled; 26 in vaccinated group, 29 in control Characteristics: 37 men (67%) of average age 52.78 years (SD 12.51); overall average peak expiratory flow (PEF) was 270.09 L/min (SD111.88). The overall maximum breathing capacity was 64.33 L/min (SD 30.59) Baseline characteristics: The average age of the vaccinated group was 54.08 years (SD 14) and the control was 51.62 years (SD 11.12). 58% of the vaccinated group was male and 76% of the control. The vaccinated participants had an average duration of symptoms of around 17 years, while the control had around 20 years. The average PEF for the vaccinated group was 266.35 L/min (SD 101.12) and 273.45 L/min (SD 120.29) for the control. This difference could be attributed to 2 people with asthma who had relatively higher peak flows. The average maximum breathing capacity for the vaccinated group was 62.81 L/min (SD 28.66) and 65.75 L/min (SD 32.75) for the control. Comparable antibody levels to influenza viruses in all participants Comorbidities: 7% of control were asthmatics Diagnostic criteria: chronic bronchitis; "a minimum of 3 years' history of cough with phlegm on most days for at least 3 months of the year...". Participants were assessed to enable placement into Grades 1, 2 or 3 with increasing severity. Exclusion criteria: people with Grade 4 bronchitis and TB |
|
| Interventions | Vaccination type: Flubron (A.A2 Asian‐Formosa 7000, B England 5000), intramuscular Control: physiological saline solution |
|
| Outcomes | Early: exacerbations in weeks 1 to 3 recorded by clinical examination and measurement of PEF. Bacteriological and complement fixation results for cause of exacerbations. Late: hospitalisation, mortality, as well as all early outcomes. |
|
| Notes | We made an assumption for the number of early and late exacerbations per participant for the placebo group. We knew the total number of exacerbations was 24 experienced by 20 participants out of 29. Thus, there would have been at least 8 early and 10 late exacerbations, according to the numbers of participants experiencing exacerbations in the placebo group. We added 2 exacerbations to each group to make up the total of 24. We felt justified in doing so because the study stated that similar numbers of early exacerbations were recorded in both groups, which was the case using our assumption. | |
| Risk of bias | ||
| Bias | Authors' judgement | Support for judgement |
| Random sequence generation (selection bias) | Unclear risk | Insufficient information to make determination |
| Allocation concealment (selection bias) | Low risk | A key was provided by the statistical advisor to the nursing staff administering injections. |
| Blinding of participants and personnel (performance bias) All outcomes | Low risk | Double‐blind; a nurse uninvolved in the conduct of the research study administered the vaccination |
| Blinding of outcome assessment (detection bias) All outcomes | Low risk | No details of outcome assessment blinding |
| Incomplete outcome data (attrition bias) All outcomes | Low risk | All participants described and accounted for in results. One death occurred in the control group |
| Selective reporting (reporting bias) | Unclear risk | Insufficient information to make determination |
| Other bias | Unclear risk | Insufficient information to make determination |
MRC 1980.
| Methods | Duration: unclear; more than 3 weeks Withdrawals: 16 participants from the Sheffield centre had no baseline recordings. 15 participants failed to complete all records (reasons not discussed) Follow‐up schedule: no details |
|
| Participants | Setting: no details Number: 86 to begin with, but 16 had no baseline data and 15 had incomplete records. Thus, only 55 included in final analysis, with 36 in the vaccinated group and 19 in the control Characteristics: age range of 28 to 78 years Baseline characteristics: none recorded Comorbidities: no details Diagnostic criteria: chronic bronchitis (MRC definition) and airways obstruction with an FEV1 > 1 L Exclusion criteria: cardiac disease symptoms and steroid treatment |
|
| Interventions | Vaccination type: live attenuated, RIT 4050 (H2N3) vaccine virus; having surface antigens of the A/Victoria/75 virus in a lyophilised preparation; intranasal; 0.5 mL volume Control: placebo preparation without virus |
|
| Outcomes | Early: 7 days post vaccination. Upper and lower respiratory symptoms, systemic symptoms Spirometry: MEFV curves used to determine V50, V75, EVC, PEFR, FEV1 Late: day 21; all self‐assessments, spirometry of early outcomes, and serology; HAI tests |
|
| Notes | Standard errors of serologically negative and positive participants were averaged to calculate a standard deviation for all vaccinees according to the formula: SD = SE * square root of N. | |
| Risk of bias | ||
| Bias | Authors' judgement | Support for judgement |
| Random sequence generation (selection bias) | Unclear risk | Insufficient information to make determination |
| Allocation concealment (selection bias) | Unclear risk | Insufficient information to make determination |
| Blinding of participants and personnel (performance bias) All outcomes | Unclear risk | Insufficient information to make determination |
| Blinding of outcome assessment (detection bias) All outcomes | Unclear risk | Insufficient information to make determination |
| Incomplete outcome data (attrition bias) All outcomes | High risk | Eleven participants were vaccinated but excluded from the analyses; these originated from one study site |
| Selective reporting (reporting bias) | Unclear risk | Insufficient information to make determination |
| Other bias | Unclear risk | Insufficient information to make determination |
Treanor 1992.
| Methods | Duration: 3 years Withdrawals: 8; 7 from intranasal group; deaths due to unrelated causes, discharges from institutions Follow‐up schedule: days 1 to 3 after each vaccination for adverse reactions and nasal sheddings; then daily staff nursing reports were used |
|
| Participants | Setting: 1987‐90, 3 large nursing homes in Rochester, NY, USA; St Ann's Home, St John's Home and Monroe Community Hospital Number: 523; 345 participant years in the intranasal group and 346 participant years in the control Characteristics: older adults; Mean age of 84.2 years. 32% had cardiac or pulmonary conditions; 75% female Baseline characteristics: Relatively well matched for disabilities, age, sex ratios. Mean age in the vaccine group was 84.1 years with 26% of participants randomised to this group suffering either a cardiac or pulmonary condition; 4% of the vaccine group had both a cardiac and pulmonary condition . Mean age in the placebo group was 83.8 years with 23% of participants in this group suffering either a cardiac or pulmonary condition; 2%of participants in this group had both a cardiac and pulmonary condition Comorbidities: only details of cardiovascular and pulmonary complications Diagnostic criteria: none; all residents at these institutions were invited Exclusion criteria:
|
|
| Interventions | Vaccination type:
Control:
|
|
| Outcomes | Early: days 1 to 3 post vaccination; adverse effects Late: years 1, 2, 3: serum antibody responses measured and occurrence of respiratory and flu‐like illnesses were measured to evaluate the efficacy of adding live intranasal vaccination to the inactivated type |
|
| Notes | Not specifically people with COPD | |
| Risk of bias | ||
| Bias | Authors' judgement | Support for judgement |
| Random sequence generation (selection bias) | Unclear risk | Insufficient details on randomisation sequence provided. Re‐randomisation occurred every year |
| Allocation concealment (selection bias) | Unclear risk | Insufficient information to make determination |
| Blinding of participants and personnel (performance bias) All outcomes | Unclear risk | Insufficient detail provided, although it is stated that this study was double‐blind |
| Blinding of outcome assessment (detection bias) All outcomes | Unclear risk | See above |
| Incomplete outcome data (attrition bias) All outcomes | Low risk | A low number of dropouts reported per year, evenly across groups. Independent analysis each study year |
| Selective reporting (reporting bias) | Unclear risk | Insufficient information to make determination |
| Other bias | Unclear risk | Insufficient information to make determination |
Treanor 1994.
| Methods | Duration: at least 4 weeks Withdrawals: no details Follow‐up schedule: early symptoms at days 3 to 4, serologic testing at 4 weeks post vaccination |
|
| Participants | Setting: outpatient clinics of Strong Memorial Hospital; Rochester, NY and a private practice, USA Number: 81; 34 in the live attenuated vaccination group, 30 in the inactivated vaccination group and 11 in the control Characteristics: older adults (> 65 years) and chronically ill, 65% female Baseline characteristics: distributions of chronic conditions, smokers and mean ages were roughly similar. 18% of the live vaccinated group had chronic lung disorders, and had a mean age of 68.9 years. Comorbidities: chronic cardiac, pulmonary, endocrine, hematologic conditions, 25% smokers Diagnostic criteria: ambulatory adults over 65 years, or with at least 1 high risk condition Exclusion criteria: no details |
|
| Interventions | Vaccination type:
1. Cold‐adapted, Live attenuated re‐assortant influenza B virus vaccine (B/Ann Arbor/1/86 or B/Yamagata/16/88), intranasally in 0.5 mL doses with intramuscular placebo
2. Parenteral, trivalent, inactivated influenza vaccination (B/Ann Arbor/86 and B/ Yamagata/88) intramuscularly, in 0.5 mL doses with intranasal placebo Control: placebo; intramuscular saline and intranasal veal infusion broth |
|
| Outcomes | Early: 3 to 4 days post vaccination; pulse oximetry, spirometry, virus cultures and HAI tests; symptoms for 7 days (upper and lower respiratory tract symptoms, systemic) Late: serology repeated at week 4, hospitalisations |
|
| Notes | Cold adapted, live attenuated influenza B vaccines are safe but not as immunogenic as inactivated ones in chronically ill or older people. There were no significant differences between the groups in outcomes of spirometry and adverse effects. Author provided individual participant data. | |
| Risk of bias | ||
| Bias | Authors' judgement | Support for judgement |
| Random sequence generation (selection bias) | Unclear risk | No further details other than 'randomly assigned' |
| Allocation concealment (selection bias) | Unclear risk | Insufficient information to make determination |
| Blinding of participants and personnel (performance bias) All outcomes | Unclear risk | This study was double‐blind, however, methods were not described in any more detail. |
| Blinding of outcome assessment (detection bias) All outcomes | Unclear risk | See above |
| Incomplete outcome data (attrition bias) All outcomes | Low risk | No missing data or withdrawals reported |
| Selective reporting (reporting bias) | Unclear risk | Insufficient information to make determination |
| Other bias | Unclear risk | Insufficient information to make determination |
Wongsurakiat 2004a.
| Methods | Duration: 1 year. Withdrawals: 3 dropouts (1 vaccine, 2 control). Deaths 8 (5 vaccine, 3 control) all died from causes not related to acute respiratory infection Follow‐up schedule: reviewed monthly. Bloods taken at week 0, week 4, and 6 and 12 months; participants reported acute respiratory infections, and had extra visit for full assessment, including the taking of acute and convalescent serum 4 to 6 weeks later. If respiratory infection presented for less than 6 days, swabs taken |
|
| Participants | Setting: 1997‐8. Thailand, university hospital, COPD outpatient clinic; non‐influenza epidemic years in Thailand Number: 132 consecutive outpatients. 7 excluded as couldn't attend, making 125 in total, 62 in vaccine group and 63 in control group Inclusion: clinical COPD (COPD not defined although managed according to Thai guidelines), FEV1 < 70% and < 15% increase after bronchodilator Exclusions: egg allergy, immunocompromised, immunosuppressive drugs (except corticosteroids), or if comorbidities expected to reduce survival to < 1 year Characteristics: mean age 68.3 years, 94% male, 96% smoking history, 37% FEV1 < 50%, 44% FEV1 > 70%, 33% with comorbidities |
|
| Interventions | Vaccination type: purified trivalent split‐virus vaccine A/Texas/36/91 (H1N1), ANanchang/933/95 (H3N2), B/Harbin/07/94. 0.5 mL on Day 1 and a second dose at 4 weeks; two‐dose schedule given as first time that influenza vaccine available in Thailand. Control was 0.5 mL of Vitamin B1 |
|
| Outcomes | Acute respiratory infections, antibody responses to vaccination and to acute respiratory infections (by HAI test), allowing classification of whether the infection was influenza‐related Clinical classification of ARI into common cold, acute exacerbation, influenza‐like illness, or pneumonia. Severity recorded; hospitalisation, ventilation, and stratified by COPD severity Adverse effects recorded carefully for 4 weeks after vaccination |
|
| Notes | ||
| Risk of bias | ||
| Bias | Authors' judgement | Support for judgement |
| Random sequence generation (selection bias) | Low risk | Particpants stratified based on disease severity and numbered consecutively. These numerical identifiers had been previously randomised to either intervention or placebo. |
| Allocation concealment (selection bias) | Low risk | A nurse not involved in participant care determined which numerical identifier was allocated to intervention or placebo. |
| Blinding of participants and personnel (performance bias) All outcomes | Low risk | Double‐blind, placebo controlled. Both vaccine and placebo were same volume and quantity, administered to all participants. |
| Blinding of outcome assessment (detection bias) All outcomes | Unclear risk | Insufficient information to make determination |
| Incomplete outcome data (attrition bias) All outcomes | Low risk | Study clearly outlines exclusions and dropouts; dropouts were very similar for both groups. |
| Selective reporting (reporting bias) | Unclear risk | Insufficient information to make determination |
| Other bias | Unclear risk | Insufficient information to make determination |
ARI: acute respiratory infection; CAIV‐T: live cold adapted influenza virus vaccine; CAV: live attenuated influenza A virus vaccine derived from cold‐adapted influenza; CCA: chicken cell agglutinating; CLDSI: chronic lung disease severity index; COPD: chronic obstructive pulmonary disease; FEV1: forced expiratory volume in one second; FVC: force vital capacity; HAI: hemagglutination inhibition; ICHPPC‐2: International Classification of Health Problems in Primary Care; ILI: influenza‐like illness; IM: intramuscular; LDI: laboratory‐documented influenza; MD: mean difference; MEFV: maximum expiratory flow ‐ volume curve; MRC: Medical Research Council; PEFR: peak expiratory flow rate; SD: standard deviation; TB: tuberculosis; TVV: trivalent inactivated influenza virus vaccine; USA: United States of America; UK: United Kingdom; VAS: visual analogue scale; V50: air flow rate at 50% vital capacity; V75: air flow rate at 75% vital capacity; WBC: white blood cells.
Characteristics of excluded studies [ordered by study ID]
| Study | Reason for exclusion |
|---|---|
| Ambrosch 1979 | Not placebo controlled and not COPD specific |
| Centanni 1997 | Add‐on benefit of bacterial immunostimulant is being assessed |
| Dorrell 1997 | Not RCT, people with obstructive airways disease are only a small subgroup |
| Gorse 1986 | Live and inactivated virus vaccines used without placebo as a control, not randomised |
| Gorse 1988 | Serological results only; no primary outcomes suitable for this review |
| Gorse 1991 | No randomisation of people with COPD. |
| Gorse 1996 | Serological outcomes only, no primary outcomes suitable for this review |
| Howells 1975 | No randomisation of older participants with lung disease |
| Keitel 1993 | Healthy adults susceptible to virus vaccine were used |
| Lama 1998 | Serological outcomes only; no primary outcomes suitable for this review, unclear if this is an RCT from the abstract. We were unable to retrieve the full paper. |
| Margolis 1990 | Randomised survey with a lung disease component but not placebo controlled |
| MRC 1959 | 3 inactivated vaccines used without placebo as a control |
| MRC 1984 | Not randomised for people with COPD. |
| Paul 1988 | Not RCT |
| Portari 1998 | Not RCT, serological outcomes only; no primary outcomes suitable for this review |
| Powers 1991 | Healthy older adults used |
| Prevost 1975 | Not RCT |
| Saah 1986 | Retrospective cohort study , not COPD |
| Treanor 1998 | Older and high risk participants but no details of COPD or any other lung disease |
| Winson 1977 | No randomisation of chronic bronchitis |
Differences between protocol and review
Update in 2018 included a change in format to reflect current Cochrane practice; including a revision of risk of bias assessment for all included studies and development of a 'Summary of findings' table; split outcomes into primary and secondary; searched clinical trials registries; added all required headings for methods and used either existing, revised, or standard text provided by Cochrane Airways.
Major update 2004‐5, following searches in 2003 and 2004, located two further trials (5 reports).
New outcomes have been included:
Acute infection subsequently documented as influenza‐related
Cost effectiveness
Number of people with exacerbations
Contributions of authors
Kopsaftis Z: conducted 2018 update: updated search terms, assessed search results, led write up.
Wood‐Baker R: protocol, literature search, reviewed papers for inclusion, format of data extraction sheet, analyses, and discussion.
Poole PJ: initial protocol, literature search, reviewed papers for inclusion, contributed to format of data extraction sheet, review write up, analyses, and discussion. Conducted 2006 update. Assessed results from 2007, 2009, and 2018 search updates and contributed to writing each version. Remains the senior and contact author.
Sources of support
Internal sources
The authors declare that no such funding was received for this systematic review, Other.
External sources
Health Research Council of New Zealand Summer Studentship, New Zealand.
NHS Executive Eastern Region, UK.
Declarations of interest
Kopsaftis Z: none known
Wood‐Baker R: none known
Poole PJ: none known
New search for studies and content updated (no change to conclusions)
References
References to studies included in this review
Cate 1977 {published data only}
- Cate TR, Kasel JA, Couch RB, Six HR, Knight V. Clinical trials of bivalent influenza/A/New Jersey/76‐A/Victoria/75 vaccines in the elderly. Journal of Infectious Diseases 1977;136(Suppl):S518‐25. [DOI] [PubMed] [Google Scholar]
Fell 1977 {published data only}
- Fell PJ, O'Donnell HF, Watson NP, Simmins RL, Hasell SK. Longer term effects of live influenza vaccine in patients with chronic pulmonary disease. Lancet 1977;1(8025):1282‐4. [DOI] [PubMed] [Google Scholar]
Gorse 1995 {published data only}
- Gorse GJ, Campbell MJ, Otto EE, Powers DC, Chambers GW, Newman FK. Increased anti‐influenza A virus cytotoxic T cell activity following vaccination of the chronically elderly with live attenuated or inactivated influenza virus vaccine. Journal of Infectious Diseases 1995;172:1‐10. [DOI] [PubMed] [Google Scholar]
Gorse 1997 {published data only}
- Gorse GJ, Otto EE, Daughaday CC, Newman FK, Eickhoff CS, Powers DC, et al. Influenza virus vaccination of patients with chronic lung disease. Chest 1997;112(5):1221‐33. [DOI] [PubMed] [Google Scholar]
Gorse 2003 {published data only}
- Gorse GJ, O'Connor TZ, Young SL, Habib MP, Wittes J, Neuzil KM, et al. Impact of a winter respiratory virus season on patients with COPD and association with influenza vaccination. Chest 2006;130:1109‐16. [DOI] [PubMed] [Google Scholar]
- Gorse GJ, O'Connor TZ, Young SL, Mendelman PM, Bradley SF, Nichol KL, et al. Efficacy trial of live, cold‐adapted and inactivated influenza virus vaccines in older adults with chronic obstructive pulmonary disease : a VA cooperative study. Vaccine 2003;21:2133‐44. [DOI] [PubMed] [Google Scholar]
- Neuzil KM, O'Connor TZ, Gorse GJ, Nichol KL. Recognizing influenza in older patients with chronic obstructive pulmonary disease who have received influenza vaccine. Clinical Infectious Diseases 2003;36(2):169‐74. [DOI] [PubMed] [Google Scholar]
Govaert 1994 {published data only}
- Govaert ME, Dinant GJ, Aretz K, Masurel N, Sprenger MJW, Knottnerus JA. Adverse reactions to influenza vaccine in elderly people:randomised double blind placebo controlled trial. BMJ 1993;307:988‐90. [DOI] [PMC free article] [PubMed] [Google Scholar]
- Govaert ME, Thijs CT, Masurel N, Sprenger JW, Dinant GJ, Knottnerus JA. The efficacy of Inflenza vaccination in elderly individuals‐a randomised double‐blind placebo controlled trial. JAMA 1994;272(21):1661‐5. [PubMed] [Google Scholar]
Howells 1961 {published data only}
- Howells CHL, Tyler LE. Prophylactic use of influenza vaccine in patients with chronic bronchitis. A pilot trial. Lancet 1961;2:1428‐32. [DOI] [PubMed] [Google Scholar]
MRC 1980 {published data only}
- [no authors listed]. A study of live influenza virus vaccine in patients with chronic bronchitis. Report to Medical Research Council's committee on influenza and other respiratory virus vaccines. Advisory Group on Pulmonary Function Tests in Relation to Live Influenza Virus Vaccines. British Journal of Diseases of the Chest 1980;74(2):121‐7. [PubMed] [Google Scholar]
Treanor 1992 {published data only}
- Treanor JJ, Mattison HR, Dumyati G, Yinnon A, Erb S, O'Brien D, et al. Protective efficacy of combined live intranasal and inactivated influenza A virus vaccines in the elderly. Annals of Internal Medicine 1992;117:625‐33. [DOI] [PubMed] [Google Scholar]
Treanor 1994 {published data only}
- Treanor J, Dumyati G, O'Brien D, Riley M, Riley G, Erb S, et al. Evaluation of cold‐adapted, reassortant influenza B virus vaccines in elderly and chronically ill adults. Journal of Infectious Diseases 1994;169:402‐7. [DOI] [PubMed] [Google Scholar]
Wongsurakiat 2004a {published and unpublished data}
- Wongsurakiat P, Lertakyamanee J, Maranetra KN, Jongriratanakul S, Sangkaew S. Economic evaluation of influenza vaccination in Thai chronic obstructive pulmonary disease patients. Journal of the Medical Association of Thailand 2003;86(6):497‐508. [PubMed] [Google Scholar]
- Wongsurakiat P, Maranetra KN, Gulprasutdilog P, Aksornint M, Srilum W, Ruengjam C, et al. Adverse effects associated with influenza vaccination in patients with COPD:a randomized controlled study. Respirology 2004;9:550‐6. [DOI] [PubMed] [Google Scholar]
- Wongsurakiat P, Maranetra KN, Wasi C, Kositanont U, Dejsomritrutai W, Charoenratanakul S. Acute respiratory illness in patients with COPD and the effectiveness of influenza vaccination: a randomized controlled study. Chest 2004;125:2011‐20. [DOI] [PubMed] [Google Scholar]
References to studies excluded from this review
Ambrosch 1979 {published data only}
- Ambrosch F, Konigstein RP, Olbrich E, Potschka W, Wiedermann G. Influenza immunisation, clinical results and serological tests [Klinische und serologische Untersuchungen zur Wirkung der Influenzaimpfung]. Aktuelle Gerontologie 1979;9:399‐404. [PubMed] [Google Scholar]
Centanni 1997 {published data only}
- Centanni S, Pregliasco F, Bonfatti C, Mensi C, Tarsia P, Guarnieri R, et al. Clinical efficacy of a vaccine‐immunostimulant combination in the prevention of influenza in patients with chronic obstructive pulmonary disease. Journal of Chemotherapy 1997;9(4):273‐8. [DOI] [PubMed] [Google Scholar]
Dorrell 1997 {published data only}
- Dorrell L, Hassan I, Marshall S, Chakraverty P, Ong E. Clinical and serological responses to an inactivated influenza vaccine in adults with HIV infection, diabetes, obstructive airways disease, elderly adults, and healthy volunteers. International Journal of STD and AIDS 1997;8:776‐9. [DOI] [PubMed] [Google Scholar]
Gorse 1986 {published data only}
- Gorse GJ, Belse RB, Munn NJ. Safety of serum and antibody response to cold‐recombinant influenza A and inactivated trivalent influenza virus vaccines in older adults with chronic diseases. Journal of Clinical Microbiology 1986;24(3):336‐42. [DOI] [PMC free article] [PubMed] [Google Scholar]
Gorse 1988 {published data only}
- Gorse GJ, Belshe RB, Munn NJ. Local and systemic antibody response in high‐risk adults given live‐attenuated and inactivated A virus vaccines. Journal of Clinical Microbiology 1988;26(5):911‐8. [DOI] [PMC free article] [PubMed] [Google Scholar]
Gorse 1991 {published data only}
- Gorse GJ, Belshe RB, Munn NJ. Superiority of live attenuated compared with inactivated influenza A virus vaccines in older, chronically ill adults. Chest 1991;100(4):977‐84. [DOI] [PubMed] [Google Scholar]
Gorse 1996 {published data only}
- Gorse GJ, Otto EE, Powers DC, Chambers GW, Eickhoff CS, Newman FK. Induction of mucosal antibodies by live attenuated and inactivated influenza virus vaccines in the chronically ill elderly. Journal of Infectious Diseases 1996;173:285‐90. [DOI] [PubMed] [Google Scholar]
Howells 1975 {published data only}
- Howells CHL, Vesselinova‐Jenkins CK, Evans AD, James J. Influenza vaccination and mortality from bronchopneumonia in the elderly. Lancet 1975;1(7903):381‐3. [DOI] [PubMed] [Google Scholar]
Keitel 1993 {published data only}
- Keitel WA, Couch RB, Quarles JM, Cate TR, Baxter B, Maassab HF. Trivalent attenuated cold‐adapted influenza virus vaccine: reduced viral shedding and serum antibody responses in susceptible adults. Journal of Infectious Diseases 1993;167:305‐11. [DOI] [PubMed] [Google Scholar]
Lama 1998 {published data only}
- Lama A, Tatliei G, Aydin Tosun G, Yildirim N. Preventive effect of influenza vaccine on chronic obstructive pulmonary disease and bronchial asthma. Proceedings of the 1st World Congress on Vaccines and Immunization; 1998 April 26‐30; Istanbul. 1998.
Margolis 1990 {published data only}
- Margolis KL, Poland GA, Nichol KL, MacPherson DS, Meyer JD, Kron JE, et al. Frequency of adverse reactions after influenza vaccination. American Journal of Medicine 1990;88:27‐30. [DOI] [PubMed] [Google Scholar]
MRC 1959 {published data only}
- Medical Research Council (MRC). Field trial of influenza virus vaccine in patients with chronic bronchitis during the winter 1957‐8. BMJ 1959;2:905‐8. [PMC free article] [PubMed] [Google Scholar]
MRC 1984 {published data only}
- Medical Research Council (MRC). Trials of live attenuated influenza virus vaccine in patients with chronic airways disease. British Journal of Diseases of the Chest 1984;78:236‐47. [PubMed] [Google Scholar]
Paul 1988 {published data only}
- Paul WS, Cowan J, Jackson GG. Acute respiratory illness among immunised and non‐immunised patients with high‐risk factors during a split season of influenza A and B. Journal of Infectious Diseases 1988;157(4):633‐9. [DOI] [PubMed] [Google Scholar]
Portari 1998 {published data only}
- Mancini DA, Mendonça RM, Mendonça RZ, do Prado JA, Andrade Cde M. Immune response to vaccine against influenza in smokers, non‐smokers and in individuals holding respiratory complications. Bollettino Chimico Farmaceutico 1998;137(1):21‐5. [PubMed] [Google Scholar]
Powers 1991 {published data only}
- Powers DC, Fries LF, Murphy BR, Thumar B, Clements ML. In elderly persons live attenuated influenza A virus vaccines do not offer an advantage over inactivated virus vaccine in inducing serum or secretory antibodies or local immunologic memory. Journal of Clinical Microbiology 1991;29(3):498‐505. [DOI] [PMC free article] [PubMed] [Google Scholar]
Prevost 1975 {published data only}
- Prevost JM, Vereerstraeten‐Schmerber J, Lamy F, Koster JP. Live attenuated influenza virus vaccines in patients with chronic broncho‐pulmonary diseases. Scandinavian Journal of Respiratory Diseases 1975;56:58‐69. [PubMed] [Google Scholar]
Saah 1986 {published data only}
- Saah AJ, Neufeld R, Rodstein M, Montagne JR, Blackwelder WC, Gross P. Influenza vaccine and pneumonia mortality in a nursing home population. Archives of Internal Medicine 1986;146(12):2353‐7. [PubMed] [Google Scholar]
Treanor 1998 {published data only}
- Treanor JJ, Betts RF. Evaluation of live, cold‐adapted influenza A and B virus vaccines in elderly and high‐risk subjects. Vaccine 1998;16(18):1756‐60. [DOI] [PubMed] [Google Scholar]
Winson 1977 {published data only}
- Winson IG, Smit JM, Potter CW, Howard P. Studies with live attenuated influenza virus in chronic bronchitis. Thorax 1977;32:726‐8. [DOI] [PMC free article] [PubMed] [Google Scholar]
Additional references
ACIP 1999
- Advisory Committee on Immunization Practises (ACIP). Prevention and control of influenza: recommendations of the Advisory Committee on Immunization Practices (ACIP). Morbidity and Mortality Weekly Report 1999;48(RR‐4):1‐28. [PubMed] [Google Scholar]
ATS 1995
- ATS 1995. Standards for the diagnosis and care of patients with chronic obstructive pulmonary disease. American Journal of Respiratory and Critical Care Medicine 1995;152((5 Pt 2)):Suppl: S77‐120. [PubMed] [Google Scholar]
ATS 2004
- American Thoracic Society (ATS)/European Respiratory Society Task Force. Standards for the diagnosis and management of patients with COPD version 1.2. www.thoracic.org/copd‐guidelines/ (accessed 5 May 2016).
BRFSS 1998
- Behavioural Risk Factor Surveillance System (BRFSS). Influenza and pneumococcal vaccination levels among adults aged > 65 years — United States 1997. Morbidity and Mortality Weekly Report 1998;47(38):797‐802. [PubMed] [Google Scholar]
BTS 1997
- British Thoracic Society. COPD guidelines group of the standards of care committee of the BTS. BTS Guidelines for the management of chronic obstructive pulmonary disease. Thorax 1997;52:S7‐15. [PMC free article] [PubMed] [Google Scholar]
Collet 1997
- Collet JP, Shapiro S, Ernst P, Renzi P, Ducruet T, Robinson A, et al. Effects of immunostimulating agent on acute exacerbations and hospitalizations in patients with chronic obstructive pulmonary disease. American Journal of Respiratory and Critical Care Medicine 1997;156:1719‐24. [DOI] [PubMed] [Google Scholar]
Galasso 1977
- Galasso GJ, Tyeryar FJ, Montagne JR. Overview of clinical trials of influenza vaccines 1976. Journal of Infectious Diseases 1977;136(Suppl):S425‐8. [DOI] [PubMed] [Google Scholar]
GOLD 2018
- Global Initiative for Chronic Obstructive Lung Disease (GOLD). Global strategy for the diagnosis, management and prevention of COPD. goldcopd.org/wp‐content/uploads/2017/11/GOLD‐2018‐v6.0‐FINAL‐revised‐20‐Nov_WMS.pdf (accessed prior to 9 March 2018).
Gorse 2003a
- Gorse GJ, O'Connor TZ, Young SL, Habib MP, Wittes J, Neuzil KM, Nichol KL. Impact of a winter respiratory virus season on patients with COPD and association with influenza vaccination. Chest 2006;130:1109‐16. [DOI] [PubMed] [Google Scholar]
Govaert 1994a
- Govaert ME, Dinant GJ, Aretz K, Masurel N, Sprenger MJW, Knottnerus JA. Adverse reactions to influenza vaccine in elderly people:randomised double blind placebo controlled trial. BMJ 1993;307:988‐90. [DOI] [PMC free article] [PubMed] [Google Scholar]
GRADEpro GDT 2015 [Computer program]
- McMaster University (developed by Evidence Prime). GRADEpro GDT. Version accessed prior to 9 March 2018. Hamilton (ON): McMaster University (developed by Evidence Prime), 2015.
Gross 1995
- Gross PA, Hermogenes AW, Sacks HS, Lau J, Levandowski RA. The efficacy of influenza vaccine in elderly persons. Annals of Internal Medicine 1995;123:518‐27. [DOI] [PubMed] [Google Scholar]
Higgins 2011
- Higgins JPT, Green S, editor(s). Cochrane Handbook for Systematic Reviews of Interventions Version 5.1.0 (updated March 2011). The Cochrane Collaboration, 2011. Available from handbook.cochrane.org.
Monto 1987
- Monto AS. Influenza: quantifying morbidity and mortality. American Journal of Medicine 1987;82(Suppl 6A):20‐5. [DOI] [PubMed] [Google Scholar]
Neuzil 2003
- Neuzil KM, O'Connor TZ, Gorse GJ, Nichol KL. Recognizing influenza in older patients with chronic obstructive pulmonary disease who have received influenza vaccine. Clinical Infectious Diseases 2003;36(2):169‐74. [DOI] [PubMed] [Google Scholar]
NICE 2010
- National Institute for Health and Care Excellence (NICE). Chronic obstructive pulmonary disease in over 16s: diagnosis and management. www.nice.org.uk/guidance/cg101 (accessed 5 May 2016). [PubMed]
Nichol 1994
- Nichol KL, Margolis KL, Wuorenma J, Sternberg T. The efficacy and cost effectiveness of vaccination against influenza among elderly persons living in the community. New England Journal of Medicine 1994;331:778‐84. [DOI] [PubMed] [Google Scholar]
Nichol 1995
- Nichol KL, Lind A, Margolis KL, Murdoch M, McFadden R, Hauge M, et al. The effectiveness of vaccination against influenza in healthy working adults. New England Journal of Medicine 1995;333:889‐93. [DOI] [PubMed] [Google Scholar]
Nichol 1998
- Nichol KL, Wuorenma J, Stenberg T. Benefits of influenza vaccination for low‐, intermediate‐, and high‐risk senior citizens. Archives of Internal Medicine 1998;158:1769‐76. [DOI] [PubMed] [Google Scholar]
Nichol 1999
- Nichol KL, Baken L, Nelson A. Relation between influenza vaccination and outpatient visits, hospitalization, and mortality in elderly persons with chronic lung disease. Annals of Internal Medicine 1999;130:397‐403. [DOI] [PubMed] [Google Scholar]
Patriarca 1994
- Patriarcha PA. A randomised controlled trial of influenza vaccine in the elderly. JAMA 1994;272(21):1700‐1. [PubMed] [Google Scholar]
RevMan 2014 [Computer program]
- Nordic Cochrane Centre, The Cochrane Collaboration. Review Manager 5 (RevMan 5). Version 5.3. Copenhagen: Nordic Cochrane Centre, The Cochrane Collaboration, 2014.
Rothbart 1995
- Rothbart PH, Kempen BM, Sprenger MJW. Sense and nonsense of influenza vaccination in asthma and chronic obstructive pulmonary disease. American Journal of Respiratory and Critical Care Medicine 1995;151:1682‐6. [DOI] [PubMed] [Google Scholar]
Sethi 2002
- Sethi S, Evans N, Grant BJ, Murphy TF. New strains of bacteria and exacerbations of chronic obstructive pulmonary disease. New England Journal of Medicine 2002;347(7):465‐71. [DOI] [PubMed] [Google Scholar]
Siafakas 1995
- Siafakas NM, Vermeire P, Pride NB, Paoletti P, Gibson J, Howard P, et al. Optimal assessment and management of chronic obstructive pulmonary disease (COPD). European Respiratory Journal 1995;8:1398‐420. [DOI] [PubMed] [Google Scholar]
Wongsurakiat 2003
- Wongsurakiat P, Lertakyamanee J, Maranetra KN, Jongriratanakul S, Sangkaew S. Economic evaluation of influenza vaccination in Thai chronic obstructive pulmonary disease patients. Journal of the Medical Association of Thailand 2003;86(6):497‐508. [PubMed] [Google Scholar]
Wongsurakiat 2004b
- Wongsurakiat P, Maranetra KN, Gulprasutdilog P, Aksornint M, Srilum W, Ruengjam C, et al. Adverse effects associated with influenza vaccination in patients with COPD:a randomized controlled study. Respirology 2004;9:550‐6. [DOI] [PubMed] [Google Scholar]
Yang 2017
- Yang IA, Dabscheck EJ, George J, Jenkins SC, McDonald CF, McDonald V, et al. The COPD‐X plan: Australian and New Zealand guidelines for the management of chronic obstructive pulmonary disease. copdx.org.au/copd‐x‐plan/the‐copd‐x‐plan‐pdf/ 2017; Vol. (accessed prior to 9 March 2018).
References to other published versions of this review
Poole 2000
- Poole PJ, Chacko E, Wood‐Baker RWB, Cates CJ. Influenza vaccine for patients with chronic obstructive pulmonary disease. Cochrane Database of Systematic Reviews 2000, Issue 3. [DOI: 10.1002/14651858.CD002733] [DOI] [PubMed] [Google Scholar]
Poole 2006
- Poole P, Chacko EE, Wood‐Baker R, Cates CJ. Influenza vaccine for patients with chronic obstructive pulmonary disease. Cochrane Database of Systematic Reviews 2006, Issue 1. [DOI: 10.1002/14651858.CD002733.pub2] [DOI] [PubMed] [Google Scholar]