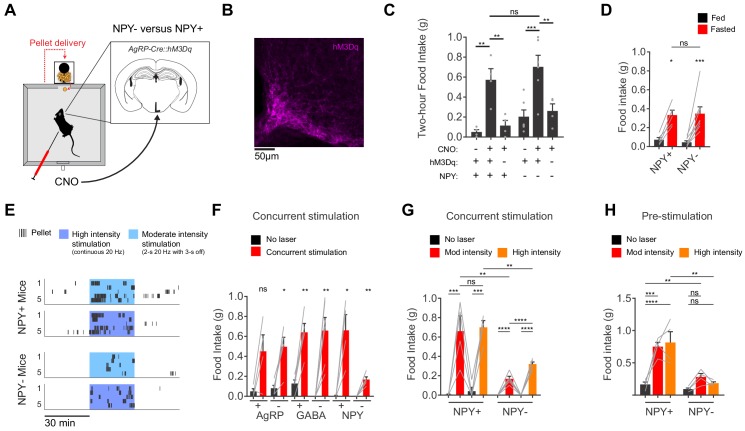
Figure 4. AgRP neurons show variable responses to concurrent stimulation in the absence of NPY.
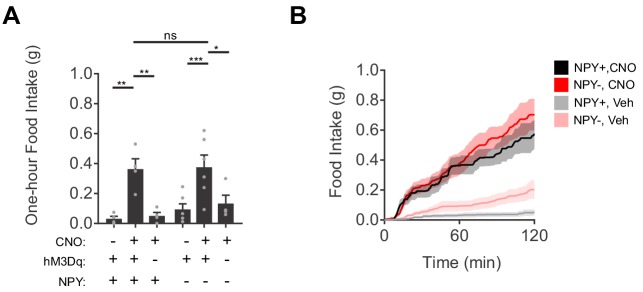
(a) Schematic for measurement of food intake during chemogenetic stimulation of AgRP neurons. (b) Expression of hM3Dq in AgRP neurons. Sample was stained for the HA tag on hM3Dq (magenta). (c) Food intake (2 hr) for NPY+ (hM3Dq+ N = 4; hM3Dq- N = 4) and NPY- (hM3Dq+ N = 6; hM3Dq- N = 4) mice following chemogenetic stimulation (CNO, 0.3 mg/kg) or control treatment. (d) Food intake (1 hr) for NPY+ (N = 5) and NPY- (N = 8) mice after overnight fasting. (e) Raster plot showing temporal pattern of pellet (20 mg) consumption by NPY- and NPY +mice in response to concurrent stimulation at high intensity (20 Hz, continuous) or moderate intensity (20 Hz, interleaved with 2 s ON/3 s OFF). (f) Food intake (30 min) for AgRP+ (N = 4) and AgRP- (N = 5), GABA+ (N = 5) and GABA- (N = 6), and NPY+ (N = 4) and NPY- (N = 5) mice in response to no stimulation (black) and concurrent stimulation (red; moderate-intensity). (g) Food intake (30 min) for NPY+ (N = 4) and NPY- (N = 5) mice in response to no stimulation (black), moderate intensity concurrent stimulation (red) and high intensity concurrent stimulation (orange). (h) Food intake (60 min) for NPY+ (N = 4) and NPY- (N = 4) mice in response to no stimulation (black), moderate intensity pre-stimulation (red) and high intensity pre-stimulation (orange). Error bars in c-e and g-j represent mean ± SEM. Holm-Sidak multiple comparisons test was used to report adjusted P-values in c-d and f-h. *p<0.05, **p<0.01, ***p<0.001, ****p<0.0001 or ns (not significant). Black lines denote the pairs that are being compared. In f, adjacent control (black) and experimental (red) groups subject to the same pre-stimulation protocol are compared.


