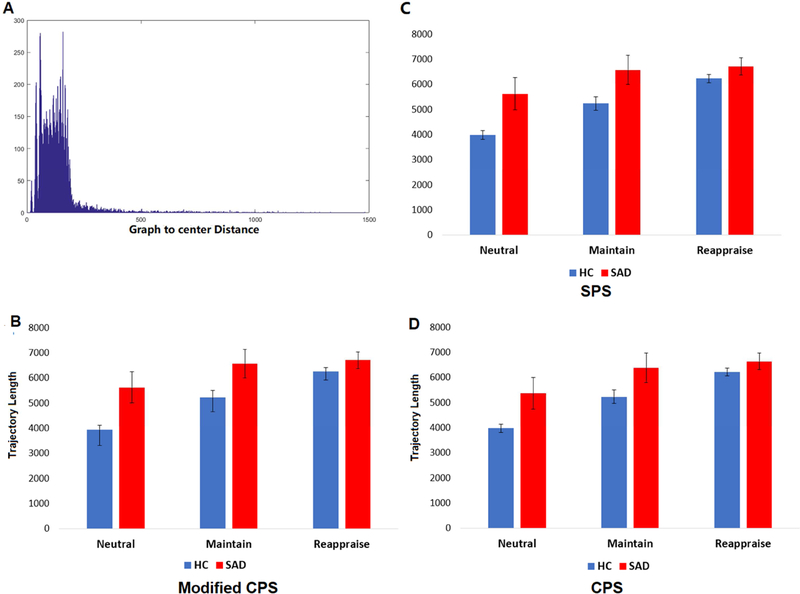
Fig. 6: Selecting representative prototype graph set.

Histogram of graph-to-center geodesic distance (A) and the trajectory length as computed using prototype sets given by modified CPS (B). Results obtained using SPS (C) and CPS (D) showed similar findings as Modified CPS, as well as the original 15600-connectome prototype set (i.e., each connectome is used as a prototype). There were significant group effects of task and group, no interaction effect on phase-space trajectory
