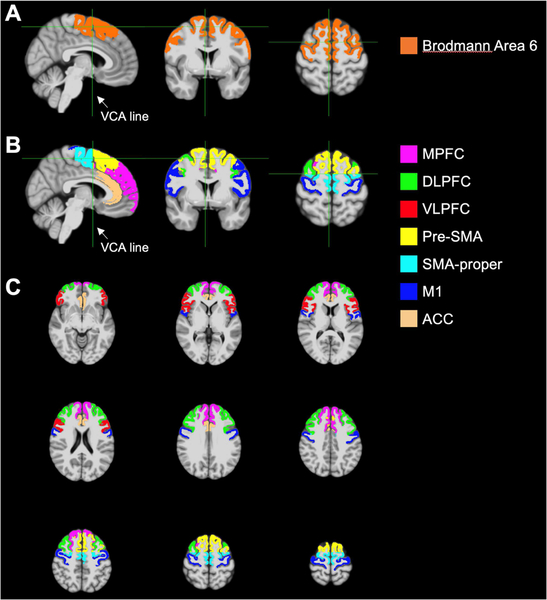
Fig. 1.
Illustration of the location of ROIs on a T1-weighted template. A) Broadman area 6 was obtained using the Brodmann areas atlas, and the VCA line was used to separate the pre-SMA anteriorly from the SMA-p. B) Sagittal, coronal and axial representations showing all ROIs. C) Axial slices at different levels.

