Abstract
Objective
The aim of this study was to predict tumor progression in patients with hepatocellular carcinoma (HCC) treated with radiofrequency ablation (RFA) using histogram analysis of apparent diffusion coefficients (ADC).
Methods
Breath-hold diffusion weighted imaging (DWI) was performed in 64 patients (33 progressive and 31 stable) with biopsy-proven HCC prior to RFA. All patients had pre-treatment magnetic resonance imaging (MRI) and follow-up computed tomography (CT) or MRI. The ADC values (ADC10, ADC30, ADCmedian and ADCmax) were obtained from the histogram’s 10th, 30th, 50th and 100th percentiles. The ratios of ADC10, ADC30, ADCmedian and ADCmax to the mean non-lesion area-ADC (RADC10, RADC30, RADCmedian, and RADCmax) were calculated. The two patient groups were compared. Key predictive factors for survival were determined using the univariate and multivariate analysis of the Cox model. The Kaplan-Meier survival analysis was performed, and pairs of survival curves based on the key factors were compared using the log-rank test.
Results
The ADC30, ADCmedian, ADCmax, RADC30, RADCmedian, and RADCmax were significantly larger in the progressive group than in the stable group (P<0.05). The median progression-free survival (PFS) was 22.9 months for all patients. The mean PFS for the stable and progressive groups were 47.7±1.3 and 9.8±1.3 months, respectively. Univariate analysis indicated that RADC10, RADC30, and RADCmedian were significantly correlated with the PFS [hazard ratio (HR)=31.02, 43.84, and 44.29, respectively, P<0.05 for all]. Multivariate analysis showed that RADCmedian was the only independent predictor of tumor progression (P=0.04). And the cutoff value of RADCmedian was 0.71.
Conclusions
Pre-RFA ADC histogram analysis might serve as a useful biomarker for predicting tumor progression and survival in patients with HCC treated with RFA.
Keywords: Diffusion-weighted imaging, apparent diffusion coefficient, histogram analysis, hepatocellular carcinoma, radiofrequency ablation, survival time
Introduction
Hepatocellular carcinoma (HCC) is the fifth most common cancer in the world (1), and the second leading cause of cancer-related deaths in China (2). Currently, hepatic resection (HR) and radiofrequency ablation (RFA) are the accepted first-line treatment options for patients with early HCC according to the guidelines from European Association for the Study of the Liver and American Association for the Study of Liver Diseases (3). However, a majority of HCC patients are not candidates for surgery because of poor liver function or the presence of advanced disease. Recently, RFA has evolved as one of the most important therapeutic options for HCC (3,4). It is a minimally invasive, safe and effective technique and relatively easy to perform. However, a major shortcoming of RFA is the higher rate of local tumor recurrence compared to HR (5,6). Many previous studies have focused on the post-treatment responses of RFA in HCC (6,7). Development of an image-marker to noninvasively predict post-treatment response would significantly impact treatment decisions, and support personalized treatment approaches. Therefore, predicting the efficacy of RFA in HCC patients prior to the RFA treatment is important.
Diffusion weighted imaging (DWI) quantitatively evaluates the response to cancer therapy from changes in apparent diffusion coefficients (ADC). These changes occur early, and are apparent before any changes in tumor morphology (1,8). DWI was employed in Liver Reporting & Data System (LI-RADS TM) to demonstrate HCC diagnosis, and T2 and triple phase enhanced images (9). Furthermore, ADC histogram analysis could quantify the distribution of signal intensity of voxels within a tumor by using routinely acquired clinical DWI data, which reflect the tumor heterogeneity (10-12). Many studies have reported that heterogeneity was highly correlated with treatment prediction, and in mathematical methods used in the heterogeneity evaluation, histogram analysis was widely used, and percentile values were useful (13,14).
Previous studies have demonstrated that ADC histogram analysis was effective for diagnosis, evaluation of biologic aggressiveness, and prediction of therapy response in glioblastoma, testicular germ cell tumors and colorectal hepatic metastases (10,11,14). However, little is known regarding its role in the prediction of therapeutic outcomes for RFA in HCC. The purpose of our study was to predict therapeutic effects of RFA treatment on HCC patients using ADC histogram parameters obtained before RFA treatment, and determine key parameters that can best predict the efficacy of RFA treatment.
Materials and methods
Patients
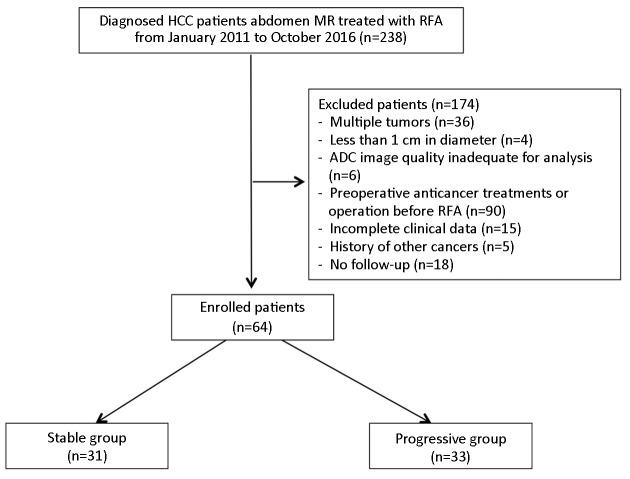
The study group included HCC patients treated with RFA at National Cancer Center/Cancer Hospital, Chinese Academy of Medical Sciences between January 2011 and October 2016. Inclusion criteria were as follows: 1) recent diagnosis of HCC with a single lesion on liver confirmed by biopsy; 2) treatment with RFA only; 3) magnetic resonance imaging (MRI) examination including DWI within 1 week prior to the treatment; 4) regular follow-up by MRI or CT; 5) Child-Pugh grade A or B; 6) no evidence of portal vein thrombus on MRI; and 7) no radiological evidence of lymph nodes or hematogenous metastasis. Exclusion criteria were lesions less than 1 cm, or degraded DWI images that prevent calculation of ADC (Figure 1 ). The study was approved by the Institutional Review Board of National Cancer Center/Cancer Hospital, Chinese Academy of Medical Sciences. The requirement for signed informed consent was waived for all patients as all data were collected for routine clinical management, and reviewed retrospectively.
1.
Flowchart of enrolled patients in our study. HCC, hepatocellular carcinoma; RFA, radiofrequency ablation; ADC, apparent diffusion coefficient.
Patients characteristics and clinical data
Clinical and pathological data including gender, age at the time of diagnosis, and tumor location (left, right, or caudate lobe) were collected for analysis. Venous blood samples were collected for plasma alpha-fetoprotein (AFP) and transferrin (TFN) measurement one week before the RFA treatment. Based on normal ranges and diagnostic values for HCC used at National Cancer Center/Cancer Hospital, Chinese Academy of Medical Sciences, two levels of AFP values were defined as negative ≤7 ng/mL and positive >7 ng/mL. And the category of TFN was classified as positive >190 ng/mL and negative ≤190 ng/mL.
Patient groups and follow-up
All patients were regularly followed-up using MRI or CT once in every 2−3 months until the progression of tumor or death or until the last follow-up time (October 15, 2016). The patients were grouped into a progressive group and a stable group according to Response Evaluation Criteria in Solid Tumors (RECIST 1.1). The stable group included patients with complete response (CR), with disappearance of all target lesions and partial response (PR), with at least a 30% decrease in the sum of the longest diameter of the target lesions, with the baseline sum of the longest diameter as a reference. The progressive group included patients with stable disease (SD) with no sufficiently shrunken lesions to qualify for the PR or no sufficiently increased lesions to qualify for the progressive disease, and with progressive disease (PD), with at least a 20% increase in the sum of the longest diameter of the target lesions, taking the smallest sum of the baseline longest diameter as a reference.
MRI
MRI was performed using Signa Excite 3.0 T HDxt MR scanner (GE Healthcare, Milwaukee, USA) with an eight-element phased-array body coil. All patients entered the machine in the supine, feet first position. The MR sequences included: 1) breath-hold fat-saturated, fast recovery, fast spin-echo (FRFSE-FS) T1-weighted imaging in the axial plane [TR/TE: 250/2.9 ms, field of view (FOV): 34−38 cm, slice thickness/space: 5.0/0.5 mm, matrix size: 288×192, NEX: 1]; 2) FRFSE-FS T2-weighted imaging in the axial plane (TR/TE: 7,000/100 ms, FOV: 34−38 cm, slice thickness/space: 5.0/0.5 mm, matrix size: 288×224, NEX: 2); and 3) breath-hold DWI with an axial single-shot spin echo, echo-planar imaging (EPI) sequence with DW gradients (b value 0 and 800 s/mm2) applied in three orthogonal directions (TR/TE: 2,500/65 ms, slice thickness/space: 6.0/2.0 mm, FOV: 34−38 cm, matrix size: 128×128, NEX: 2, and scan time 20−24 s). Positioning parameters were duplicated for T2-weighted image parameters to ensure image consistency.
RFA treatment
All patients were treated using local anesthesia in combination with intra-venous sedation. A B-type ultrasound-guided percutaneous RFA was performed using an ALOKA α7 B-type ultrasound system with a 9133 probe (2−6 MHz). We used the RITA Model 1500X radiofrequency (RF) generator (USA) in this study. All RFA procedures were performed by the same physician.
ADC histogram analysis
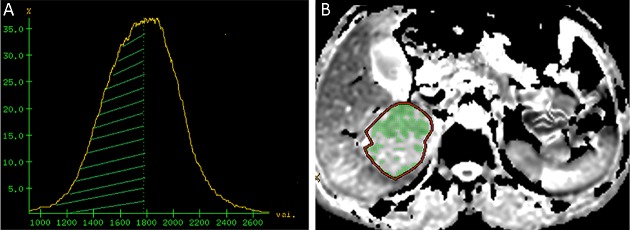
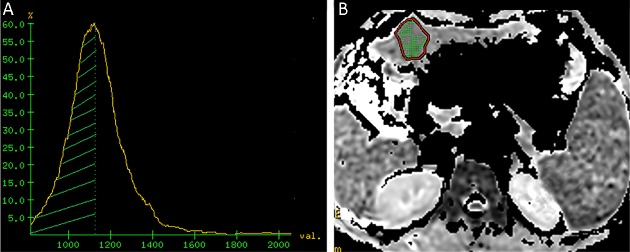
The DWI images were analyzed and processed by an experienced radiologist with more than 5 years of experience in abdominal MRI diagnosis. The T1WI/FS and T2WI/FS sequences were used to determine the lesion location, its maximum sectional area and maximal tumor diameter (MTD). The regions of interest (ROI) were drawn by manually delineating the tumor slice by showing the maximum cross sectional image. A fixed-size ROI (250 mm2) was drawn on the non-lesion area in a relatively normal liver area at least 3 cm away from the lesion, avoiding the intrahepatic bile duct and blood vessels. The DWI images were transferred to an AW4.4 workstation (GE healthcare). ADC maps were created by fitting of a mono-exponential function in the “Functool” work package. Histograms of the ADC distribution maps were generated by the “X-section” function of commercial Volume View software. The ADC histogram was quantified by generating percentile values from the cumulative histogram for each patient, averaging from the lowest measured ADC value to the 10th, 30th, 50th, and 100th percentile for each patient separately (ADC10, ADC30, ADCmedian and ADCmax) (Figure 2 ,3 ). The ratios of ADC10, ADC30, ADCmedian and ADCmax to the mean ADC of the non-lesion area were calculated (RADC10, RADC30, RADCmedian and RADCmax respectively).
2.
Representative image from a 62-year-old female in progressive group before radiofrequency ablation (RFA) treatment for hepatocellular carcinoma (HCC). (A) Apparent diffusion coefficient (ADC) histogram image. The area covered by green shadow is the ADCmedian area; (B) ADC image shows the maximum section area. The whole lesion is the regions of interest (ROI), and the green shadow inside is the ADCmedian area. The ROI area of the lesion at the posterior right lobe of liver is 2,211 mm2, lesion ADCmax=1.77×10⁻³ mm2/s, ADCmedian=1.56×10⁻³ mm2/s and RADCmedian=0.74.
3.
Representative image from a 49-year-old male in stable group before radiofrequency ablation (RFA) treatment for hepatocellular carcinoma (HCC). (A) Apparent diffusion coefficient (ADC) histogram image. The area covered by green shadow is the ADCmedian area; (B) ADC image shows the maximum sectional area. The regions of interest (ROI) covers the whole lesion, and the green shadow inside is the ADCmedian area. The ROI area of the lesion at the posterior right lobe of liver is 643 mm2, lesion ADCmax=1.24×10⁻³ mm2/s, ADCmedian=1.04×10⁻³ mm2/s, and RADCmedian=0.68.
Statistical analysis
The Kolmogorov-Smirnov test was used to evaluate whether the continuous variables were normally distributed. The student’s t-test was used to compare continuous variables under the normal distribution between the stable and progressive groups, and Kruskal-Wallis test for data being not subject to normal distribution. Categorical variables were compared using the Fisher’s exact test. For the calculation of PFS, disease progression defined by RECIST 1.1 or death was used as an endpoint. The median PFS for all patients was calculated. The time interval of PFS was defined as the time between diagnosis of HCC and the date of imaging study just before identification of disease progression by imaging or death. The significant factors on disease progression were obtained by using the Cox model of univariate analysis. For factors with statistical significance, the Cox model of multivariate forward regression was used to identify key factors for predicting disease progression. Key factors were divided into two groups by using the median value, and the survival curves were plotted using the Kaplan-Meier method. The log-rank test was used to compare the pairs of survival curves based on key factors. Statistical significance was accepted at P<0.05 for all tests. All analyses were performed using SPSS software (Version 13.0; SPSS Inc., Chicago, IL, USA), except the multivariate model, which used the R software (Version 3.4.1; R Foundation for Statistical Computing, Vienna, Austria, http://www.r-project.org/) to evaluate its effectiveness.
Results
Patient characteristics
Sixty-four patients met the inclusion criteria and 174 patients were excluded from the analysis, which was shown in the flowchart in Figure 1 . The stable group consisted 31 patients (25 males and 6 females, age range: 43−81 years, left lobe: 8 patients, and right lobe: 23 patients). The disease progression group comprised 33 patients (23 males and 10 females, age range: 44−84 years, left lobe: 5 patients, and right lobe: 28 patients).
ADC parameters
The ADC30, ADCmedian, ADCmax, RADC30, RADCmedian and RADCmax were significantly larger in the progressive group than in the stable group (P<0.05;Table 1 ). There were no significant differences in the age, MTD, ADC10 and RADC10 between the two groups (P>0.05,Table 1 ). The categorical variables of AFP and TFN were not significantly different between the two groups (P=1.00, P=0.62) (Table 1 ). In the progressive group, the MTD range was 0.5−6.9 cm with the median MTD of 2.6 cm. In the stable group, the MTD range was 0.5−7.1 cm with the median MTD of 2.7 cm.
1.
Comparison between stable and progressive groups before RFA treatment for HCC
| Variables | Stable group
(n=31) (  )
)
|
Progressive group
(n=33) (  )
)
|
P | t/z |
| RFA, radiofrequency ablation; HCC, hepatocellular carcinoma; MTD, maximal tumor diameter; AFP, alpha-fetoprotein; TFN, transferrin; ADC, apparent diffusion coefficient; RADC, non-lesion area ADC; #, categorical variables were compared using the Fisher’s exact test; *, ADC values are in units of 10−3 mm2/s. | ||||
| Age (year) | 61.50±9.80 | 59.20±9.90 | 0.35 | 0.94 |
| MTD (cm) | 2.7±1.4 | 2.6±1.3 | 0.79 | 0.27 |
| AFP [n (%)] | 1.00# | |||
| Negtive | 27 (42.19) | 28 (43.75) | ||
| Positive | 4 (6.25) | 5 (7.81) | ||
| TFN [n (%)] | 0.62# | |||
| Negtive | 11 (17.19) | 14 (21.87) | ||
| Positive | 20 (31.25) | 19 (29.69) | ||
| ADC10 | 0.79±0.16 | 0.88±0.21 | 0.06 | −1.92 |
| ADC30 | 0.89±0.17 | 0.99±0.19 | 0.03* | −2.19 |
| ADCmedian | 0.95±0.18 | 1.06±0.20 | 0.03* | −2.28 |
| ADCmax | 1.12±0.21 | 1.22±0.22 | 0.04* | −1.95 |
| RADC10 | 0.57±0.09 | 0.62±0.11 | 0.08 | −1.77 |
| RADC30 | 0.64±0.09 | 0.69±0.09 | 0.03* | −2.26 |
| RADCmedian | 0.68±0.10 | 0.74±0.08 | 0.02* | −2.50 |
| RADCmax | 0.80±0.10 | 0.86±0.09 | 0.02* | −2.33 |
Correlation between significant ADC histogram parameters and PFS
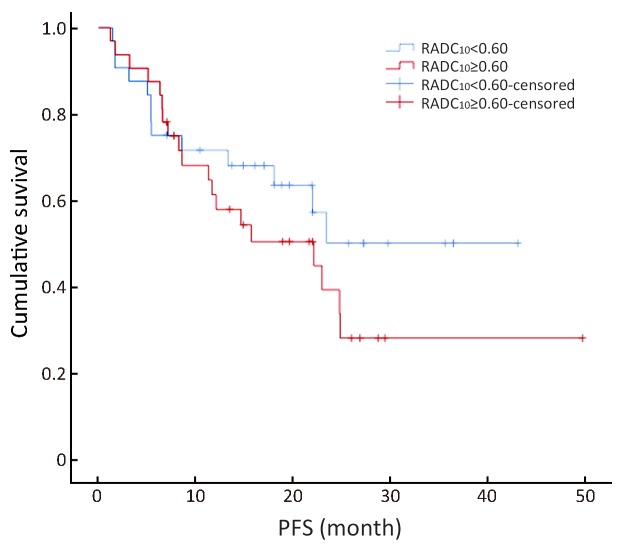
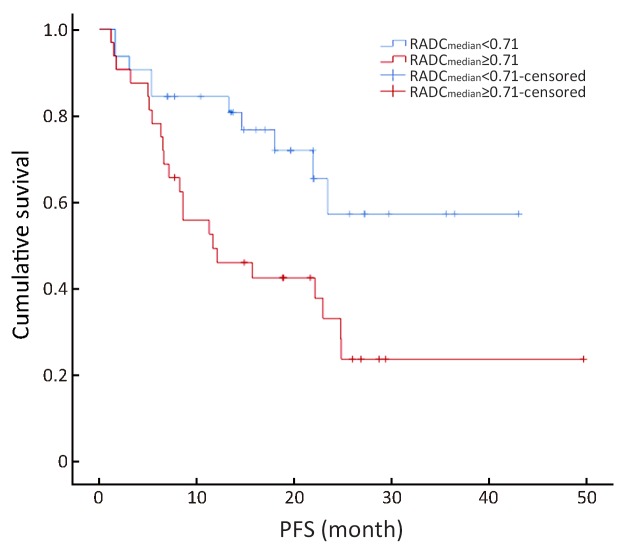
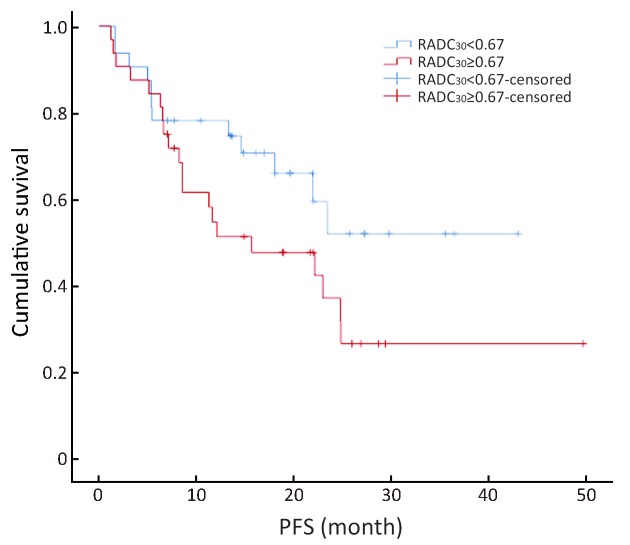
The survival curve showed that RADC10, RADC30 and RADCmedian were correlated with PFS (Figures 4 −6 ). In the univariate analysis, RADC10, RADC30 and RADCmedian had a significant impact on PFS (P=0.04), and the hazard ratio (HR) values were 31.02, 43.84 and 44.29, respectively. Other factors including age, gender, MTD, AFP, ADC10, ADC30, ADCmedian, ADCmax and RADCmax had no significant impact on PFS (P>0.05,Table 2 ). In addition, the median PFS from all patients was 22.9 months (95% CI, 16.7−29.2). The mean PFS for the stable and progressive group were 47.7±1.3 and 9.8±1.3 months, respectively.
4.
Ratio of apparent diffusion coefficient (ADC)10 to the mean ADC of the non-lesion area (RADC10) value could be divided into two groups using the median value (0.60) as the boundary value (χ2=1.17, P=0.28).
6.
Ratio of apparent diffusion coefficient (ADC)median to the mean ADC of the non-lesion area (RADCmedian) value could be divided into two groups using the median value (0.71) as the boundary value (χ2=5.12, P=0.02). The average disease progressive-free survival (PFS) was 20.71±3.41 months in the RADCmedian group with a value ≥0.71 [95% confidence interval (95% CI), 23.39−35.91], and 26.65±3.19 months in the RADCmedian group with a value <0.71 (95% CI, 14.02−27.41).
2.
Impact of different factors on PFS before RFA treatment for HCC
| Variables | β | SE | Wald value | HR | 95% CI | P |
| The Cox model of univariate analysis, n=64, α=0.05. PFS, progression-free survival; RFA, radiofrequency ablation; HCC, hepatocellular carcinoma; MTD, maximal tumor diameter; AFP, alpha-fetoprotein; TFN, transferrin; ADC, apparent diffusion coefficient; RADC, non-lesion area ADC; β, regression coefficient; SE, standard error; HR, hazard ratio; 95% CI, 95% confidence interval. *, ADC values are in units of 10−3 mm2/s. | ||||||
| Gender | −0.53 | 0.43 | 1.54 | 0.59 | 0.25−1.36 | 0.22 |
| Age (year) | −0.04 | 0.02 | 2.90 | 0.97 | 0.93−1.01 | 0.09 |
| MTD (cm) | −0.07 | 0.14 | 0.23 | 0.94 | 0.72−1.23 | 0.64 |
| AFP (ng/mL) | 0 | 0 | 0.92 | 1.00 | 1.00−1.01 | 0.34 |
| TFN (ng/mL) | 0 | 0 | 0.32 | 1.00 | 0.99−1.03 | 0.57 |
| ADC10 | 0 | 0 | 2.79 | 1.00 | 1.00−1.01 | 0.09 |
| ADC30 | 0 | 0 | 2.29 | 1.00 | 0.97−1.02 | 0.13 |
| ADCmedian | 0 | 0 | 1.92 | 1.00 | 0.98−1.01 | 0.17 |
| ADCmax | 0 | 0 | 0.77 | 1.00 | 0.99−1.02 | 0.38 |
| RADC10 | 3.44 | 1.78 | 3.73 | 31.02 | 1.01−101.32 | 0.04* |
| RADC30 | 3.78 | 1.91 | 3.91 | 43.84 | 1.03−185.90 | 0.04* |
| RADCmedian | 3.79 | 1.91 | 3.92 | 44.29 | 1.04−198.74 | 0.04* |
| RADCmax | 2.93 | 1.92 | 2.34 | 18.72 | 0.44−80.11 | 0.13 |
5.
Ratio of apparent diffusion coefficient (ADC)30 to the mean ADC of the non-lesion area (RADC30) value could be divided into two groups using the median value (0.67) as the boundary value (χ2=2.68, P=0.10).
Key factor for PFS of RFA in HCC
The multivariate forward analysis of RADC10, RADC30 and RADCmedian showed that RADCmedian had an independent significant impact on PFS (χ2=4.12, P=0.04). The mean of C-index of the multivariate model was 0.617 [standard error (SE) =0.056]. The RADC10, RADC30 and RADCmedian value could be divided into two groups by using the median value of 0.60, 0.67 and 0.71, respectively (χ2=1.17, 2.68 and 5.12; P=0.28, 0.10 and 0.02). The average PFS was 20.71±3.41 months in the RADCmedian group with a value ≥0.71 (95% CI, 23.39−35.91), and 26.65±3.19 months in the RADCmedian group with a value <0.71 (95% CI, 14.02−27.41) ( Figures 4 −6 ).
Discussion
Our study showed that baseline ADC and RADC values were significantly different between the progressive and stable groups suggesting that ADC and RADC values might be useful predictive biomarkers prior to RFA in HCC patients. Previous studies focused on the evaluation of RFA efficacy and monitoring recurrence after the RFA treatment (6,7). However, a proper evaluation method for predicting the therapeutic efficacy before RFA is urgently needed. This is important to provide indications for clinical project selection and prognostic prediction. Therefore, our findings might offer insights into evaluation of RFA treatment in HCC.
We also demonstrated that the ADC and RADC values before the RFA were larger in the progressive group than in the stable group, and the higher pre-treatment ADC and RADC values were associated with the shorter PFS. Previous studies (15-17) have found that in HCC patients, high ADC values prior to transcatheter arterial chemoembolization (TACE) or chemotherapy were related to poor prognosis. Furthermore, Dong et al. (17) showed that ADC values before TACE were negatively correlated with survival. Our findings were in agreement with these reports (15-17). The reason for high ADC values observed in our study may be as follows. There is a negative correlation between a tumor ADC value and cell density (18). When the cell density increases, the extracellular space decreases, limiting the diffusion of water molecules, and thus the ADC values decrease accordingly. Cell density is a significant indicator of cellular differentiation and malignancy of the tumor (18). Hence, the ADC value might reflect the degree of malignancy to some extent. However, there were discrepancies in association between ADC values and response to therapy in these studies because of marked differences in tumor types, treatment modalities, chemotherapeutic agents, and methods to analyze the data. Further studies with large-scale and long-term follow-up will be needed to explain high ADC values observed in HCC patients.
The RADC10, RADC30 and RADCmedian but not ADC had a significant impact on PFS. Many factors influence ADC value, especially in the liver including blood supply, tumor localization and cirrhosis. The liver has a dual blood supply; it receives blood from both the hepatic artery and portal vein. In this study, most patients had mild to moderate cirrhosis. These factors affect background ADC values in the liver. To compensate for these effects, ADC values measured in the lesion were compared with the ADC values in non-lesion areas calculating RADC values. The RADC value was a reference index that could more objectively reflect the real status of the lesions. Our results supported that the RADC values of HCC lesions could predict patients’ response to RFA.
We found that not only RADC had the predictive power, but also RADCmedian was the only independent predictor of our outcome. Using 0.71 as the cutoff value of RADCmedian to segment our subjects into two groups, we found that PFS was reduced in the group with high RADCmedian values. Furthermore, consistent with previous studies, RADCmedian was negatively correlated with PFS (16,19).
Previously, Moffat et al. (19) reported that it was not possible to reflect tumor heterogeneity using changes in average ADC value to evaluate the efficacy of HCC intervention. Future studies should use RADCmedian value in patients receiving treatments other than RFA like TACE. Furthermore, RADCmedian value could be used to evaluate treatment efficacy in other tumors.
Interestingly, our results demonstrated that gender, age and tumor MTD had no significant effect on the PFS. Previous studies by Heo et al. (20) on the predictive value of ADC for cervical cancer showed that a variety of clinical factors (including age, MTD, tumor stage and pelvic lymph node metastasis) had a limited predictive value on the efficacy of cervical cancer treatment. The authors (20) suggested that the pattern of disease progression generally rely on the biologic heterogeneity of the tumor itself. Therefore, functional MRI techniques that reflect internal characteristics of the tumor were valuable.
In previous studies, Kao et al. (21) showed that patients with higher preoperative AFP levels had poorer prognosis after microwave ablation treatment. Furthermore, Zaitsu et al. (22) reported that the survival rates of patients who had serum TFN levels of 190 mg/dL or more were significantly higher than those of patients with lower TFN levels. However, we found that pre-treatment plasma AFP and TFN had no significant impact on PFS. This was supported by a previous study (23), which showed that decreased AFP level was significantly correlated with tumor regression in less than 1/3 of HCC patients.
This study had some limitations. First, we had a relatively small sample size. Second, there were artifacts in the DWI because currently DWI spatial resolution was relatively poor (8). Third, in 4 patients, the ADC histograms were not sharp to measure lesions smaller than 1 cm in diameter, and DWI artifacts affected the observation and measurement of lesions in 6 patients. Lastly, the boundary RADCmedian value was identified by the median value. An improved analysis with a larger cohort might identify another metric using the receiver operating characteristic (ROC) curve.
Conclusions
We showed that use of histogram analysis to extract ADC features associated with heterogeneous ADC distributions improve the predictive power of DWI in HCC patients treated with RFA. The RADCmedian value might be a potential biomarker for predicting treatment efficacy of RFA in HCC patients.
Acknowledgements
This study was supported by CAMS Innovation Fund for Medical Sciences (CIFMS) (No. 2016-I2M-1-001), PUMC Youth Fund (No. 2017320010) and Beijing Hope Run Fund of Cancer Foundation of China (No. LC2016B15).
Footnote
Conflicts of Interest: The authors have no conflicts of interest to declare.
Contributor Information
Chunwu Zhou, Email: cjr.zhouchunwu@vip.163.com.
Xinming Zhao, Email: xinmingzh@sina.com.
References
- 1.Yuan Z, Li WT, Ye XD, et al Novel functional magnetic resonance imaging biomarkers for assessing response to therapy in hepatocellular carcinoma. Clin Transl Oncol. 2014;16:599–605. doi: 10.1007/s12094-013-1147-5. [DOI] [PubMed] [Google Scholar]
- 2.Chen W, Sun K, Zheng R, et al Cancer incidence and mortality in China, 2014. Chin J Cancer Res. 2018;30:1–12. doi: 10.21147/j.issn.1000-9604.2018.01.01. [DOI] [PMC free article] [PubMed] [Google Scholar]
- 3.Xu XL, Liu XD, Liang M, et al Radiofrequency ablation versus hepatic resection for small hepatocellular carcinoma: systematic review of randomized controlled trials with meta-analysis and trial sequential analysis. Radiology. 2018;287:461–72. doi: 10.1148/radiol.2017162756. [DOI] [PubMed] [Google Scholar]
- 4.Lee YH, Hsu CY, Chu CW, et al Radiofrequency ablation is better than surgical resection in patients with hepatocellular carcinoma within the Milan criteria and preserved liver function: a retrospective study using propensity score analyses. J Clin Gastroenterol. 2015;49:242–9. doi: 10.1097/MCG.0000000000000133. [DOI] [PubMed] [Google Scholar]
- 5.Pompili M, Saviano A, de Matthaeis N, et al Long-term effectiveness of resection and radiofrequency ablation for single hepatocellular carcinoma ≤3 cm. Results of a multicenter Italian survey. J Hepatol. 2013;59:89–97. doi: 10.1016/j.jhep.2013.03.009. [DOI] [PubMed] [Google Scholar]
- 6.Gory I, Fink M, Bell S, et al Radiofrequency ablation versus resection for the treatment of early stage hepatocellular carcinoma: a multicenter Australian study. Scand J Gastroenterol. 2015;50:567–76. doi: 10.3109/00365521.2014.953572. [DOI] [PubMed] [Google Scholar]
- 7.Gordic S, Corcuera-Solano I, Stueck A, et al Evaluation of HCC response to locoregional therapy: Validation of MRI-based response criteria versus explant pathology. J Hepatol. 2017;67:1213–21. doi: 10.1016/j.jhep.2017.07.030. [DOI] [PubMed] [Google Scholar]
- 8.Taouli B, Koh DM Diffusion-weighted MR imaging of the liver. Radiology. 2010;254:47–66. doi: 10.1148/radiol.09090021. [DOI] [PubMed] [Google Scholar]
- 9.Elsayes KM, Hooker JC, Agrons MM, et al 2017 Version of LI-RADS for CT and MR Imaging: An Update. Radiographics. 2017;37:1994–2017. doi: 10.1148/rg.2017170098. [DOI] [PubMed] [Google Scholar]
- 10.Kondo M, Uchiyama Y Apparent diffusion coefficient histogram analysis for prediction of prognosis in glioblastoma. J Neuroradiol. 2018;45:236–41. doi: 10.1016/j.neurad.2017.11.011. [DOI] [PubMed] [Google Scholar]
- 11.Min X, Feng Z, Wang L, et al Characterization of testicular germ cell tumors: Whole-lesion histogram analysis of the apparent diffusion coefficient at 3T. Eur J Radiol. 2018;98:25–31. doi: 10.1016/j.ejrad.2017.10.030. [DOI] [PubMed] [Google Scholar]
- 12.Xu XQ, Li Y, Hong XN, et al Radiological indeterminate vestibular schwannoma and meningioma in cerebellopontine angle area: differentiating using whole-tumor histogram analysis of apparent diffusion coefficient. Int J Neurosci. 2017;127:183–90. doi: 10.3109/00207454.2016.1164157. [DOI] [PubMed] [Google Scholar]
- 13.Hempel JM, Schittenhelm J, Bisdas S, et al In vivo assessment of tumor heterogeneity in WHO 2016 glioma grades using diffusion kurtosis imaging: Diagnostic performance and improvement of feasibility in routine clinical practice . J Neuroradiol. 2018;45:32–40. doi: 10.1016/j.neurad.2017.07.005. [DOI] [PubMed] [Google Scholar]
- 14.Liang HY, Huang YQ, Yang ZX, et al Potential of MR histogram analyses for prediction of response to chemotherapy in patients with colorectal hepatic metastases. Eur Radiol. 2016;26:2009–18. doi: 10.1007/s00330-015-4043-2. [DOI] [PubMed] [Google Scholar]
- 15.Wu XM, Wang JF, Ji JS, et al Evaluation of efficacy of transcatheter arterial chemoembolization for hepatocellular carcinoma using magnetic resonance diffusion-weighted imaging. Onco Targets Ther. 2017;10:1637–43. doi: 10.2147/OTT.S115568. [DOI] [PMC free article] [PubMed] [Google Scholar]
- 16.Yuan Z, Li WT, Peng WJ Pre-treatment apparent diffusion coefficient is imaging biomarker for prediction of response to chemoembolization in hepatocellular carcinoma. Eur J Radiol. 2013;82:e901–2. doi: 10.1016/j.ejrad.2013.08.009. [DOI] [PubMed] [Google Scholar]
- 17.Dong S, Ye XD, Yuan Z, et al Relationship of apparent diffusion coefficient to survival for patients with unresectable primary hepatocellular carcinoma after chemoembolization. Eur J Radiol. 2012;81:472–7. doi: 10.1016/j.ejrad.2010.12.081. [DOI] [PubMed] [Google Scholar]
- 18.Gibbs P, Liney GP, Pickles MD, et al Correlation of ADC and T2 measurements with cell density in prostate cancer at 3.0 Tesla. Invest Radiol. 2009;44:572–6. doi: 10.1097/RLI.0b013e3181b4c10e. [DOI] [PubMed] [Google Scholar]
- 19.Moffat BA, Chenevert TL, Lawrence TS, et al Functional diffusion map: a noninvasive MRI biomarker for early stratification of clinical brain tumor response. Proc Natl Acad Sci USA. 2005;102:5524–9. doi: 10.1073/pnas.0501532102. [DOI] [PMC free article] [PubMed] [Google Scholar]
- 20.Heo SH, Shin SS, Kim JW, et al Pre-treatment diffusion-weighted MR imaging for predicting tumor recurrence in uterine cervical cancer treated with concurrent chemoradiation: value of histogram analysis of apparent diffusion coefficients. Korean J Radiol. 2013;14:616–25. doi: 10.3348/kjr.2013.14.4.616. [DOI] [PMC free article] [PubMed] [Google Scholar]
- 21.Kao WY, Chiou YY, Hung HH, et al Serum alpha-fetoprotein response can predict prognosis in hepatocellular carcinoma patients undergoing radiofrequency ablation therapy. Clin Radiol. 2012;67:429–36. doi: 10.1016/j.crad.2011.10.009. [DOI] [PubMed] [Google Scholar]
- 22.Zaitsu J, Yamasaki T, Saeki I, et al Serum transferrin as a predictor of prognosis for hepatic arterial infusion chemotherapy in advanced hepatocellular carcinoma. Hepatol Res. 2014;44:481–90. doi: 10.1111/hepr.12141. [DOI] [PubMed] [Google Scholar]
- 23.Colli A, Fraquelli M, Casazza G, et al Accuracy of ultrasonography, spiral CT, magnetic resonance, and alpha-fetoprotein in diagnosing hepatocellular carcinoma: a systematic review. Am J Gastroenterol. 2006;101:513–23. doi: 10.1111/j.1572-0241.2006.00467.x. [DOI] [PubMed] [Google Scholar]


