

Abstract
Squamous cell carcinoma (SCC) of the external auditory canal (EAC) is rare and offers a poor prognosis; more accurate prognostic biomarkers are required. Our laboratory recently demonstrated that tumor budding, characterized by tumor cell clusters (< 5 cells), and laminin 5-γ2 staining of SCC of the EAC are associated with shorter survival. However, clusters composed of ≥ 5 tumor cells are also found in the stroma. Previous reports of colorectal cancer suggest that poorly differentiated clusters (PDCs) are a negative prognostic indicator. Here, we report on the association between PDCs and prognosis in SCC of the EAC. PDCs and tumor budding were histopathologically and immunohistochemically (cytokeratin AE1/AE3) analyzed in 31 cases of pre-treatment biopsy SCC of the EAC. Clusters in the stroma composed of < or ≥ 5 cancer cells were defined as tumor budding or PDCs, respectively. Entire tumors were initially scanned to identify greatest PDC density. Tumors with low or high PDC density were classified as low- and high-grade, respectively. Patients with high-grade PDCs had a significantly poorer outcome than those with low-grade. Even in cases of low-grade tumor budding, those with high-grade PDCs had a poor prognosis. Multivariate analysis results indicated that high-grade PDCs were associated with poor prognosis. PDC grade can provide a more accurate prognosis than tumor budding in SCC of the EAC.
Keywords: Clustered tumor cell, Neoplasm invasion, Squamous cell carcinoma, External auditory canal
Introduction
The external auditory canal (EAC) is a small area including an outer cartilaginous portion, comprising one-third to one-half of its length, and an inner bony or osseous portion [1]. Stratified squamous epithelium on the EAC and tympanic membrane is known to be unique in its ability to migrate from the tympanic membrane outward, since this migratory phenomenon has not been observed in the squamous epithelium of other organs including skin, oral cavity, esophagus, and the uterine cervix [2–4]. Squamous cell carcinoma (SCC) arising from the unique epithelium of the EAC is a rare, aggressive cancer with a poor prognosis [5, 6]. The current 5-year disease-specific survival of stage I, II, III, and IV are 94.8, 78.9, 68.3, and 22.9%, respectively [7]. Aggressive surgery is needed for patients with advanced disease, but it also causes severe complications that impair patient quality of life [5, 8]. In order to improve these prognoses and patient quality of life, an accurate staging system that can formulate treatment strategy is needed. The revised University of Pittsburgh TNM staging system is commonly used during prognosis [9]. However, there are some patients with tumors that recur locally despite their categorization as low-risk and, conversely, some patients have longer survival times despite their categorization as high-risk [8]. For more accurate assessment of these patients with intermediate-stage tumors, a search for morphologic or molecular biomarkers that reflect the biological characteristics of SCC-EAC and patient outcome prediction is needed [10].
For head and neck SCC, studies have shown that it is not the differentiation grade but the invasion pattern that is important for assessment of clinical aggressiveness and prognosis [11, 12]. The invasion pattern classified as Grade or Score 4 represents marked and widespread cellular dissociation in small groups and/or in single cells. More recently, tumor budding, a specific type of invasive growth in carcinomas characterized by invading single or small clusters of tumor cells (< 5 cells) at the invasive front, has been introduced and assessed in SCC of the oral cavity, tongue, and larynx and nasopharyngeal carcinoma [13]. Tumor budding is only evaluated in < 5 tumor cells, although clusters composed of ≥ 5 tumor cells are also found. Poorly differentiated clusters (PDCs) are a histological feature of tumor stroma defined as tumor cell clusters composed of ≥ 5 tumor cells and lacking a gland-like structure. PDCs are an established negative prognostic factor in colorectal cancer [14] and invasive breast cancer [15]. Furthermore, a high incidence of PDCs is associated with poor prognosis and recurrence in liver, lung, node/local recurrence, and peritoneal dissemination [14].
Previous SCC-EAC studies in the current laboratory recently demonstrated that tumor budding and laminin 5-γ2 are associated with a shorter survival [16]. Moreover, tumor budding helped stratify patients into more meaningful risk groups than TNM staging alone. Thereafter, however, some patients with shorter survival periods were identified in the low-grade tumor budding group. Thus, in the current study, we examined whether morphological assessment of pre-treatment biopsy samples using a grading system based on PDCs was more useful than using an observation of tumor budding for the interpretation of prognosis in SCC-EAC.
Patients and Methods
Patient Selection
We retrospectively reviewed clinicopathological data for 31 patients with primary SCC-EAC, for whom pretreatment tissue specimens were available, and who were treated with the same strategy [17] at the Department of Otorhinolaryngology Fukuoka University Hospital (Fukuoka, Japan) from April 2006 to December 2015. Patients who underwent chemotherapy or radiotherapy prior to biopsy, patients whose cancer specimen had no stroma, or patients who failed to follow our treatment plan, were excluded from the study. Assuming patient anonymity, biopsy samples can be used for research purposes through a standard treatment agreement with Fukuoka University Hospitals. The study protocol was approved by the Institutional Review Board (The Ethics Committee) of Fukuoka University (No. 12-7-13) Hospital. Clinical stage was determined using the University of Pittsburgh TNM staging system modified by Hirch, 2000 [9]. Before treatment, patient disease stage was estimated by physical examination and imaging studies: computed tomography (CT) and magnetic resonance imaging (MRI). CT and MRI scans were routinely conducted every 6 months, for 3 years after therapy, and annually thereafter. The absence of any signs of enlargement of a space-occupying lesion was designated as “no evidence of disease.” The follow-up period for the complete series ranged from 4 to 66 months (median, 31 months). We assessed the effect of therapy using surgical tissue specimens, according to the General Rules for Clinical Studies on Head and Neck Cancer [18].
Tissue Samples and Immunohistochemistry (IHC)
Biopsy specimens were fixed in 10% formalin, processed into paraffin blocks, sectioned (4-µm thickness), deparaffinized, and hydrated in descending alcohol dilutions. For anti-cytokeratin antibody staining, sections were immersed in 3% hydrogen peroxide in water for 10 min at room temperature (RT) to block endogenous peroxidase activity, and heated in 10 mM ethylenediamine-tetraacetic acid (EDTA) buffer (pH 8.0) in a microwave (700 W) for 10 min to retrieve epitopes before staining. The sections were incubated with anti-human cytokeratin (CK) monoclonal antibody (AE1/AE3, Dako; 1:200) for 1 h at RT. Sections were then washed in Tris-buffered saline (TBS) and incubated for 30 min at RT with EnVision reagent conjugated horseradish peroxidase (Dako). Immunoreactive proteins were visualized with 3,3′-diamino-benzidine (Dako), followed by counterstaining with Mayer’s hematoxylin. The stained sections were evaluated semiquantitatively by two independent pathologists who were blinded to the clinical data.
PDCs Grade
In SCC-EAC, clusters surrounded by stroma and composed of ≥ 5 cancer cells were defined as PDCs. To quantify PDCs [14], the whole tumor was first scanned under low magnification to identify the area with most PDCs. Next, the clusters were counted within the microscopic field of a × 20 objective lens (WHK 10 × ocular lens; Olympus, Tokyo, Japan). Tumors with < 5, 5–9, or ≥ 10 PDCs were classified as grade 1, grade 2, and grade 3, respectively. Although Ueno et al. discuss that the counting of clusters composed of ≥ 5 cancer cells on hematoxylin and eosin (H&E)-stained sections is a sufficiently easy process [14], IHC enabled us to evaluate PDCs more accurately. For example, it was easier and more accurate in CK immunostained sections to count the number of cells comprising tumor cell clusters and to discriminate a tumor cell cluster from adjacent single cells or clusters (Fig. 1a, b). PDCs were found in the blue-colored areas in Fig. 1c. The degree of PDCs was classified as low-grade or high-grade, corresponding to 0–4 (grade 1) or > 5 clusters (grades 2, 3) in one field, respectively.
Fig. 1.
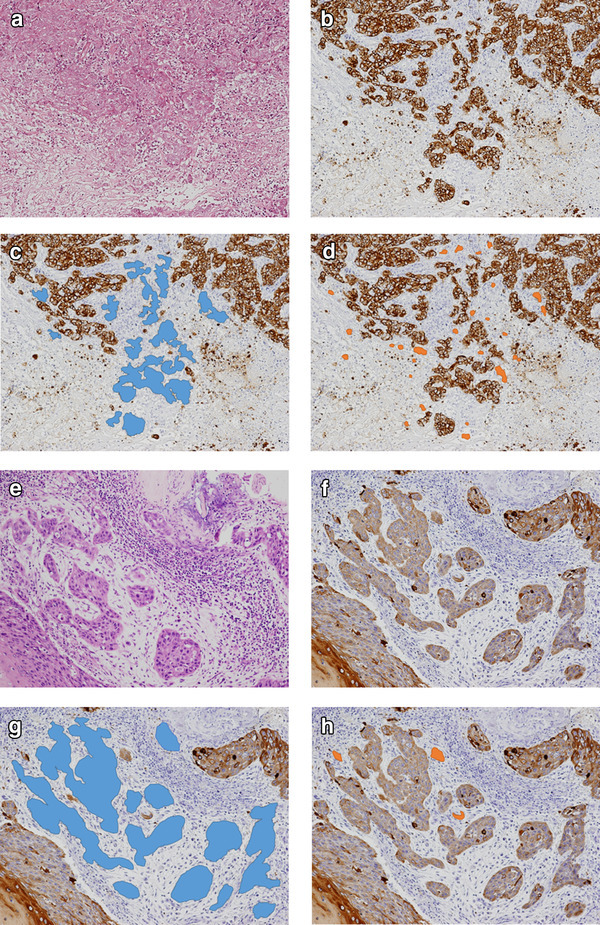
Histopathology using hematoxylin and eosin (H&E) stains (a, e), and immunostaining of cytokeratin AE1/AE3 (b–d and f–h) at the stroma of squamous cell carcinoma of the external auditory canal. c, g PDCs are shown in blue. d, h Tumor budding is shown in orange
Tumor Budding Grade
We also evaluated tumor budding as a cancer cell nest consisting of < 5 cells that infiltrated the stroma of the cancer [16, 19, 20]. After selecting an area in which tumor budding was most intensive, the buds were counted in a field under a × 20 objective lens by using both H&E stained and CK immunostained sections as described previously [16, 19] (Fig. 1a, b). Tumor budding was present in the orange-colored areas of Fig. 1d. Depending on the amount of tumor budding, we defined: grade 0, no buds; grade 1, 1–4 buds; grade 2, 5–9 buds; grade 3, ≥ 10 buds. The degree of tumor budding was classified as low-grade or high-grade, corresponding to 0–9 (grade 0, 1, and 2) or ≥ 10 budding foci (grade 3) in one field, respectively.
Agreement on Tumor Grading Based on PDCs
To determine interobserver agreement, tumor grading based on PDCs (grade 1, 2, 3) was independently judged by two pathologists (M.M., M.A.) who examined PDCs in H&E and CK AE1/AE3 IHC for 31 cases of SCC-EAC.
Statistical Analysis
The relationships between several clinicopathological parameters and the results of PDCs assessments were evaluated using the Student t-test for a continuous variable, Fisher’s exact test for nominal variables, and the Wilcoxon test for ordinal categorical variables. The weighted κ coefficient was used for assessing interobserver agreement in tumor grading of PDCs. Progression-free survival curves were plotted using the Kaplan–Meier method, and low-grade PDCs and high-grade PDCs were compared using the log-rank test. Univariate analyses were performed for clinicopathological parameters using the Cox regression model; then hazard ratios and their 95% confidence intervals were estimated. Multivariate analysis (Cox proportional-hazard model) was used to determine independent prognostic factors. A P value < 0.05 was considered statistically significant. The weighted κ coefficient was conducted with SAS Version 9.4 (SAS Institute, Cary, North Carolina, USA); other analyses including Cox proportion-hazard model were conducted using JMP10.0.2 for Windows.
Results
Clinicopathological Parameters
The clinicopathological characteristics of the present cohort are given below: n = 32 patients (14 male, 17 female); mean age = 63 year (range 38–86 year). The median follow-up period was 31 months (range 4–66 months). The TNM stage for the majority of tumors was stage IV [15 (48.4%)]. The proportions of patients with lymph node and distant metastases were 19.4 and 3.3%, respectively (Table 1). Lateral temporal bone resection was achieved in 11 cases, subtotal temporal bone resection was achieved in 10 cases, and ten cases received only chemo-radiotherapy. Of the 21 (67.7%) patients who underwent surgery, 6 (28.6%) patients had postoperative local recurrence. Of these 21 patients, 18 (85.7%) had received neoadjuvant chemo-radiotherapy. The effect of therapy was classified as one case (5.6%) of grade 0, one (5.6%) of grade 1, 9 (50.0%) of grade 2, and 7 (38.9%) of grade 3.
Table 1.
Patient clinicopathological details
| Clinicopathological details | No. of cases or year | Percentage of cases (%) |
|---|---|---|
| Patients | 31 | |
| Gender | ||
| Female | 17 | 54.8 |
| Male | 14 | 45.2 |
| Age (year) | ||
| Mean | 63 | |
| Range | 38–86 | |
| Tumor differentiation | ||
| Well | 21 | 67.7 |
| Moderate | 7 | 22.6 |
| Poor | 3 | 9.7 |
| T (primary tumor)a | ||
| T1 | 1 | 3.2 |
| T2 | 11 | 35.5 |
| T3 | 4 | 12.9 |
| T4 | 15 | 48.4 |
| N (regional lymph nodes)a | ||
| N0 | 25 | 80.6 |
| N1 | 6 | 19.4 |
| M (distant metastasis)a | ||
| M0 | 30 | 96.7 |
| M1 | 1 | 3.3 |
| TNM stagea | ||
| I | 1 | 3.2 |
| II | 9 | 29.0 |
| III | 6 | 19.4 |
| IV | 15 | 48.4 |
aThe staging protocol proposed by the University of Pittsburgh (modified by Hirsh, 2000)
PDCs and Tumor Budding in Pre-treatment Biopsy Samples
PDCs results indicated that 7 (22.5%) patients were grade 1, 8 (25.8%) were grade 2, and 16 (51.6%) were grade 3. Seven (22.5%) patients were judged to be low-grade and 24 (77.4%) high-grade. Tumor budding results indicated that 25 (80.6%) patients were low-grade and 6 (19.4%) high-grade. Figure 1a–d shows examples with both a high budding grade and high-grade PDCs. The histopathological sections (Fig. 1e–h) show examples with low budding grade and high-grade PDCs.
Association Between PDCs and Clinicopathological Parameters
Table 2 summarizes the association between PDCs and clinicopathological parameters. High-grade PDCs were significantly associated with mean age (P = 0.0262), T factor (P = 0.007), TNM stage (P = 0.0017), middle ear invasion (P = 0.0124), and effect of therapy (P = 0.0474). All low-grade PDCs cases revealed no lymph node metastasis, distant metastasis, poor differentiation, parotid gland invasion, temporomandibular joint invasion, otic capsule invasion, pterygoid muscle invasion, parapharyngeal space invasion, internal jugular invasion, petrous apex invasion, facial nerve palsy, common carotid artery invasion, or middle cranial fossa invasion.
Table 2.
Clinicopathological features in relation to poorly differentiated clusters
| Poorly differentiated clusters | |||
|---|---|---|---|
| Low-grade 7 (22.5%) |
High-grade 24 (77.4%) |
P-value | |
| Mean age [year, (SD)] | 71.1 (± 6.5) | 60.6 (± 11.2) | 0.0262* |
| M:F | 4:3 | 10: 14 | 0.671 |
| T | |||
| T1 | |||
| T2 | 6 (85.7%) | 6 (25.0%) | |
| T3 | |||
| T4 | 1 (14.3%) | 18 (75.0%) | 0.007* |
| N | |||
| N0 | 7 (100%) | 18 (75.0%) | |
| N+ | 0 (0%) | 6 (25.0%) | 0.293 |
| M | |||
| M0 | 7 (100%) | 23 (95.8%) | |
| M+ | 0 (0%) | 1 (4.2%) | 1.000 |
| TNM stage | |||
| Stage I | |||
| Stage II | 6 (85.7%) | 4 (16.7%) | |
| Stage III | |||
| Stage IV | 1 (14.3%) | 20 (83.3%) | 0.0017* |
| Differentiation | |||
| Well | 6 (85.7%) | 15 (62.5%) | |
| Moderate | 1 (14.3%) | 6 (25.0%) | |
| Poor | 0 (0%) | 3 (12.5%) | 0.239 |
| Middle ear invasion | |||
| Absent | 6 (85.7%) | 7 (29.2%) | |
| Present | 1 (14.3%) | 17 (70.8%) | 0.0124* |
| Parotid gland invasion | |||
| Absent | 7 (100%) | 14 (58.3%) | |
| Present | 0 (0%) | 10 (41.7%) | 0.0661 |
| Temporomandibular joint invasion | |||
| Absent | 7 (100%) | 15 (62.5%) | |
| Present | 0 (0%) | 9 (37.5%) | 0.0766 |
| Otic capsule invasion | |||
| Absent | 7 (100%) | 14 (58.3%) | |
| Present | 0 (0%) | 10 (41.7%) | 0.0661 |
| Pterygoid muscle invasion | |||
| Absent | 7 (100%) | 22 (91.7%) | |
| Present | 0 (0%) | 2 (8.3%) | 1.000 |
| Parapharyngeal space invasion | |||
| Absent | 7 (100%) | 16 (66.7%) | |
| Present | 0 (0%) | 8 (33.3%) | 0.146 |
| Internal jugular invasion | |||
| Absent | 7 (100%) | 20 (83.3%) | |
| Present | 0 (0%) | 4 (16.7%) | 0.550 |
| Petrous apex invasion | |||
| Absent | 7 (100%) | 19 (79.2%) | |
| Present | 0 (0%) | 5 (20.8%) | 0.562 |
| Facial nerve palsy | |||
| Absent | 7 (100%) | 21 (87.5%) | |
| Present | 0 (0%) | 3 (12.5%) | 1.000 |
| Common carotid artery | |||
| Absent | 7 (100) | 20 (83.3%) | |
| Present | 0 (0%) | 4 (16.7%) | 0.550 |
| Middle cranial fossa invasion | |||
| Absent | 7 (100%) | 15 (62.5%) | |
| Present | 0 (0%) | 9 (37.5%) | 0.0766 |
| Posterior cranial fossa invasion | |||
| Absent | 4 (80.0%) | 22 (84.6%) | |
| Present | 1 (20.0%) | 4 (15.4%) | 1.000 |
| Recurrence | |||
| Free | 7 (100%) | 8 (57.1%) | |
| Recurrence | 0 (0%) | 6 (42.9%) | 0.0609 |
| Effect of therapy | |||
| Grade 0–2 | 1 (20%) | 10 (76.9%) | |
| Grade 3 | 4 (80%) | 3 (23.1%) | 0.0474* |
P-value: student t-test for a continuous variable, Fisher’s exact test for nominal variables, and the Wilcoxon test for ordinal categorical variables
*P < 0.05
Agreement in Tumor Grading Based on PDCs
Interobserver agreement in tumor grading was good (κ = 0.888) in the evaluation of PDCs using CK AE1/AE3 immunostaining.
Patient Survival
The high-grade PDCs group had significantly shorter survival times (P = 0.0317; Fig. 2a). All six cases with high-grade tumor budding also belonged to the high-grade PDCs group (Fig. 2b). Since the cases with low budding grade (25 cases) could be separated into low- (seven cases) and high- (18 cases) grade PDCs (Fig. 2b), survival times were compared between these two groups; high-grade PDCs were found to have a significantly shorter survival time (P = 0.0494; Fig. 2c). On the other hand, high tumor budding grade had shorter survival times than low tumor budding grade, but the difference was not statistically significant (P = 0.0805, Fig. 2d).
Fig. 2.
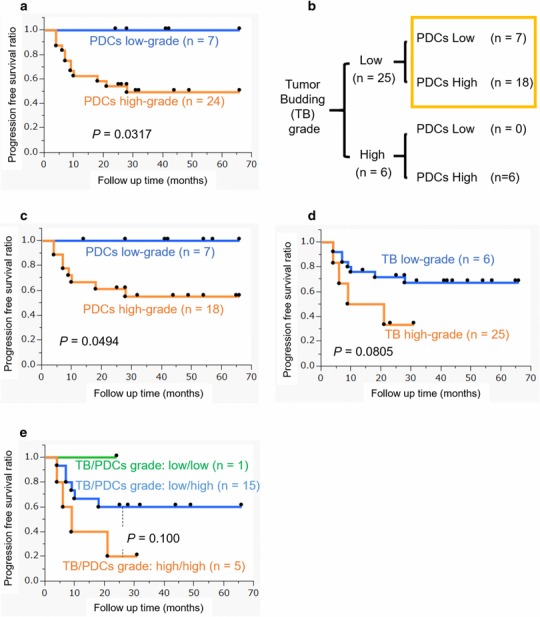
Patient survival data analyses (a–d) and the categories for budding and poorly differentiated clusters (PDCs) grades (b) in this study: a The patient group with high-grade PDCs had significantly shorter survival times (P = 0.0317). b Six cases with high-grade tumor budding were included in the high-grade poorly differentiated clusters (PDCs) group. Low- and high-grade PDCs were also compared with 25 cases of low-grade tumor budding. c Low- and high-grade PDCs were also compared with 25 cases of low-grade tumor budding. High-grade PDCs had significantly shorter survival times (P = 0.0494). d The patient group with high-grade tumor budding had shorter survival times than that with low-grade tumor budding; the difference was not statistically significant (P = 0.0805). e Low- and high-grade poorly differentiated clusters (PDCs) were compared with 16 advanced cases (stage III and IV) with low-grade tumor budding. Any observed differences were not statistically significant, but patients with more favorable prognoses could be selected
Univariate and multivariate analyses of clinicopathological predictors of progression-free survival (PFS) in these SCC-EAC cases were performed. Results indicated that poorly differentiated type and high PDCs grade predicted poorer PFS in the univariate analysis (P = 0.0188, 0.0317, respectively; Table 3). High PDCs grade was an independent prognostic factor for shorter PFS by multivariate analysis (P = 0.0046, Table 3).
Table 3.
Univariate and multivariate analysis of factors affecting progression-free survival (PFS)
| Variable | Univariate analysis | Multivariate analysis | ||||
|---|---|---|---|---|---|---|
| Hazard ratioa | 95% Clb | P-valueb | Hazard ratioa | 95% Cla | P-valuea | |
| Age ≧ 70 years | 1.78 | 0.525–5.57 | 0.313 | 4.19 | 0.970–18.2 | 0.0547 |
| Gender (female) | 1.37 | 0.427–4.37 | 0.582 | 1.12 | 0.303–4.00 | 0.861 |
| Poorly differentiated type | 4.23 | 0.922–14.7 | 0.0188 | 1.73 | 0.365–6.40 | 0.454 |
| Tumor budding high grade | 2.77 | 0.733–8.92 | 0.0805 | 2.71 | 0.639–10.5 | 0.166 |
| PDCs high gradec | 2.24 × e9 | 2.15– | 0.0317 | 1.74 × e9 | 2.60–1.68 × e20 | 0.0046 |
PDCs poorly differentiated clusters
aEstimated using Cox regression based on likelihood ratio test
bLog-rank test
cUpper limited CI and hazard ratios were large figures and could not be estimated appropriately/numerically, because there were no fatal cases in low grade PDC
Discussion
PDCs can be used to indicate prognostic subdivisions for SCC-EAC. Cases with high-grade PDCs showed significantly poorer prognosis. Multivariate analysis results indicated that high-grade PDCs were an independent poor prognostic factor.
In the present study, the number of low-grade tumor budding cases was 25 (80.6%) out of 31 cases in the cohort. Because this group also contained some poor prognostic cases, we searched for a new prognostic indicator. PDCs subdivided these cases into low-grade and high-grade PDCs cases; the high-grade PDCs had a significantly shorter PFS. The patients with both low-grade tumor budding and low-grade PDCs had significantly longer survival, with no progression during the follow up time (Fig. 2c). All these cases revealed no lymph node metastasis, distant metastasis, or invasion of the parotid gland, temporomandibular joint, otic capsule, pterygoid muscle, parapharyngeal space, internal jugular vein, petrous apex, facial nerve, common carotid artery, and middle cranial fossa (Table 2). We previously reported that low tumor budding grade enabled us to sort patient groups into those with a better prognosis, even in cases of advanced stage disease (stage III and IV). Thus, we examined whether PDCs could be used to further subdivide the advanced stage patient group with low tumor budding grade into those with low- and high-grade PDCs; differences were not statistically significant, but those patients with a more favorable prognosis could be selected (Fig. 2e). PDCs can be a more sensitive and useful prognostic factor for SCC-EAC than tumor budding, although both are significant prognostic factors. Particularly with low-grade budding, PDCs grade can separate prognoses with greater precision, although both PDCs and tumor budding are significant prognostic factors for SCC-EAC. Figure 3 demonstrates the association between budding and PDCs grade using simple illustrations. Figure 3a highlights the cases with both a high budding grade and high-grade PDCs. In the present study, our cohort included many cases with both a low budding grade and high-grade PDCs (Figs. 3b, 1e–f) and we demonstrated the importance of evaluating both types.
Fig. 3.
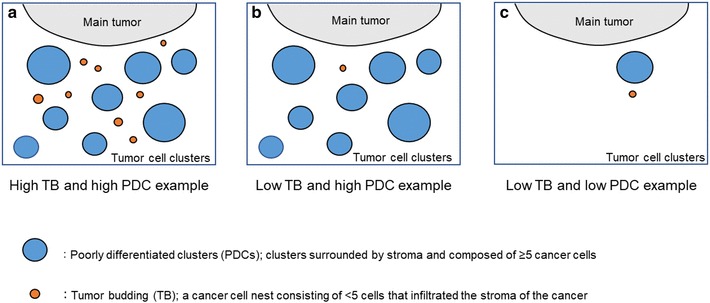
Illustrations of poorly differentiated clusters (PDCs) and budding grade: a an example of high-grade budding and high-grade PDCs. PDCs are shown in blue. Tumor budding is shown in orange. b An example of low-grade budding and high-grade PDCs. c An example of low-grade budding and low-grade PDCs
Patterns of cancer cell invasion include single-cell migration, multicellular streaming, collective cell migration, tissue folding, and expansive growth [21]. Collective cell migration occurs when two or more cells that retain their cell–cell junctions move together through a three-dimensional interstitial tissue scaffold [22–26]. Strong cell–cell junctions allow direct force transmission between cells and facilitate supracellular coordination of the cytoskeleton to maintain cohesion and collective invasion [21, 27, 28]. Collective cell migration takes place either when cell movement remains connected to the primary tumor or when cells detach in groups or clusters [29–31]. We surmised that PDCs may be associated with collective cell migration. A previous report, based on electron microscopy and immunohistochemistry, demonstrates that tumor budding in isolation in one plane of a section can be traced to the neighboring neoplasm at the invasive margin [32]. Furthermore, tumor budding and PDCs may form a sequential structure. The ability to evaluate morphological features associated with prognosis in one tissue section is simple and effective. Therefore, the observation of PDCs may allow such prognoses to be applied in a clinical setting.
As for the invasive mechanisms of PDCs, we statistically analyzed the association between PDCs and laminin 5-γ2 because laminin 5-γ2 was associated with tumor budding in our previous report [16]. However, no association was found with these indicators (data not shown).
Associations between morphological tumor grading and prognoses have been investigated in the field of head and neck SCC. Broder’s system is based on the proportion of differentiated cells to undifferentiated or anaplastic cells [33–35], and this classification has been used in evaluation of prognosis and choice of treatment. A grading system concerning the histologic relationship of the neoplasm to the surrounding host tissue was developed for laryngeal carcinoma [36]. PDCs rate similarly to grade 2 (cords, less marked borderline) or grade 3 (groups of cells; no distinct borderline) in the latter manuscript in mode of invasion. Moreover, the grading system is modified for application with oral squamous cell carcinoma [37]. PDCs may correspond predominantly to score 2 (infiltrating, solid cords, bands and/or strands) or score 3 [small groups or cords of infiltrating cells (n > 15)] in patterns of invasion in the grading system. These grading systems are associated with poor prognosis [38]. The category of having a cohesive or non-cohesive invasive edge of auricular squamous cell carcinoma has also been reported as a prognostic factor for the development of lymph node metastasis [39]. Compared with these grading systems, the evaluation methods for tumor budding or PDCs is more concrete and simple. More recently, tumor budding activity (BA) and cell nest size (CNS) have been shown to determine patient outcome in oral SCC [40]. The latter authors proposed a grading system by combining both a score for BA and one for CNS. CNS was classified based on the size of the smallest invasive cell nest, which is quite different from the evaluation method for PDCs in our study. In evaluations for PDCs, the number of invading tumor cell nests composed of ≥ 5 cells was evaluated even in the presence of single invading cells. It is suggested that the evaluation of PDCs is simpler and easier and is significantly correlated with prognosis in SCC-EAC.
Reproducibility is important for evaluation methods regarding the mode of invasion described above. We compared the agreement coefficient of the evaluation methods based on past reports. Broder’s system does not give a stable agreement (κ coefficient: 0.38–0.69) [41]. A modification of Jakobbson’s malignancy grading system was created for use with carcinoma of the uterine cervix. Agreement of this grading system is also poor (κ coefficient: 0.54) [42]. The grading system for the invasive parts of oral SCC as defined by Bryne et al. has good interobserver agreement (κ coefficient: 0.63) [37], although its initial agreement had a low value (κ coefficient: 0.44) [43]. Compared to these evaluation methods regarding the invasive morphology of tumors, the agreement of the evaluation of tumor budding using IHC is high (κ coefficient: 0.874) [44]. The κ coefficient for interobserver agreement of tumor grading based on PDCs may be as high as 0.735 [45]. In the present study, interobserver agreement in PDCs grading was excellent (κ = 0.888) when using IHC for CK AE1/AE3. Thus, the grading of PDCs in SCC-EAC biopsies by using CK AE1/AE3 can offer improved objectivity and higher reproducibility.
This study was not free of limitations. Due to the rarity of SCC-EAC the analyzed sample included only 31 cases. Surgical specimens were not available for our use because preoperative chemoradiotherapy is necessary in external auditory canal carcinoma patients. For the study, we had access to only a limited number of pretreatment biopsy samples; these were small in size and collected from the narrow site of the external auditory canal. Greater reliability would be achieved from the study of a greater number of biopsy samples. Despite these limitations, this study had two noteworthy strengths. Firstly, the study was solely conducted by one surgeon, T. Nakagawa, and thus eliminated bias due to operational procedure. Secondly, histopathological findings from pretreatment biopsy samples were associated with prognoses in SCC-EAC.
In conclusion, high-grade PDCs in biopsy sample were an independent poor prognostic factor for SCC of the EAC. PDCs grade can provide a more accurate prognosis than budding grade, and can be an indicator that allows subdivision of prognosis in SCC-EAC.
Acknowledgements
The authors would like to thank Ms. M. Onitsuka for her excellent technical assistance with immunohistochemistry. This work was supported in part by grants from Culture, Sports, Scientific Research from the Ministry of Education, Advanced Molecular Medicine, Fukuoka University.
Funding
Research Center for Advanced Molecular Medicine, Fukuoka University.
Conflict of interest
The authors declare that they have no conflict of interest.
Ethical Approval
All procedures performed in studies involving human participants were in accordance with the Institutional Review Board (The Ethics Committee) of Fukuoka University (No. 12-7-13) Hospital.
Informed Consent
Informed consent was obtained from all patients in this study.
References
- 1.Alvord LS, Farmer BL. Anatomy and orientation of human external ear. J Am Acad Audiol. 1997;8:383–390. [PubMed] [Google Scholar]
- 2.Burnett CH. The ear: its anatomy, physiology, and diseases. Philadelphia: Hard Press Publishing; 1884. [Google Scholar]
- 3.Litton WB. Epidermal migration in the ear: the location and characteristics of the generati center revealed by utilizing a radioactive desoxyribose nucleic acid precursor. Acta Otolaryngol. 1968;Suppl 240:5+. [PubMed] [Google Scholar]
- 4.Makino K, Amatsu M. Epithelial migration on the tymapanic membrane and external canal. Arch Otorhinolaryngol. 1986;243:39–42. doi: 10.1007/BF00457906. [DOI] [PubMed] [Google Scholar]
- 5.Jackler RK, Driscoll CLW. Tumors of the ear and temporal bone. Philadelphia: Lippincott Williams & Wilkins; 2000. [Google Scholar]
- 6.Morton RP, Stell PM, Derrick PP. Epidemiology of cancer of the middle ear cleft. Cancer. 1984;53:1612–1617. doi: 10.1002/1097-0142(19840401)53:7<1612::AID-CNCR2820530733>3.0.CO;2-P. [DOI] [PubMed] [Google Scholar]
- 7.Higgins TS, Antonio SA. The role of facial palsy in staging squamous cell carcinoma of the temporal bone and external auditory canal: a comparative survival analysis. Otol Neurotol. 2010;31:1473–1479. doi: 10.1097/MAO.0b013e3181f7ab85. [DOI] [PubMed] [Google Scholar]
- 8.Prasad SC, D’Orazio F, Medina M, et al. State of the art in temporal bone malignancies. Curr Opin Otolaryngol Head Neck Surg. 2014;22:154–165. doi: 10.1097/MOO.0000000000000035. [DOI] [PubMed] [Google Scholar]
- 9.Moody SA, Hirsch BE, Myers EN. Squamous cell carcinoma of the external auditory canal: an evaluation of a staging system. Am J Otol. 2000;21:582–588. [PubMed] [Google Scholar]
- 10.Marioni G, Zanoletti E, Stritoni P, et al. Expression of the tumour-suppressor maspin in temporal bone carcinoma. Histopathology. 2013;63:242–249. doi: 10.1111/his.12151. [DOI] [PubMed] [Google Scholar]
- 11.Anneroth G, Batsakis J, Luna M. Review of the literature and a recommended system of malignancy grading in oral squamous cell carcinomas. Scand J Dent Res. 1987;95:229–249. doi: 10.1111/j.1600-0722.1987.tb01836.x. [DOI] [PubMed] [Google Scholar]
- 12.Bryne M, Boysen M, Alfsen CG, et al. The invasive front of carcinomas. The most important area for tumour prognosis? Anticancer Res. 1998;18:4757–4764. [PubMed] [Google Scholar]
- 13.Almangush A, Salo T, Hangstrom J, et al. Tumor budding in head and neck squamous cell carcinoma-a systematic review. Histopathology. 2014;65:587–594. doi: 10.1111/his.12471. [DOI] [PubMed] [Google Scholar]
- 14.Ueno H, Kajiwara Y, Shimazaki H, et al. New criteria for histologic grading of colorectal cancer. Am J Surg Pathol. 2012;36:193–201. doi: 10.1097/PAS.0b013e318235edee. [DOI] [PubMed] [Google Scholar]
- 15.Sun Y, Liang F, Cao W, et al. Prognostic value of poorly differentiated clusters in invasive breast cancer. World J Surg Oncol. 2014;12:310. doi: 10.1186/1477-7819-12-310. [DOI] [PMC free article] [PubMed] [Google Scholar]
- 16.Okado Y, Aoki M, Hamasaki M, et al. Tumor budding and laminin 5-gamma 2 in squamous cell carcinoma of the external auditory canal are associated with shorter survival. SpringerPlus. 2015;4:814. doi: 10.1186/s40064-015-1620-4. [DOI] [PMC free article] [PubMed] [Google Scholar]
- 17.Nakagawa T, Kumamoto Y, Natori Y, et al. Squamous cell carcinoma of the external auditory canal and middle ear: an operation combined with preoperative chemoradiotherapy and a free surgical margin. Otol Neurotol. 2006;27:242–248. doi: 10.1097/01.mao.0000190463.88873.3d. [DOI] [PubMed] [Google Scholar]
- 18.Cancer JSfHaN . General rules for clinical studies on head and neck cancer. 5. Tokyo: Kanehara; 2012. [Google Scholar]
- 19.Satoh K, Nimura S, Aoki M, et al. Tumor budding in colorectal carcinoma assessed by cytokeratin immunostaining and budding areas: possible involvement of c-Met. Cancer Sci. 2014;105:1487–1495. doi: 10.1111/cas.12530. [DOI] [PMC free article] [PubMed] [Google Scholar]
- 20.Rectum JSfCotCA . Japanese classification of colorectal carcinoma. 8. Tokyo: Kanehara; 2013. [Google Scholar]
- 21.Friedl P, Locker J, Sahai E, et al. Classifying collective cancer cell invasion. Nat Cell Biol. 2012;10:445–457. doi: 10.1038/nrm2720. [DOI] [PubMed] [Google Scholar]
- 22.Friedl P, Gilmour D. Collective cell migration in morphogenesis, regeneration and cancer. Nat Rev Mol Cel Biol. 2009;10:445–457. doi: 10.1038/nrm2720. [DOI] [PubMed] [Google Scholar]
- 23.Friedl P. Prespecification and plasticity: shifting mechanisms of cell migration. Curr Opin Cell Biol. 2004;16:14–23. doi: 10.1016/j.ceb.2003.11.001. [DOI] [PubMed] [Google Scholar]
- 24.Lecaudey V, Gilmour D. Organizing moving groups during morphogenesis. Curr Opin Cell Biol. 2006;18:102–107. doi: 10.1016/j.ceb.2005.12.001. [DOI] [PubMed] [Google Scholar]
- 25.Rorth P. Collective guidance of collective cell migration. Trends Cell Biol. 2007;17:575–579. doi: 10.1016/j.tcb.2007.09.007. [DOI] [PubMed] [Google Scholar]
- 26.Ilina O, Friedl P. Mechanisms of collective cell migration at a glance. J Cell Sci. 2009;122:3203–3208. doi: 10.1242/jcs.036525. [DOI] [PubMed] [Google Scholar]
- 27.Hegerfeldt Y, Tusch M, Brocker EB, et al. Collective cell movement in primary melanoma explants: plasticity of cell-cell interaction, beta1-integrin function, and migration strategies. Cancer Res. 2002;62:2125–2130. [PubMed] [Google Scholar]
- 28.Ewald AJ, Huebner RJ, Palsdottir H, et al. Mammary collective cell migration involves transient loss of epithelial features and individual cell migration within the epithelium. J Cell Sci. 2012;125:2638–2654. doi: 10.1242/jcs.096875. [DOI] [PMC free article] [PubMed] [Google Scholar]
- 29.Farooqui R, Fenteany G. Multiple rows of cells behind an epithelial wound edge extend cryptic lamellipodia to collectively drive cell-sheet movement. J Cell Sci. 2005;118:51–63. doi: 10.1242/jcs.01577. [DOI] [PubMed] [Google Scholar]
- 30.Friedl P, Noble PB, Walton PA, et al. Migration of coordinated cell clusters in mesenchymal and epithelial cancer explants in vitro. Cancer Res. 1995;55:4557–4560. [PubMed] [Google Scholar]
- 31.Wolf K, Friedl P. Molecular mechanisms of cancer cell invasion and plasticity. Br J Dermatol. 2006;154(Suppl 1):11–15. doi: 10.1111/j.1365-2133.2006.07231.x. [DOI] [PubMed] [Google Scholar]
- 32.Prall F, Ostwald T, Linnebacher M. Tubular invasion and the morphogenesis of tumor budding in colorectal carcinoma. Hum Pathol. 2009;40:1510–1512. doi: 10.1016/j.humpath.2009.06.015. [DOI] [PubMed] [Google Scholar]
- 33.Broders AC. Squamous cell epithelioma of the lip. J Am Med Assoc. 1920;74:656–664. doi: 10.1001/jama.1920.02620100016007. [DOI] [Google Scholar]
- 34.Broders AC. Carcinoma of the mouth: types and degrees of malignancy. Ann J Roentgenol Rad Ther Nucl Med. 1927;17:90–93. [Google Scholar]
- 35.Broders AC. The microscopic grading of cancer. Surg Clin N Am. 1941;21:947–962. [Google Scholar]
- 36.Jakobsson PA, Eneroth CM, Killander D, et al. Histologic classification and grading of malignancy in carcinoma of the larynx. Acta Radiol Ther Phys Biol. 1973;12:1–8. doi: 10.3109/02841867309131085. [DOI] [PubMed] [Google Scholar]
- 37.Bryne M, Koppang HS, Lilleng R, et al. Malignancy grading of the deep invasive margins of oral squamous cell carcinomas has high prognostic value. J Pathol. 1992;166:375–381. doi: 10.1002/path.1711660409. [DOI] [PubMed] [Google Scholar]
- 38.Bryne M, Koppang HS, Lilleng R, et al. New malignancy grading is a better prognostic indicator than Broders’ grading in oral squamous cell carcinomas. J Oral Pathol Med. 1989;18:432–437. doi: 10.1111/j.1600-0714.1989.tb01339.x. [DOI] [PubMed] [Google Scholar]
- 39.Clark RR, Soutar DS, Hunter KD. A retrospective analysis of histological prognostic factors for the development of lymph node metastases from auricular squamous cell carcinoma. Histopathology. 2010;57:138–146. doi: 10.1111/j.1365-2559.2010.03593.x. [DOI] [PubMed] [Google Scholar]
- 40.Boxberg M, Jesinghaus M, Dorfner C, et al. Tumour budding activity and cell nest size determine patient outcome in oral squamous carcinoma: proposal for an adjusted grading system. Histopathology. 2017;70:1125–1137. doi: 10.1111/his.13173. [DOI] [PubMed] [Google Scholar]
- 41.Gunia S, Burger M, Hakenberg OW, et al. Inherent grading characteristics of individual pathologists contribute to clinically and prognostically relevant interobserver discordance concerning Broaders’ grading of penile squamous cell carcinomas. Urol Int. 2013;90:207–213. doi: 10.1159/000342639. [DOI] [PubMed] [Google Scholar]
- 42.Stendahl U, Willen H, Willen R. Invasive squamous cell carcinoma of the uterine cervix. II. Reproducibility of a histopathologic malignancy grading system. Acta Radiol Oncol. 1981;20:65–70. doi: 10.3109/02841868109130422. [DOI] [PubMed] [Google Scholar]
- 43.Bryne M, Nielsen K, Koppang HS, et al. Reproducibility of two malignancy grading systems with reportedly prognostic value for oral cancer patients. J Oral Pathol Med. 1991;20:369–372. doi: 10.1111/j.1600-0714.1991.tb00946.x. [DOI] [PubMed] [Google Scholar]
- 44.Prall F, Nizze H, Barten M. Tumor budding as prognostic factor in stage I/II colorectal carcinoma. Histopathology. 2005;47:17–24. doi: 10.1111/j.1365-2559.2005.02161.x. [DOI] [PubMed] [Google Scholar]
- 45.Barresi V, Bonetti LR, Ieni A, et al. Histologic grading based on counting poorly differentiated clusters in preoperative biopsy predicts nodal involvement and pTNM stage in colorectal cancer patients. Hum Pathol. 2014;45:268–275. doi: 10.1016/j.humpath.2013.07.046. [DOI] [PubMed] [Google Scholar]