Abstract
Although refractory high entropy alloys (RHEAs) have shown potentials to be developed as structural materials for elevated temperature applications, most of the reported oxidation behaviours of RHEA were associated with short term exposures for only up to 48 hours, and there is a lack of understanding on the oxidation mechanism of any RHEA to-date. In this work, by using thermogravimetric analysis, isothermal oxidation was conducted on a novel RHEA at 1000 °C and 1100 °C for up to 200 hours, which is an unprecedented testing duration. The external oxide layer strongly influenced the weight gain behaviours, and it consisted of CrTaO4-based oxide with some dispersion of Al2O3 and Cr2O3. At 1000 °C, the inability to form dense CrTaO4-based oxide layer resulted an exponential dependence of weight gain throughout 200 hours. At 1100 °C, mass gain curve showed two parabolic dependences associated with the formation of protective CrTaO4-based oxide layer and the weight gain after 200 hours was 4.03 mg/cm2, which indicates that it is one of the most oxidation resistant RHEAs comparing to literature data to-date. This work can also provide insights on how to further develop RHEA to withstand long term oxidation at elevated temperatures.
Subject terms: Metals and alloys, Corrosion
Introduction
As the temperature capability of modern Ni- based superalloys has reached its limit for gas turbine engine applications, materials scientists are searching for new materials with higher temperature capabilities. Recently, “High-Entropy Alloy (HEA)”1,2 has been proposed as a new strategy for alloy design with a wide composition space. Other names such as “compositionally complex alloys (CCAs)” has also been given to this class of alloy containing multiple phases3. Nevertheless, the alloy design strategy of HEA/CCA shows great promise for exploring new alloy systems. RHEA was first proposed by Senkov et al.4 as an attempt to create new alloy systems for high temperature applications beyond superalloys. By combining refractory elements such as W, Mo, Ta, Nb, Hf, …etc. in equi- or near equi-molar ratios, several RHEAs with promising mechanical properties have been reported5–7. However, oxidation resistance is crucial since it could lead to severe degradation in mechanical properties. For high temperature applications, formation of Al2O38, Cr2O39, or SiO210 layer can provide oxidation resistance since these oxides are thermodynamically stable and exhibit low oxygen permeability. To the best of authors’ knowledge, there are only a few articles addressing the oxidation behaviours of Al, Cr, or Si-bearing RHEAs/RCCAs: Oxidation of CrMo0.5NbTa0.5TiZr alloy was firstly reported by Senkov et al.11, which showed severe spallation of oxide layer and about 120 mg/cm2 of mass gain after 100 hours of oxidation at 1000 °C. Gorr et al.12,13 reported the oxidation behaviour of AlCrMoTiW, AlCrMoNbTi, and (AlCrMoNbTi)0.99Si0.01 alloys. For AlCrMoTiW, despite no formation of continuous oxide layer on a sample surface was observed, the mass gain curve showed parabolic dependence, and approximately 7.9 mg/cm2 of mass gain was reported after 40 hours of oxidation at 1000 °C. AlCrMoNbTi possessed slightly less oxidation resistance than that of AlCrMoTiW, exhibiting oxidation mass gains of 9.2 and 8.3 mg/cm2 at 1000 and 1100 °C, respectively. (AlCrMoNbTi)0.99Si0.01 exhibited 5.4 and 6.4 mg/cm2 of mass gain at 1000 and 1100 °C after 48 hours of oxidation, respectively. The most recent study on the oxidation behaviour of AlCrMoTaTi reported by Gorr et al.14 indicated a mass gain after 48 hours of oxidation at 1000 and 1100 °C was less than 1 and 3 mg/cm2, respectively; this extremely low mass gain at 1000 °C was claimed to be due to formation of Al2O3 layer on the alloy surface, however, the associated oxidation mechanism was not clear since there was no detailed microstructure characterization. Furthermore, these previous oxidation studies were conducted for only up to 48 hours, and there was no indication whether this Al2O3 layer could still be effective after a longer exposure. In this work, oxidation behaviours of a novel RHEA “NV1” have been studied at 1000 and 1100 °C, with an unprecedented testing duration of 200 hours. Such oxidation study for RHEA can provide valuable information on the long-term oxidation behaviours of this class of alloy and how to improve it further.
Results
Pre-oxidation microstructure
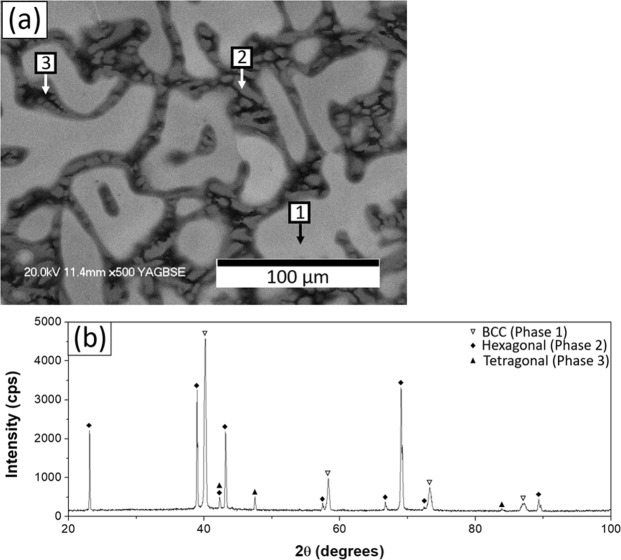
The as-cast microstructure of NV1 had dendrites and contained several phases; back-scattered electron image (BEI) and the chemical composition of the observed phases are shown in Fig. 1(a) and Table 1, respectively. The dendrite core (Fig. 1(a), phase No. 1) was rich in Mo, and interdendritic regions contained Cr-rich phase (Fig. 1(a), phase No. 2) and Al-rich phase (Fig. 1(a), phase No. 3). In addition, it was found that Ti strongly segregated to Al-rich phase, while Si strongly segregated to Cr-rich phase.
Figure 1.
(a) BEI, (b) XRD pattern of the as-cast NV1 alloy.
Table 1.
Chemical composition (in at%) of as-cast NV1 alloy bulk and individual phases in Fig. 1(a).
| ID# | Al | Si | Ti | Cr | Nb | Mo | Ta |
|---|---|---|---|---|---|---|---|
| Bulk* | 17.6 ± 0.3 | 2.9 ± 0.8 | 5.4 ± 0.3 | 25.2 ± 0.8 | 15.2 ± 0.0 | 20.3 ± 1.2 | 13.4 ± 0.9 |
| 1 | 15.4 ± 0.2 | 1.1 ± 0.0 | 4.6 ± 0.1 | 19.4 ± 0.2 | 14.9 ± 0.1 | 25.7 ± 0.3 | 18.9 ± 0.3 |
| 2 | 13.2 ± 0.2 | 8.4 ± 0.2 | 3.1 ± 0.1 | 40.2 ± 0.0 | 13.5 ± 0.1 | 7.8 ± 0.1 | 13.8 ± 0.2 |
| 3 | 29.6 ± 0.8 | 0.6 ± 0.1 | 15.8 ± 0.9 | 16.6 ± 0.5 | 13.2 ± 0.1 | 20.4 ± 1.8 | 3.8 ± 0.4 |
*Determined with X-ray fluorescence (XRF).
The XRD analysis is shown in Fig. 1(b); there are three phases present, i.e. BCC, Tetragonal, and Hexagonal phases. Image analysis was utilized to estimate fractions of each phase in Fig. 1(a). Mo-rich phase (dendrite core) had the highest volume fraction (65.44%), followed by Cr-rich phase (29.84%) and Al-rich phase (4.72%). Therefore, Phase 1 can be identified as Mo-rich BCC solid-solutioned phase with a lattice constant of 3.167 Å, which was 0.80% larger than that of pure Mo (3.142 Å)15. By correlating fractions of phases with the associated peak intensities, Cr-rich phase could be identified as the hexagonal Phase 2, and Al-rich phase was the tetragonal Phase 3.
Oxidation behaviour at 1000 °C
The oxidation mass gain curve of NV1 alloy at 1000 °C is shown in Fig. 2. After 200 hours of oxidation, the mass gain was 6.53 mg/cm2. The mass gain curve showed exponential dependence throughout the entire testing duration, and such dependence can be described by Eq. (1) below, where Δm is the mass gain per initial surface area (mg/cm2) and t is the time elapsed (hours).
| 1 |
Figure 2.
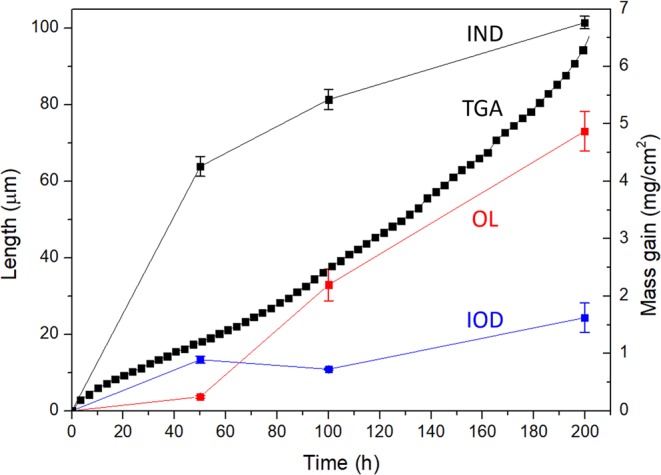
The oxidation mass gain (TGA curve) and length of OL, IOD, and IND at 1000 °C up to 200 hours. The error bars represented deviation from repeated measurements.
XRD analysis on the oxidised sample surface revealed 3 different oxides existing in the oxide layer (Fig. 3): CrTaO4, Al2O3, and Cr2O3. Shifted peaks from CrTaO4 showed the highest intensity among all the observed peaks, indicating the main component of the oxide layer was CrTaO4-based. The detected CrTaO4-based oxide had lattice constants of a = 4.625 Å and c = 3.007 Å that were 0.37% less in a axis and 0.43% less in c axis comparing to those of pure CrTaO4 (a = 4.642 Å, c = 3.020 Å provided by PDF No. 39–1428).
Figure 3.
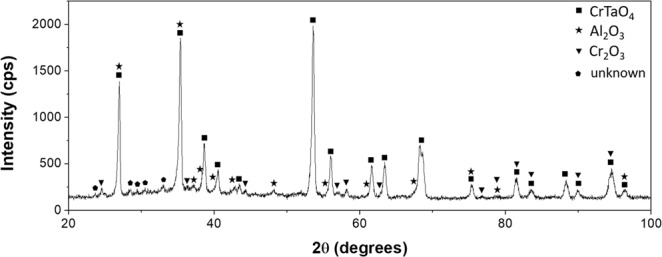
XRD pattern after 200 hours oxidation at 1000 °C.
Cross-sectional microstructures and energy- dispersive X-ray spectroscopy (EDS) mapping of the oxide layer after 1, 50, 100, and 200 hours of oxidation are shown in Fig. 4. There were 4 different regions identified in the cross-sectional microstructure, i.e. oxide layer (OL), internal oxidation depth (IOD), internal nitridation depth (IND) and substrate. According to EDS mapping, neither continuous Al2O3 nor Cr2O3 layer was found on the alloy surface after 200 hours of oxidation at 1000 °C. Instead, Al segregated near the top surface, while Cr distribution was almost uniform in the OL. The major component of the OL was CrTaO4 (Fig. 4(d) and Table 2, region A), and such a layer was apparently porous (Fig. 4(c,d), marked by red arrowheads). Furthermore, Al2O3 was dispersed within the IOD, and TiN were found within the IND (Fig. 4(d) and Table 2, region B). The size of TiN particles was around 1.5 μm, and they mainly formed in the dendrite regions.
Figure 4.

Cross-sectional BEI of the oxide layers after (a) 1 (b) 50 (c) 100 (d) 200 hours of oxidation at 1000 °C (grey scale image) and EDS mapping results of the selected region (color-coded images). 1, 2, 3, 4 respectively represent “OL”, “IOD”, “IND”, and “substrate”. The enlarged image in (d) showed the details of a TiN particle.
Table 2.
Chemical composition (in at %) of regions shown in Fig. 4(d).
| ID# | N | O | Al | Si | Ti | Cr | Nb | Mo | Ta |
|---|---|---|---|---|---|---|---|---|---|
| A | — | 69.0 ± 0.5 | 4.0 ± 0.8 | 0.2 ± 0.0 | 2.2 ± 0.3 | 10.8 ± 1.2 | 5.7 ± 0.6 | 1.1 ± 0.3 | 7.2 ± 0.1 |
| B* | 30.5 ± 3.6 | 6.9 ± 0.0 | 1.9 ± 0.0 | 1.1 ± 0.3 | 57.0 ± 2.7 | 0.7 ± 0.1 | 0.9 ± 0.3 | 0.7 ± 0.2 | 0.3 ± 0.1 |
*Determined with transmission electron microscope (TEM)-EDS.
Figure 2 shows the length of OL, IOD, and IND versus time with the corresponding oxidation weight gain at 1000 °C. Both OL and IND length increased significantly during the oxidation, while IOD length increment was moderate. This analysis indicates that exponential oxidation weight gain behaviour at 1000 °C was mainly attributed by a steady increase in the oxide layer formed externally and the nitridation depth.
Oxidation behaviour at 1100 °C
The oxidation mass gain curve of NV1 alloy at 1100 °C is shown in Fig. 5. It should be noted that, after 200 hours of oxidation, the mass gain per initial surface area was 4.03 mg/cm2, which was less than that of 1000 °C (6.53 mg/cm2). Three stages of mass gain dependence were identified from the oxidation mass gain curve, and they can be described by Eqs (2), (3) and (4), corresponding to Stage I, Stage II, and Stage III, respectively.
| 2 |
| 3 |
| 4 |
Figure 5.
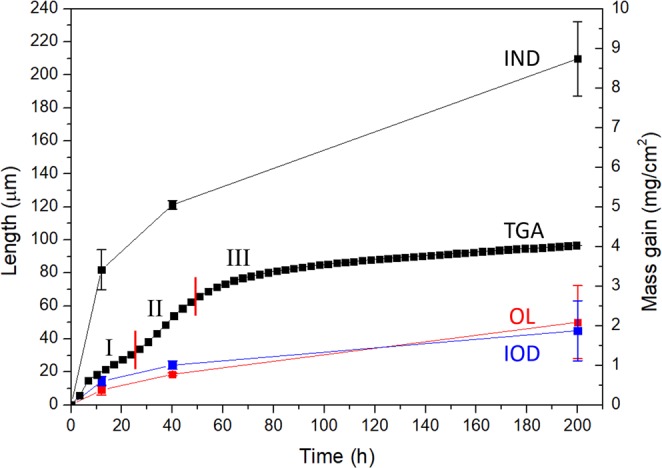
The oxidation mass gain (TGA curve) and length of OL, IOD, and IND at 1100 °C up to 200 hours. The error bars represented deviation from repeated measurements.
To understand the oxidation behaviour for different stages of mass gain dependence at 1100 °C for 200 hours, oxidised microstructures were characterized at the following intervals, i.e. 1, 12, 40, and 200 hours that respectively represented oxidation within the initial stage, Stage I, Stage II and Stage III. XRD patterns of the oxidised samples after each oxidation duration are shown in Fig. 6. The identified phases were identical to those obtained at 1000 °C (Fig. 3), and CrTaO4-based oxide was the major component of the oxide layer. The CrTaO4-based oxide detected after 200 hours of oxidation had lattice constants of a = 4.630 Å and c = 2.997 Å, which were 0.26% less in a axis and 0.76% less in c axis comparing to that of pure CrTaO4. The peaks from the substrate (BCC (Phase 1), Hexagonal (Phase 2), and Tetragonal (Phase 3) in Fig. 6) were visible after 1 hour of oxidation, then disappeared when the sample was oxidised for more than 12 hours.
Figure 6.
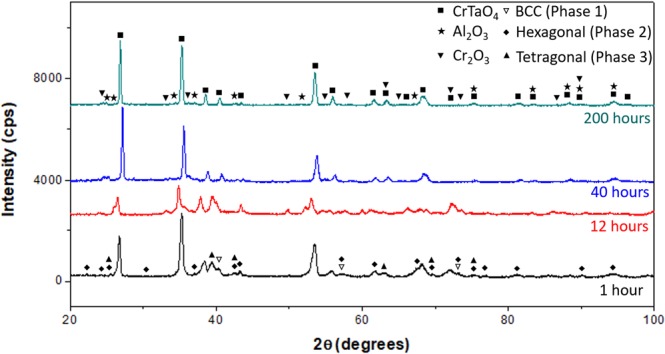
XRD patterns of NV1 alloy after oxidation at 1100 °C.
After 1 hour of oxidation (Fig. 7(a)), the Al enrichment at some surface regions could be seen (Fig. 7(a), marked by a white arrowhead), while Cr and Ti distributed rather uniformly within the oxide layer. After 12 hours of oxidation (Fig. 7(b)), the external oxidation became more pronounced, and a 2 μm thick (Al, Cr)-depleted but Mo-rich zone was located at OL/IOD interface (Fig. 7(b) and Table 3, region A. The enrichment of Mo was marked by a green arrowhead in the line-scan result). After 40 hours of oxidation (Fig. 7(c)), (Al, Cr)-depleted but Mo-rich zone was significantly thickened (Fig. 7(c) and Table 3, region B. The Mo enrichment was marked by a green arrowhead in line-scan result), and laminar Al and Cr distribution in the OL became obvious (Fig. 7(c), marked by white arrowheads). In addition, relatively high Ti concentration was observed at the discrete surface areas and (Al, Cr)-depleted zone (Fig. 7(c), marked by yellow arrowheads). After 200 hours of oxidation (Fig. 7(d)), Ti enrichment at the (Al, Cr)-depleted zone became more obvious (Fig. 7(d), marked by a yellow arrowhead). The major constituent of the OL was CrTaO4-based oxide (Fig. 7(d) and Table 3, region C), which was similar to the results acquired at 1000 °C. Al2O3 was present in the IOD, and TiN particles (Fig. 7(d) and Table 3, region D) were found in the IND with a size of around 1.5 μm.
Figure 7.

Cross-sectional BEI (grey scale images) and selected EDS mapping results (color-coded images) of oxide layers after (a) 1 (b) 12 (c) 40 (d) 200 hours of oxidation at 1100 °C. Note that 1, 2, 3, 4 in (d) respectively represent “OL”, “IOD”, “IND”, and “substrate”. For (b,c), EDS line-scan paths (yellow lines) and results (color-coded lines) were also provided. The enlarged images in (d) showed the details of a TiN particle.
Table 3.
Chemical composition (in at %) of regions shown in Fig. 7. The OL/IOD interface (Fig. 7(b), region A) was distinguished from other parts of oxide layer owing to the depletion of Cr and increase of Mo and Ti.
| ID# | N | O | Al | Si | Ti | Cr | Nb | Mo | Ta |
|---|---|---|---|---|---|---|---|---|---|
| A | — | 43.5 ± 7.9 | 4.3 ± 0.4 | 0.7 ± 0.1 | 10.0 ± 1.2 | 0.5 ± 0.1 | 9.7 ± 1.2 | 20.1 ± 1.5 | 11.2 ± 3.5 |
| B | — | 68.3 ± 0.4 | 1.6 ± 0.6 | 0.4 ± 0.1 | 5.9 ± 0.8 | 0.4 ± 0.1 | 7.1 ± 0.9 | 7.3 ± 0.4 | 9.0 ± 0.2 |
| C | — | 67.4 ± 0.9 | 6.5 ± 0.5 | 0.2 ± 0.0 | 3.2 ± 0.7 | 8.6 ± 0.2 | 5.9 ± 0.4 | 1.8 ± 1.0 | 6.4 ± 0.9 |
| D* | 45.0 ± 3.1 | 2.7 ± 0.8 | 0.1 ± 0.0 | 0.2 ± 0.3 | 50.9 ± 2.2 | 0.2 ± 0.0 | 0.5 ± 0.5 | 0.4 ± 0.4 | 0.0 ± 0.0 |
*Determined with TEM-EDS.
Figure 5 shows the length of OL, IOD, and IND versus time with respect to the oxidation weight gain at 1100 °C. Unlike the result of 1000 °C, only IND length increased drastically during the oxidation at 1100 °C, while OL and IOD length increments were moderate.
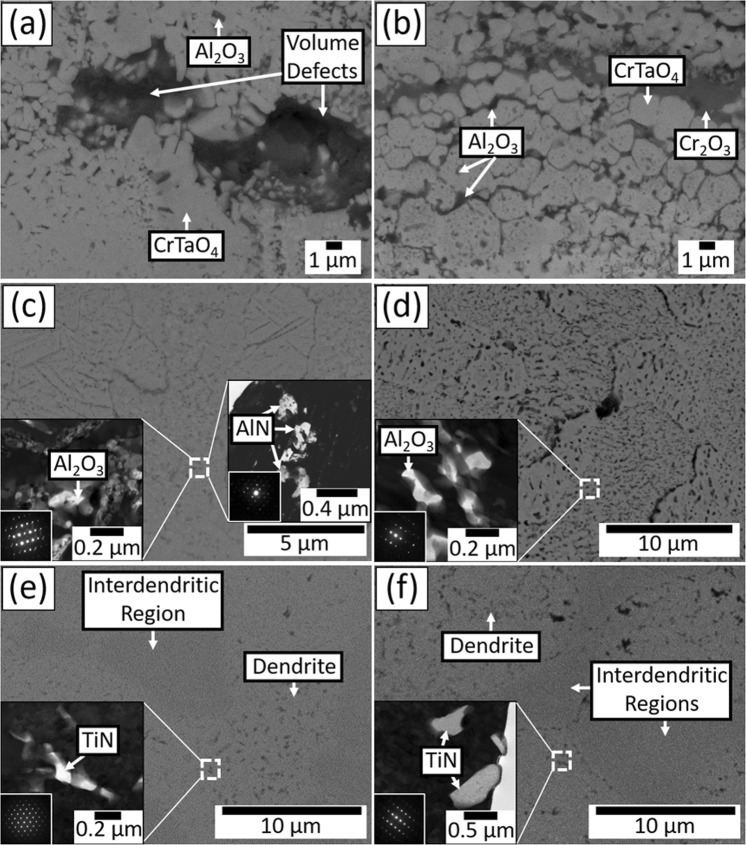
In summary, the oxidation weight gain behaviour up to 200 hours was exponential at 1000 °C, whilst there were three stages at 1100 °C. Cross-sectional BEI and EDS mapping indicated large volume defects in the oxide scale (Fig. 4(c,d), and Fig. 8(a)), limited presence of (Al, Cr)-depletion zone, and thick OL and IND at 1000 °C. By contrast, a less porous oxide scale (Fig. 8(b)), and large IND were observed at 1100 °C. IOD observed in all oxidised samples contained Al2O3 as dominant oxides and minor AlN particles (Fig. 8(c,d)). In addition, TiN particles were found within IND in all oxidised samples, and they formed preferentially within the dendrites at both temperatures (Fig. 8(e,f)).
Figure 8.
BEI and TEM bright field images of (a) external OL (c) IOD (e) IND at 1000 °C, (b) external OL (d) IOD (f) IND at 1100 °C. The beam incident directions for the selective area diffraction patterns (SADPs) are (c) [01-10] for Al2O3 and [01-11] for AlN (d) [01-12] (e) [011] (f) [−112].
Discussion
There were distinct differences in the weight gain behaviours of NV1 at 1000 and 1100 °C; XRD patterns and chemical compositions of all the oxidised samples indicated the major components of the oxide layers at both temperatures were CrTaO4-based oxide with dispersion of Al2O3 and Cr2O3. Since the distribution of Al2O3 and Cr2O3 were not continuous, neither Al2O3 nor Cr2O3 could provide effective barrier against oxidation in this study. However, it was previously reported that the CrTaO4 layer could improve the oxidation resistance of Ni-based superalloys by hindering the outward diffusion of elements from the substrate and reducing the oxygen inward diffusion rate to some extent16–19.
At 1000 °C, the oxidation kinetic curve of NV1 alloy followed exponential dependence. Such dependence is usually observed in either during the initial stage of oxidation or oxidation at relatively lower temperatures20. Since the exponential mass gain rate lasted for at least 200 hours, the later seems to be a more reasonable explanation. In other words, the reason for the exponential weight gain rate was due to the insufficient kinetics for NV1 to form protective oxide at 1000 °C, in this case CrTaO4-based oxide. Since the outward diffusion of elements was limited by insufficient kinetics, the inward diffusion of oxygen would become more dominant during the oxidation process. Little presence of Al and Cr depletion zones illustrated limited outward diffusion of both elements in NV1 alloy at this temperature, Fig. 4. Additionally, since the as-cast microstructure of NV1 alloy was composed of Mo-rich dendrite core and Cr- and Al-rich interdendritic region, the insufficient kinetics could result in heterogeneous oxidation among these chemically different regions. That is, Cr-rich and Al-rich region in interdendritic region could formed Cr2O3 and Al2O3, respectively, while Mo-rich dendrite core formed CrTaO4-based oxide. Such heterogeneous oxidation caused volume defects within the OL (Figs 4(c,d) and 8(a)) and prevented it from acting as an effective diffusion barrier. In Fig. 5, the OL length increment was significant and somewhat resembled the trend of overall weight gain. In addition, the IND length drastically increased with oxidation time. As a result, the weight gain of NV1 alloy at 1000 °C was mainly attributed to both oxidation and nitridation.
At 1100 °C, NV1 exhibited controlled oxidation with its parabolic weight gain behaviour, and the weight gain after 200 hours was smaller than that of 1000 °C. One may speculate that either evaporation of refractory oxide or severe spallation of OL may result in the loss of weight, however, there was neither significant loss of refractory contents nor noticeable spallation of the OL after the test. It appears that formation of denser CrTaO4 was responsible for hindering interdiffusion and provided certain degree of protection, Figs 7 and 8(b). Comparing the microstructure and EDS mapping results of samples acquired at 1000 °C and 1100 °C, the CrTaO4 layer formed at 1100 °C was denser than that formed at 1000 °C. Along with large (Al, Cr)-depleted zone observed at 1100 °C (Fig. 7(d), marked by red arrowheads), it is obvious that the kinetics of diffusion was enhanced, allowing more homogeneous growth of CrTaO4 at 1100 °C. In Stage I oxidation, homogeneous growth of CrTaO4 promoted the formation of a continuous CrTaO4 layer, which acted as a barrier for both inward diffusion of oxygen and outward diffusion of elements from the substrate. Since the elements from the substrate could not diffuse through CrTaO4 layer rapidly, they would accumulate beneath the CrTaO4 layer. These could explain why the external oxidation of Al at the surface barely developed further after 1 hour of oxidation at 1100 °C (Fig. 7(a)), as well as Mo and Ti segregation at the OL/IOD interface. In Stage II oxidation however, since CrTaO4-based mixed oxide layer was not an effective oxygen barrier, the oxidation process was not fully stopped. Al2O3 and Cr2O3 layers found within the oxide layer illustrated the progression of external oxidation front (Fig. 7(c), marked by white arrowheads). Further oxidation at OL/IOD interface also led to Mo evaporation since MoO3 would be highly volatile at above 800 °C21. The evaporation of MoO3 created additional paths for oxygen ingress, accelerating the oxidation of the regions beneath the oxide layer. But since MoO3 evaporated only from ~2 μm-thick OL/IOD interface, the weight loss resulting from MoO3 evaporation shall be neglectable comparing to the weight gain from the accelerated oxidation of the other regions. Consequently, the net oxidation weight gain rate was increased. But eventually, the oxidation process would slow down due to additional formation of CrTaO4 layer in Stage III oxidation.
The CrTaO4-based oxide layer observed in present study showed different lattice constants and compositions at 1000 and 1100 °C. It mainly contained 2.5 at% more Al and 2.2 at% less Cr when the testing temperature increased from 1000 °C to 1100 °C, which also resulted in the change of lattice constants. The increased Al content in CrTaO4-based oxide at 1100 °C reflected the fact that the kinetics for Al was enhanced when the temperature was increased from 1000 °C to 1100 °C, allowing more prominent outward diffusion of Al into the CrTaO4-based oxide layer. The reduced Cr content was most likely caused by substitution of Cr atoms with Al atoms in CrTaO4 lattice since both Al and Cr could form rutile-type AlTaO4 and CrTaO4. Furthermore, the observed CrTaO4-based oxide contained up to 7 at% of Al, 0.2 at% of Si, 3.9 at% of Ti, 6.3 at% of Nb, and 2.8 at% of Mo, along with roughly 10 at% reduction in O and negative deviations in lattice constants comparing to the pure CrTaO4. All the results described above illustrated the non-stoichiometric nature of CrTaO4. Such property potentially suppressed the formation of detrimental oxides, such as Nb2O5 and TiO2, since the metallic atoms of these oxides were accommodated by CrTaO4 instead of forming their individual oxides. However, since CrTaO4-based oxide also contained up to 7 at% of Al, it might also hinder the rapid formation of a protective Al2O3 layer by solutioning outward-diffusing Al atoms and preventing their oxidation. Nevertheless, the CrTaO4-based oxide layer protected NV1 alloy from catastrophic oxidation by hindering the outward diffusion and selective oxidation of refractory elements, as well as reducing the ingress of oxygen to some extent, which consequently led to the formation of IOD with Al2O3 dispersion (Fig. 8(c,d)) since the oxygen partial pressure in the IOD was too low for the formation of other oxides.
The existence of TiN (cubic, a = 4.230 Å) and minor AlN (hexagonal, a = 3.119 Å and c = 5.026 Å) within the IND was confirmed by both TEM-SADPs (Fig. 8) and literature22. The greater length of IND over IOD indicated the ingestion of nitrogen was faster than oxygen, allowing the partial pressure of nitrogen to reach the critical value for TiN formation in a wider region than that of the partial pressure of oxygen to reach the critical value for Al2O3 formation. Furthermore, TiN particles were found to present at dendritic regions at both temperatures, Fig. 8(e,f). In a previous study on the oxidation and nitridation behaviour of Cr-Si system23, it has been suggested that Si addition generally enhances nitridation resistance of pure Cr. In present study, since no obvious trace of TiN was found within Si-bearing Cr- rich phase, it is reasonable to assume that nitrogen preferentially diffused through Mo-rich dendrites and formed TiN particles, while interdendritic regions were less affected by nitrogen. In previous study on the oxidation of Ni- base superalloys, TiN could be found beneath the internal oxidation layer24–26, and the solubility and diffusion of nitrogen was reported to increase with increasing Cr content in Ni-Cr-Al-Ti superalloy without Si addition25. Therefore, both Cr and Si content might be important for providing nitridation resistance. Although the exact nitrogen content was not determined in this work, it is still clear that nitridation in RHEAs can occurred during high temperature exposure, and its influences on the properties of RHEAs could be an important subject for further investigation.
Comparisons between NV1 with several advanced RHEA/RCCAs are shown in Fig. 9. Comparing to the oxidation behaviour of CrMo0.5NbTa0.5TiZr alloy at 1000 °C reported by Senkov et al.11, CrMo0.5NbTa0.5TiZr suffered from extremely high mass gain because no protective oxide layer was formed on the alloy surface during the oxidation. A comparison between the oxide layer of CrMo0.5NbTa0.5TiZr alloy and present work reveals that NV1 alloy had tendency of selective oxidation to form Al2O3, Cr2O3 and CrTaO4-based oxide, which led to better oxidation resistance. Furthermore, NV1 benefited from Si addition to resist nitridation to certain extent at the interdendritic regions. So, the weight gain of NV1 during high temperature exposure was significantly less. As for more recently developed oxidation-resistant RHEAs with similar constituents comparing to NV1 alloy, the performance of NV1 alloy was superior to AlCrMoNbTi13 and fell between (AlCrMoNbTi)0.99Si0.0113 and AlCrMoTaTi14 at 1000 °C within 48 hours. At 1100 oC, NV1 alloy outperformed all 3 other alloys (AlCrMoNbTi, (AlCrMoNbTi)0.99Si0.01, and AlCrMoTaTi) within 48 hours. The main difference in the composition of NV1 alloy was 75% less Ti comparing to AlCrMoNbTi, (AlCrMoNbTi)0.99Si0.01, and AlCrMoTaTi. Since CrTaO4 layer played a major role in reducing the oxidation of NV1 alloy, it is very likely that the reduced Ti content of NV1 alloy promoted the formation of CrTaO4 layer, leading to enhanced oxidation resistance at 1100 °C. These previous works suggested that parabolic mass gain rate observed for the oxidation of RHEAs/RCCAs could be attributed to the formation of protective Al2O3 and Cr2O3 on the alloy surface, although no detailed microstructural characterization were shown in these studies13,14. However, the testing duration in these previous studies was within 48 hours, which was not long enough to confirm whether these RHEAs/RCCAs were really protected by Al2O3 and Cr2O3. To study protective oxide scale, testing duration of 100 hours or beyond is necessary27–29. Calculations of Al activities with TCHEA 3.0 database in Thermo-Calc software (version 2018b) revealed the Al activity of NV1 alloy was 1 × 10⁻⁵ at 1000 °C and 2 × 10⁻⁵ at 1100 °C, while AlCrMoTaTi alloy14 had Al activity of 3.63 × 10⁻⁶ at 1000 °C and 4.99 × 10⁻⁶ at 1100 °C. Obviously, NV1 alloy possessed much higher Al activities at both temperature than those of AlCrMoTaTi alloy, which was claimed to be able to form a protective Al2O3 layer, but no protective Al2O3 layer was found on NV1 alloy in present study. This work clearly demonstrates that the formation of CrTaO4-based oxide dominated the oxidation behaviour and attributed to parabolic mass gain behaviours at 1100 °C. However, protection from CrTaO4-based oxide could not fully prevent the ingestion of oxygen and nitrogen, and the increase of testing duration enabled changes in weight gain behaviours due to further internal oxidation and nitridation. Previous study on RHEAs/RCCAs13 even suggested cracked oxide at the corners of the sample could affect the weight gain behaviours30,31, which was not observed in present study.
Figure 9.
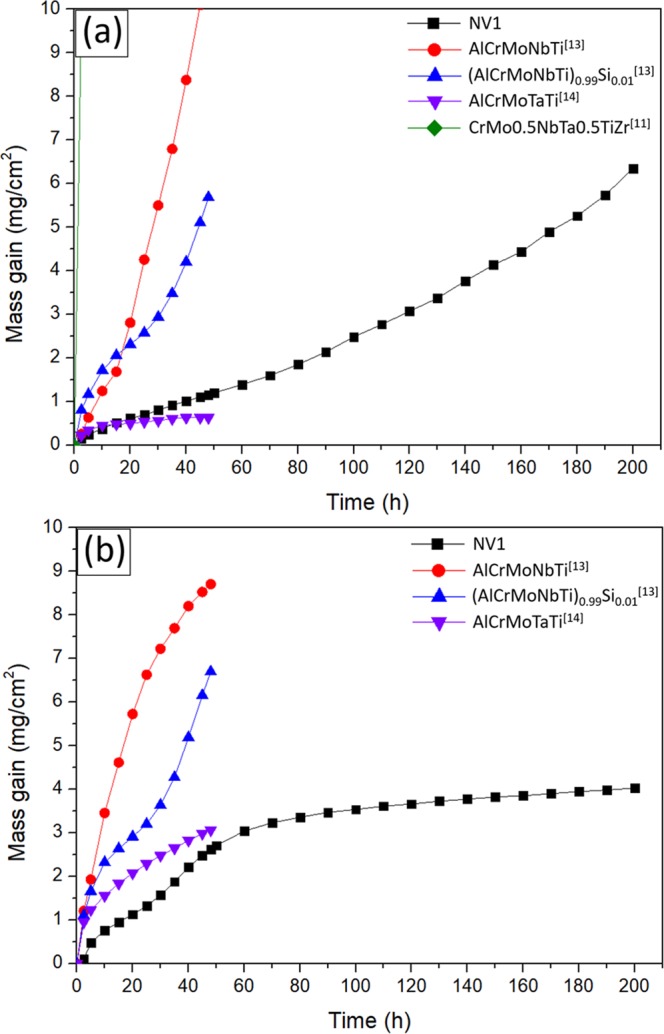
Comparison of oxidation weight gain between NV1 alloy and selected RHEA/RCCAs at (a) 1000 (b) 1100 °C.
In summary, isothermal oxidation at 1000 and 1100 °C was performed on a novel RHEA for up to 200 hours, such long-term oxidation test has not been reported before for this class of alloys. The weight gain behaviours during the tests could be affected by evolutions of external oxidation, internal oxidation, and nitridation. The multiple stages of weight gain behaviour at 1100 °C were never discussed in previous studies since most of them only presented the results of oxidation up to 48 hours12–14,32. We believe that CrTaO4-based protection layer and Si addition may be important for future development of RHEA against oxidation and nitridation. However, it is also possible that the growth of a protective Al2O3 or Cr2O3 layer was hindered by prominent CrTaO4-based oxide presence. In both cases, the nature of such CrTaO4-based oxide needs to be carefully examined in the future studies of RHEAs.
This work has provided an insight on the formation of CrTaO4-based external oxide on a novel RHEA, and how it could influence the weight gain behaviours for up to 200 hours. The pre-oxidation sample contained dendritic microstructure, with Mo-rich phase as dendrite core and Cr-rich phase, minor Al-rich phase located in interdendritic region. Oxidation mechanisms have been deduced based on experimental observations. The external oxides were mainly CrTaO4-based with dispersion of Al2O3 and Cr2O3. The external oxides at 1000 °C contained large volume defects due to insufficient kinetics to form dense CrTaO4-based oxide layer, resulting in an exponential dependence of weight gain throughout 200 hours of testing duration. At 1100 °C, mass gain curve showed three different stages of dependence during 200 hours of oxidation. TiN particles were mainly found in dendritic regions. The weight gain of the alloy at 1100 °C after 200 hours was 4.03 mg/cm2, which indicates that it is one of the most oxidation resistant RHEAs according to literature data to-date.
Methods
The alloy of interest contains Al, Cr, Mo, Nb, Si, Ta, Ti; it is designated as NV1, and its composition is given in Table 1. The design of NV1 was based on CrMo0.5NbTa0.5TiZr alloy proposed by Senkov et al.11,33; the addition of Al, Si and further increase in Cr content were intended to promote the formation of protective oxide layer on the alloy surface, while Ti content was reduced and Zr was removed to minimize possible competitive oxide formations of TiO2 and ZrO234. The ingot of NV1 was prepared by the cold crucible levitation melting method with high purity elemental raw materials (>99.9 wt%), and a 1.1 kg cone-shaped ingot was cast. Chemical compositions were determined with Shimadzu Lab Center XRF-1800 and JEOL JXA-8900R. The compositions listed in this work were measured with EPMA unless otherwise stated. The ingot was machined by electrical discharge machining for experimental analysis.
X-ray diffraction (XRD) analysis was conducted to identify phases. Sample dimension was 10 × 10 × 2 mm3, with surfaces ground to 1200 grit with SiC abrasive paper. The as-cast and oxidised samples were analysed by a Rigaku MiniFlex 600X-ray diffractometer. Radiation source was Cu Kα, and the goniometer scanning was performed between 2θ = 20–100° with a scanning rate of 10° per minute. Oxidation mass gain curves were measured at 1000 °C and 1100 °C with a thermogravimetric analyser (TGA) - SETARAM TAG 24-18S simultaneous symmetrical thermoanalyser; specimens for TGA had a dimension of 6 × 3 × 2 mm3 with each surface ground to 1200 grit with SiC abrasive paper, and tests were performed with flowing dry air; the sample was hung by Pt wire in a vertical furnace, and the weight change was recorded automatically every 0.04 hour up to 200 hours at 1000 °C and 1100 °C. The measured curves were expressed with fitted equations with R2 values greater than 0.99. In order to study oxidation mechanisms, additional isothermal oxidation tests were performed with muffle furnace in the atmosphere. Dimension and surface roughness of samples for isothermal oxidation tests were the same as those for XRD analysis, and the tests were conducted for 1, 50, 100, and 200 hours at 1000 °C, and 1, 12, 40, 200 hours at 1100 °C. The choice of testing durations of isothermal oxidation tests was associated with the oxidation behaviours determined with TGA. Oxidised samples were removed from the furnace once the testing duration was reached, and subsequently air-cooled to room temperature. The isothermal oxidation test was repeated at least 4 times for each testing condition, and the microstructure of the post- test specimens was compared to that of the TGA-tested specimens to confirm the consistency of the experimental results. Microstructures and composition of oxidised samples were analysed by Shimadzu EPMA-1610, JEOL JXA-8500F, JEOL JSM-7610F, and Hitachi S-4700 scanning electron microscope equipped with EDS and backscatter electron detector. Samples for TEM were prepared by means of focused ion beam method with SEIKO SMI 2050 and observed with JEOL JEM-F200.
Acknowledgements
The authors are grateful for the help from Ms. Ayako Ikeda and Mr. Mitsuaki Nishio from National Institute for Materials Science (NIMS), Japan, who operated the EPMA and provided technical information on the tested samples. Thermodynamic data simulation provided by Mr. Kai-Chun Chang from National Tsing Hua University (NTHU), Taiwan, is also appreciated by the authors. This study was a collaboration work between NTHU, Taiwan and NIMS, Japan, and the funding was supported by NIMS International Cooperative Graduate Program (NIMS-ICGP), Ministry of Science and Technology (MOST) in Taiwan (MOST106-2923-E-007 -002 -MY2, MOST107-2218-E-007 -012), and the “High Entropy Materials Center” from The Featured Areas Research Center Program within the framework of the Higher Education Sprout Project by the Ministry of Education (MOE) and from the Project MOST 107-3017-F-007-003 by MOST.
Author Contributions
Kai-Chi Lo and An-Chou Yeh wrote the main text and prepared most of the figures in the manuscript. Yao-Jen Chang performed TEM and provided the corresponding data in Fig. 8(c–f). Hideyuki Murakami and Jien-Wei Yeh provided access to the required instruments and suggestions for interpreting the experimental data. All authors reviewed the manuscript.
Competing Interests
The authors declare no competing interests.
Footnotes
Publisher’s note: Springer Nature remains neutral with regard to jurisdictional claims in published maps and institutional affiliations.
References
- 1.Yeh JW, et al. Nanostructured High-Entropy Alloys with Multiple Principal Elements: Novel Alloy Design Concepts and Outcomes. Advanced Engineering Materials. 2004;6:299–303. doi: 10.1002/adem.200300567. [DOI] [Google Scholar]
- 2.Tsai MH, Yeh JW. High-entropy alloys: a critical review. Materials Research Letters. 2014;2:107–123. doi: 10.1080/21663831.2014.912690. [DOI] [Google Scholar]
- 3.Daoud H, Manzoni A, Wanderka N, Glatzel U. High-Temperature Tensile Strength of Al10Co25Cr8Fe15Ni36Ti6 Compositionally Complex Alloy (High-Entropy Alloy) JOM. 2015;67:2271. doi: 10.1007/s11837-015-1484-7. [DOI] [Google Scholar]
- 4.Senkov ON, Wilks GB, Miracle DB, Chuang CP, Liaw PK. Refractory high-entropy alloys. Intermetallics. 2010;18:1758–1765. doi: 10.1016/j.intermet.2010.05.014. [DOI] [Google Scholar]
- 5.Senkov ON, Scott JM, Senkova SV, Miracle DB, Woodward CF. Microstructure and room temperature properties of a high-entropy TaNbHfZrTi alloy. Journal of Alloys and Compounds. 2011;509:6043–6048. doi: 10.1016/j.jallcom.2011.02.171. [DOI] [Google Scholar]
- 6.Senkov ON, Wilks GB, Scott JM, Miracle DB. Mechanical properties of Nb25Mo25Ta25W25 and V20Nb20Mo20Ta20W20 refractory high entropy alloys. Intermetallics. 2011;19:698–706. doi: 10.1016/j.intermet.2011.01.004. [DOI] [Google Scholar]
- 7.Senkov ON, Senkova SV, Woodward C. Effect of aluminum on the microstructure and properties of two refractory high-entropy alloys. Acta Materialia. 2014;68:214–228. doi: 10.1016/j.actamat.2014.01.029. [DOI] [Google Scholar]
- 8.Wang XH, Zhou YC. High-Temperature Oxidation Behavior of Ti2AlC in Air. Oxidation of Metals. 2003;59:303–320. doi: 10.1023/A:1023092027697. [DOI] [Google Scholar]
- 9.Hua Y, et al. Laser shock processing effects on isothermal oxidation resistance of GH586 superalloy. Applied Surface Science. 2015;330:439–444. doi: 10.1016/j.apsusc.2015.01.033. [DOI] [Google Scholar]
- 10.Azim MA, et al. Creep Resistance and Oxidation Behavior of Novel Mo-Si-B-Ti Alloys. JOM. 2015;67:2621–2628. doi: 10.1007/s11837-015-1560-z. [DOI] [Google Scholar]
- 11.Senkov ON, Senkova SV, Dimiduk DM, Woodward C, Miracle DB. Oxidation behavior of a refractory NbCrMo0.5Ta0.5TiZr alloy. J Mater Sci. 2012;47:6522–6534. doi: 10.1007/s10853-012-6582-0. [DOI] [Google Scholar]
- 12.Gorr B, et al. Phase equilibria, microstructure, and high temperature oxidation resistance of novel refractory high-entropy alloys. Journal of Alloys and Compounds. 2015;624:270–278. doi: 10.1016/j.jallcom.2014.11.012. [DOI] [Google Scholar]
- 13.Gorr B, et al. High temperature oxidation behavior of an equimolar refractory metal-based alloy 20Nb20Mo20Cr20Ti20Al with and without Si addition. Journal of Alloys and Compounds. 2016;688:468–477. doi: 10.1016/j.jallcom.2016.07.219. [DOI] [Google Scholar]
- 14.Gorr B, et al. High-Temperature Oxidation Behavior of Refractory High-Entropy Alloys: Effect of Alloy Composition. Oxidation of Metals. 2017;88:1–11. doi: 10.1007/s11085-016-9696-y. [DOI] [Google Scholar]
- 15.Davey WP. Precision Measurements of the Lattice Constants of Twelve Common. Metals. Physical Review. 1925;25:753–761. doi: 10.1103/PhysRev.25.753. [DOI] [Google Scholar]
- 16.Han FF, Chang JX, Li H, Lou LH, Zhang J. Influence of Ta content on hot corrosion behaviour of a directionally solidified nickel base superalloy. Journal of Alloys and Compounds. 2015;619:102–108. doi: 10.1016/j.jallcom.2014.08.259. [DOI] [Google Scholar]
- 17.Park SJ, Seo SM, Yoo YS, Jeong HW, Jang H. Effects of Al and Ta on the high temperature oxidation of Ni-based superalloys. Corrosion Science. 2015;90:305–312. doi: 10.1016/j.corsci.2014.10.025. [DOI] [Google Scholar]
- 18.Kim HS, et al. High temperature oxidation resistance of Ni-(5∼13)Co-(10∼16)Cr-(5∼9)W-5Al-(1∼1.5)Ti-(3∼6)Ta alloys. Metals and Materials International. 2016;22:789–796. doi: 10.1007/s12540-016-6305-1. [DOI] [Google Scholar]
- 19.Ren W, et al. The influence of CrTaO4 layer on the oxidation behavior of a directionally-solidified nickel-based superalloy at 850–900 °C. Journal of Alloys and Compounds. 2017;724:565–574. doi: 10.1016/j.jallcom.2017.07.066. [DOI] [Google Scholar]
- 20.Krzyzanowski, M., Beynon, J. H. & Farrugia, D. C. J. Oxide Scale Behavior in High Temperature Metal Processing. (John Wiley & Sons, 2010).
- 21.Gulbransen EA, Andrew KF, Brassart FA. Oxidation of Molybdenum 550° to 1700 °C. Journal of The Electrochemical Society. 1963;110:952–959. doi: 10.1149/1.2425918. [DOI] [Google Scholar]
- 22.Glasson DR, Jayaweera SAA. Formation and reactivity of nitrides I. Review and introduction. Journal of Applied Chemistry. 1968;18:65–77. doi: 10.1002/jctb.5010180301. [DOI] [Google Scholar]
- 23.Soleimani-Dorcheh A, Galetz MC. Oxidation and Nitridation Behavior of Cr–Si Alloys in Air at 1473 K. Oxidation of Metals. 2015;84:73–90. doi: 10.1007/s11085-015-9544-5. [DOI] [Google Scholar]
- 24.Litz J, Rahmel A, Schorr M. Selective carbide oxidation and internal nitridation of the Ni-base superalloys IN 738 LC and IN 939 in air. Oxidation of Metals. 1988;30:95–105. doi: 10.1007/BF00656646. [DOI] [Google Scholar]
- 25.Krupp U, Christ HJ. Selective oxidation and internal nitridation during high-temperature exposure of single-crystalline nickel-base superalloys. Metallurgical and Materials Transactions A. 2000;31:47–56. doi: 10.1007/s11661-000-0051-0. [DOI] [Google Scholar]
- 26.Huang L, Sun X, Guan H, Hu Z. Oxidation behavior of a single-crystal Ni-base superalloy in air at 900, 1000 and 1100 °C. Tribology Letters. 2006;23:15–22. doi: 10.1007/s11085-006-9016-z. [DOI] [Google Scholar]
- 27.Park SJ, Seo SM, Yoo YS, Jeong HW, Jang H. Statistical Study of the Effects of the Composition on the Oxidation Resistance of Ni-Based Superalloys. Journal of Nanomaterials. 2015;2015:11. doi: 10.1155/2015/929546. [DOI] [Google Scholar]
- 28.Cao J, Zhang J, Chen R, Ye Y, Hua Y. High temperature oxidation behavior of Ni-based superalloy GH202. Materials Characterization. 2016;118:122–128. doi: 10.1016/j.matchar.2016.05.013. [DOI] [Google Scholar]
- 29.Sato A, Chiu YL, Reed RC. Oxidation of nickel-based single-crystal superalloys for industrial gas turbine applications. Acta Materialia. 2011;59:225–240. doi: 10.1016/j.actamat.2010.09.027. [DOI] [Google Scholar]
- 30.Young DJ, Chyrkin A, He J, Grüner D, Quadakkers WJ. Slow Transition from Protective to Breakaway Oxidation of Haynes 214 Foil at High Temperature. Oxidation of Metals. 2013;79:405–427. doi: 10.1007/s11085-013-9364-4. [DOI] [Google Scholar]
- 31.Otsuka N, Nishiyama Y, Kudo T. Breakaway Oxidation of TP310S Stainless-Steel Foil Initiated by Cr Depletion of the Entire Specimen in a Simulated Flue-Gas Atmosphere. Oxidation of Metals. 2004;62:121–139. doi: 10.1023/B:OXID.0000038789.20019.a9. [DOI] [Google Scholar]
- 32.Liu CM, Wang HM, Zhang SQ, Tang HB, Zhang AL. Microstructure and oxidation behavior of new refractory high entropy alloys. Journal of Alloys and Compounds. 2014;583:162–169. doi: 10.1016/j.jallcom.2013.08.102. [DOI] [Google Scholar]
- 33.Senkov ON, Woodward CF. Microstructure and properties of a refractory NbCrMo0.5Ta0.5TiZr alloy. Materials Science and Engineering: A. 2011;529:311–320. doi: 10.1016/j.msea.2011.09.033. [DOI] [Google Scholar]
- 34.Ellingham HJT. Reducibility of oxides and sulfides in metallurgical processes. J Soc Chem Ind. 1944;63:125–133. doi: 10.1002/jctb.5000630501. [DOI] [Google Scholar]


