Fig. 1.
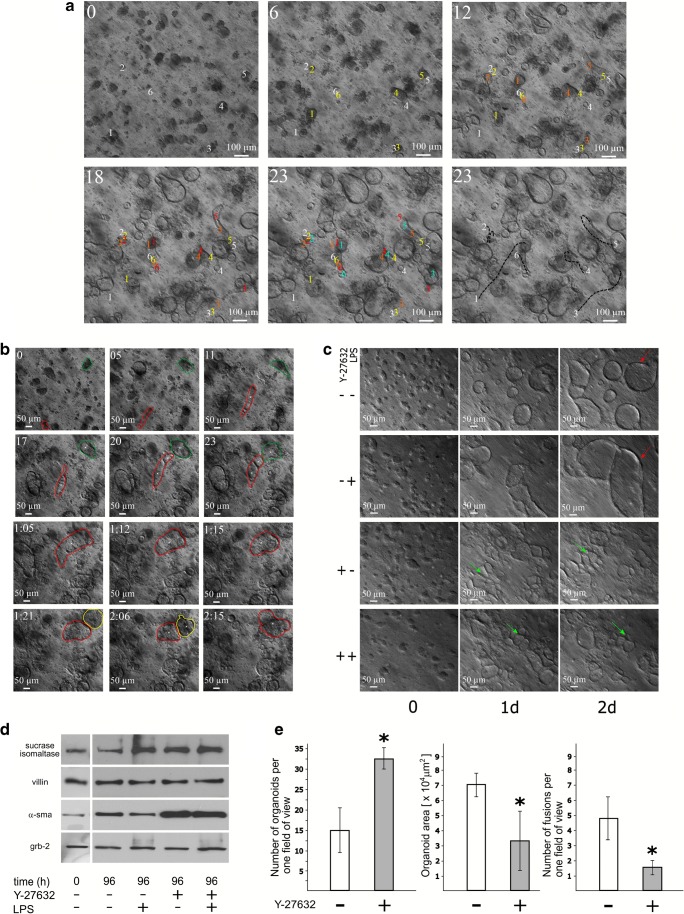
The dynamic of organoids growth—the migration and fusion events in various culture conditions. The formation of organoids was recorded under an inverted microscope equipped with an incubation chamber, by collecting one image every half an hour in the first 3 days of culture. a The location of organoids moving through the Matrigel parallel to the insert surface was marked by numbers (1–6); the position of given organoid center at time 0 is shown with a white number; and at 6 h—yellow, 12 h—orange, 18 h—red, and 23 h—blue. The black dashed lines on the photograph in the lower right corner of the panel represent the distances covered by moving organoids in the first whole day of culture (see also Suppl. video 1). b The organoids moving towards one another and the fusion events between them were also recorded. The boundaries of three individual organoids that fused into one structure were contoured in red, green, and yellow. The lumen formation is marked by a white cross (see also Suppl. video 2). c The presence of ultrapure lipopolysaccharides from Escherichia coli 0111:B4 (LPS, 1 μg/ml) in the medium caused the formation of larger organoids on days 2 and 3 from seeding, as compared to the organoids cultured without such stimulation (C, red arrows). The addition of Y-27632 (10 μM) resulted in the formation of more organoids but of smaller size, regardless of the LPS presence (C, green arrows, see also Suppl. video 4). d The epithelial lining obtained by incubation of the intestines of 19-day-old chicken embryos in PBS contacting EGTA and glucose for 2 h was used for total protein isolation and subsequent immunoblotting (time 0). The tissue fragments isolated in the same way were used to start the organoid cultures. Organoids were cultured for 3 days without LPS and Y-27632 or with LPS (1 μg/ml) or with Y-27632 (10 μM) or both. Upon completion of the time-lapse video recording, the media were exchanged and cultures were transferred to the incubator. After 96 h of culture, the total cellular proteins were isolated and the presence of enterocyte markers (sucrase-isomaltase and villin), myofibroblasts marker (α-smooth muscle actin—α-sma), and loading control (growth factor receptor-bound protein 2—grb2) was detected by immunoblotting. The protein samples from organoid cultures treated with Y-27632 inhibitor contain much more α-sma. e The projection area of organoids and number of organoids in one field of view were calculated from digitized images of cultures kept with the absence (open bars) or presence (closed bars) of ROCK inhibitor, which were taken at 72 h from seeding. All fusion events occurring in the first 48 h were calculated by a time-lapse video analysis (the mean of five independent measurements is presented). An ANOVA test was performed to confirm the significance of the difference between organoids cultured with and without Y-27632: p value below 0.05 was considered significant and marked by asterisks (see also Suppl. video 4)

