

Abstract
Aims: Calcification in the coronary and aortic arteries has been linked to cardiovascular morbidity and mortality. The pathophysiological influence of aortic artery calcification (AAC) differs from that of coronary artery calcification (CAC). We aimed to compare the relationships between CAC and AAC and cardiovascular disease (CVD) risk factors.
Methods: We examined a random sample of 1035 Japanese men aged 40–79 years. CAC and AAC were measured by computed tomography and scored according to the Agatston method. Using a logistic regression, we calculated the odds ratio (OR) as being in the highest quintile (Q5) of the calcification score compared to the lower quintiles (Q1–Q4) per 1 standard deviation higher CVD risk factor. Models were simultaneously adjusted for age, body mass index (BMI), systolic blood pressure, smoking (pack-year), alcohol intake, hemoglobin A1c, uric acid, estimated glomerular filtration rate (eGFR), serum lipids, and C-reactive protein. Differences in ORs were investigated using a generalized estimating equation. We performed a multiple linear regression using log-transformed CAC and AAC values as dependent variables.
Results: CAC and AAC were independently associated with age (OR, 95% CI: 2.30 [1.77–2.98] for CAC and 3.48 [2.57–4.73] for AAC), p for difference < 0.001), systolic blood pressure (1.29 [1.08–1.53] and 1.28 [1.07–1.54], p for difference = 0.270), and smoking (1.22, [1.04–1.43] and 1.34 [1.13–1.58]) p for difference = 0.071). Alcohol correlated with AAC only (1.17 [0.97–1.41] for CAC and 1.42 [1.16–1.73] for AAC, p for difference = 0.020).
Conclusions: CAC and AAC were associated with similar CVD risk factors. The strength of association slightly differed between CAC and AAC.
Keywords: Coronary artery, Aortic artery, Calcification, Cardiovascular diseases, Risk factors
Introduction
In contrast to coronary artery calcification (CAC), limited information is currently available on aortic artery calcification (AAC), although AAC shares similar cardiovascular disease (CVD) risk factors with CAC. AAC has been linked to cardiovascular morbidity and mortality1, 2). AAC and CAC are both associated with incident major cardiovascular events3–6). AAC has been identified as a predictor of cardiovascular mortality in high-risk populations, such as patients with chronic kidney disease7, 8). In a general population, AAC has been reported to have a high specificity for the detection of severe coronary atherosclerosis in patients with coronary artery disease9, 10). Because of the earlier onset and higher prevalence of AAC than CAC, some studies have suggested AAC to be a better measure of atherosclerosis than CAC11).
AAC contributes to arterial stiffness in young men and has a different pathophysiological influence from CAC; AAC represents medial or a combination of intimal and medial calcification, whereas CAC represents atherosclerotic intimal calcification12, 13). Therefore, related CVD risk factors and their magnitude to AAC may differ from those of CAC.
Discrepancies have been reported in the risk factors associated with AAC14, 15). The Multiethnic Study of Atherosclerosis (MESA) showed that the most standard CVD risk factors have stronger relationships with AAC than CAC16). However, most studies on the relationships between AAC and cardiovascular risk factors have been limited to Western populations, in which the absolute risk of coronary heart disease (CHD) is higher than that in East Asian populations, particularly Japan17). Further studies to clarify whether the relationships between CVD risk factors and calcification in the two vascular beds remain the same or not in a population with a lower risk of CHD may contribute in preventing and elucidating the underlying mechanisms of atherosclerotic disease in Asian countries.
Aim
To examine whether the relationships between CAC and AAC and CVD risk factors differ in Japanese men.
Methods
Study Design and Participants
The aim of the Shiga Epidemiological Study of Subclinical Atherosclerosis (SESSA) is to examine the factors associated with subclinical atherosclerosis. A detailed design of SESSA is described elsewhere18, 19). Briefly, between 2006 and 2008, 1094 Japanese men aged 40–79 years were randomly selected from the general population in Kusatsu City, Shiga, Japan. After excluding participants with prior myocardial infarction (n = 29), missing data on pack years of smoking (n = 9) and triglyceride (TG) levels (n = 17), and incomplete computed tomography (CT) images for the assessment of AAC (n = 7), 1035 men were included in the present study. All participants provided written informed consent. The study complied with the Declaration of Helsinki and was approved by the Institutional Review Board of Shiga University of Medical Science, Otsu, Japan.
Risk Factor Assessment
A questionnaire was used to obtain demographic information. Physical examinations for the measurements of height, weight, and blood pressure were performed. Body mass index (BMI; kg/m2) was calculated as weight (kg) divided by height (m) squared. Blood pressure was measured twice in a seated position after at least a 5-minute rest and 30-second interval between the first and second readings. The average of two consecutive measures was used. Information on medical history, medication use, alcohol intake per day, and cigarette use per pack year was obtained using a self-administered questionnaire followed by a review by trained research technicians. Hypertension was defined as systolic blood pressure of ≥ 140 mmHg, diastolic blood pressure of ≥ 90 mmHg, or as the use of antihypertensive medication. The definition of diabetes mellitus was fasting glucose ≥ 126 mg/dL, hemoglobin A1c (HbA1c) ≥ 6.1% (Japanese Diabetes Society criteria, which is equivalent to ≥ 6.5% under the National Glycohemoglobin Standardization Program [NGSP]), or the use of antidiabetic medication20). Dyslipidemia was defined as TG ≥ 150 mg/dL, high-density lipoprotein cholesterol (HDL-C) < 40 mg/dL, or low-density lipoprotein cholesterol (LDL-C) ≥ 140 mg/dL, according to the 2017 guidelines by the Japan Atherosclerosis society21), or the use of dyslipidemia medication.
Laboratory Measurements
Blood samples were obtained from participants by venipuncture after fasting for 12 h. Within 90 min from collection, serum was separated by centrifugation (3000 revolutions/min for 15 min) at 4 °C. Samples were then sent for routine laboratory tests, including the assessment of lipid profiles and glucose levels. Lipid measurements were standardized according to the protocol of the Centers for Disease Control and Prevention/Cholesterol Reference Method Laboratory Network22). LDL-C levels were estimated using Friedewald formula23). eGFR was calculated using the Japanese Society of Nephrology equation24). HbA1c levels measured in the Japanese Diabetes Society scale were converted to NGSP scale values25).
Measurement of CAC and AAC
Detailed methods to assess CAC and AAC have been published elsewhere19). Briefly, CAC and AAC were evaluated by electron-beam computed tomography (EBCT) using a C-150 scanner (Imatron, South San Francisco, CA, USA) or by 16-channel multidetector row computed tomography (MDCT) using an Aquilion scanner (Toshiba, Tokyo, Japan). CAC and AAC lesions were considered to be present when three contiguous pixels (1 mm2) with an attenuation of ≥ 130 Hounsfield units (HU) were identified. We placed a region of interest around each high-density lesion in the epicardial coronary arteries and a computer-driven measurement of the lesion area and its maximum density were recorded.
Images were obtained from the level of the aortic root through the heart at every 3-mm slice to evaluate CAC and from the aortic arch to the iliac bifurcation at every 6-mm slice for EBCT and 7-mm slice for MDCT to evaluate AAC, with a scan time of 100 ms (EBCT) or 320 ms (MDCT).
Agatston scores were obtained by multiplying the pixel area (mm2) by the density score (1, 130–199 HU; 2, 200–299 HU; 3, 300–399 HU; and 4, > 399 HU) depending on the highest density measurement (HU) anywhere in the plaque, and summing all lesion scores. We acquired images for all participants at 70% of the cardiac cycle using electrocardiogram triggering during a single breath-hold. Tube voltages for Agatston scores were 130 kV for EBCT and 120 kV for MDCT. Readings of CT images were performed by trained physicians who were blinded from the clinical information of the participants. The cut-off point for the severity of calcification was assessed by quintiles of the calcium score per arterial bed. Although calcium scores of 100, 300, 400, and 1000 have been reported as clinically important cut-off points for CAC26, 27), cut-off points for AAC have not yet been established.
Statistical Analysis
Data were analyzed by quintiles of CAC and AAC scores with the highest fifth quintile (Q5) compared to the lower four quintiles (Q1–Q4) in all analyses. Participant characteristics are shown as means and standard deviations (SD) or medians and 25th to 75th percentiles for continuous variables. Regarding categorical variables, characteristics are presented as percentages. In comparisons between the characteristics of the highest quintile and lower four quintiles, t-tests, chi-squared tests, and Wilcoxon tests were performed for continuous, categorical, and skewed continuous variables, respectively. In graphical presentations, a frequency of CAC and AAC calcium scores greater than zero was computed as a percentage among age decades and the chi-squared test was performed to assess the statistical significance between Agatston scores per age decade. The distribution of CAC and AAC was plotted graphically and Spearman correlation for CAC and AAC was assessed.
We used two sets of multivariate models; a logistic regression analysis was initially used to assess the odds of having the highest quintile of CAC and AAC per 1 SD higher for continuous risk factors. In logistic regression Model 1, each of the measured potential, conventional, and novel CVD risk factors and use of medication were included, with age and CT type as covariates. To identify whether these risk factors were independently associated with severe CAC or AAC, logistic regression models were simultaneously adjusted for all the risk factors shown in Model 1. To avoid collinearity, raw data variables, such as systolic blood pressure, HDL-C, LDL-C, and TG, were arbitrarily selected among blood pressure variables and blood lipid variables together with their medications to be included in the model. Interactions for age with CVD risk factors were examined. Differences in ORs between CAC and AAC were examined using a generalized estimating equation28).
A multiple linear regression was then used with log (CAC + 1) or log (AAC + 1) as the dependent variable. Because the natural logarithms of CAC and AAC were used, 1 was added to each score to include individuals with zero values for CAC and AAC. As a supplementary analysis, we performed a multivariable logistic regression model to compare the zero versus non-zero CAC and zero versus non-zero AAC groups.
Analyses were performed using SAS 9.4 (SAS Institute, Cary, North Carolina) and two-tailed p values of < 0.05 were considered as significant.
Results
Characteristics of Study Participants and Changes in CAC and AAC with Age
Table 1 shows the distribution of potential risk factors stratified by the lower four quintiles and the highest quintile of CAC and AAC. Participants in the highest quintiles of CAC and AAC were older and had significantly higher blood pressure, HbA1c, C-reactive protein (CRP), and pack years of smoking. The prevalence of hypertension, diabetes mellitus, and the use of their respective medications along with lipid-lowering medication was significantly higher in the highest quintiles of CAC and AAC. eGFR was significantly lower for participants in the highest quintile for both CAC and AAC. BMI, HDL-C, LDL-C, TG, uric acid, and hypercholesterolemia were not significantly different for CAC and AAC.
Table 1. Characteristics of Japanese men (n = 1035), aged 40–79 years, by the severity of calcification, SESSA (2006–2008).
| Coronary artery calcification |
Aortic artery calcification |
|||||
|---|---|---|---|---|---|---|
| Characteristic | Lower 4 Q | Highest Q | P value | Lower 4 Q | Highest Q | P value |
| (n = 828) | (n = 207) | (n = 828) | (n = 207) | |||
| (0–145) | (146–4685) | (0–1762) | (1772–20295) | |||
| Age (Years) | 62.5 ± 10.1 | 69.5 ± 6.9 | < 0.001 | 62.2 ± 10.0 | 70.5 ± 6.4 | < 0.001 |
| Body mass index (kg/m2) | 23.5 ± 3.0 | 23.7 ± 2.9 | 0.510 | 23.6 ± 2.9 | 23.4 ± 3.1 | 0.450 |
| Systolic blood pressure (mmHg) | 134.6 ± 18.2 | 143.5 ± 20.1 | < 0.001 | 134.3 ± 18.2 | 144.5 ± 19.6 | < 0.001 |
| HDL-cholesterol (mg/dL) | 59.2 ± 16.7 | 57.8 ± 18.0 | 0.320 | 59.4 ± 17.1 | 57.0 ± 16.2 | 0.070 |
| LDL-cholesterol (mg/dL) | 125.3 ± 31.3 | 124.4 ± 32.7 | 0.710 | 125.8 ± 31.4 | 122.5 ± 32.3 | 0.199 |
| Triglycerides (mg/dL) | 103.5 76–149 | 108.0 79–147 | 0.511 | 102.0 76–147 | 110.0 77–153 | 0.298 |
| HbA1c (%) | 5.6 ± 0.8 | 5.8 ± 0.8 | 0.001 | 5.6 ± 0.8 | 5.8 ± 0.8 | 0.001 |
| CRP (mg/ml) | 0.4 0.2–0.8 | 0.6 0.3–1.3 | < 0.001 | 0.4 0.2–0.8 | 0.6 0.2–1.3 | 0.001 |
| Uric Acid (mg/dL) | 6.0 ± 1.2 | 6.0 ± 1.3 | 0.992 | 6.0 ± 1.2 | 6.1 ± 1.3 | 0.220 |
| eGFR (mL/min/1.73 m2) | 74.0 ± 14.1 | 60.0 ± 15.7 | < 0.001 | 74.0 ± 14.1 | 68.9 ± 15.5 | < 0.001 |
| Alcohol intake (g/day) | 14.0 0.8–36.7 | 17.6 0–40.0 | 0.363 | 13.0 0.5–36.0 | 20.6 1.4–43.5 | 0.011 |
| Smoking amount (pack-year) | 26.5 ± 24.8 | 34.4 ± 25.6 | < 0.001 | 26.0 ± 24.9 | 36.3 ± 24.2 | < 0.001 |
| Diabetes mellitus medication (%) | 8.2 | 18.4 | < 0.001 | 8.2 | 18.4 | < 0.001 |
| Hypertension medication (%) | 24.0 | 42.5 | < 0.001 | 22.0 | 50.7 | < 0.001 |
| Lipid medication (%) | 10.3 | 29.5 | < 0.001 | 11.4 | 25.1 | < 0.001 |
| Diabetes mellitus (%) | 18.8 | 32.4 | < 0.001 | 18.8 | 32.4 | < 0.001 |
| Hypertension (%) | 50.0 | 74.9 | < 0.001 | 48.6 | 80.7 | 0.001 |
| Dyslipidemia (%) | 31.3 | 43.5 | 0.001 | 31.9 | 41.1 | 0.014 |
| CT type: EBCT (%) | 67.0 | 75.9 | 0.010 | 67.6 | 73.4 | 0.110 |
| MDCT (%) | 33.0 | 24.2 | 32.4 | 26.6 | ||
Values are means ± SD, medians with interquartile ranges, or percentages. HDL, high-density lipoprotein; LDL, low-density lipoprotein; CRP, C-reactive protein; EBCT, electron-beam computed tomography; MDCT, multi-detector row computed tomography; Q, quintile. LDL-cholesterol levels were calculated using Friedewald formula [LDL-cholesterol (mg/dL) = total cholesterol (mg/dL)-HDL-cholesterol (mg/dL) triglyceride (mg/dL)/5], diabetes mellitus is defined as fasting glucose ≥ 126 mg/dL, HbA1c ≥ 6.1% (Japanese Diabetes Society criteria, which is equivalent to ≥ 6.5% under the NGSP), or the use of antidiabetic medication. Hypertension is defined as systolic blood pressure ≥ 140 mmHg, diastolic blood pressure ≥ 90 mmHg, or the use of antihypertensive medication. Dyslipidemia is defined as TG ≥ 150 mg/dL, high-density lipoprotein cholesterol < 40 mg/dL, low-density lipoprotein cholesterol ≥ 140, or the use of dyslipidemia medication. Probability values were estimated by the t-test for continuous variables, χ2 for categorical variables, and Wilcoxon for skewed variables.
Fig. 1 shows the distribution of the presence of CAC and AAC (Agatston score > 0) among the decades of age. The prevalence of calcification was higher in the older age group in both arterial beds. However, the prevalence of calcification was higher in the aorta than in the coronary artery in all age decades. There was no significant interaction of age in the relationship between CAC or AAC and CVD risk factors.
Fig. 1.
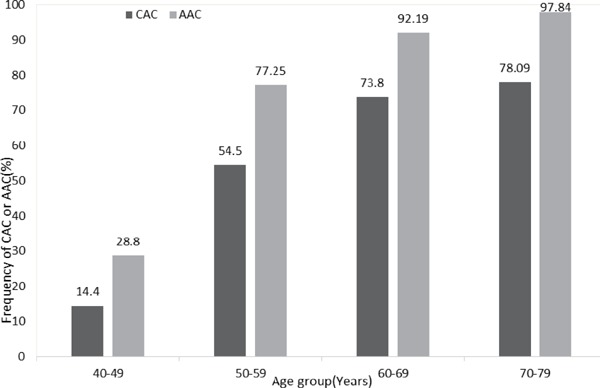
Frequency (%) of the presence of CAC and AAC among age in decades, SESSA (2006–2008)
The presence of CAC and AAC was defined as an Agatston score of > 0 and data are presented as a percentage of all individuals in each age decade. The number of individuals with CAC per age decade was as follows: 40–49 (n = 18 out of 125), 50–59 (103 out of 189), 60–69 (293 out of 397), and 70–79 (253 out of 324). The number of individuals with AAC was as follows: 40–49 (36 out of 125), 50–59 (146 out of 189), 60–69 (366 out of 397), and 70–79 (317 out of 324). The chi-squared test was performed to assess the significance of differences between Agatston scores per age decade. Probability values for chi-squared tests were 0.113, 0.025, 0.003, and 0.023 for the age decades 40–49, 50–59, 60–69, and 70–79, respectively.
Supplemental Fig. 1 shows the distribution of CAC and AAC in study participants, with percentages in parentheses; 4.4% had CAC only, 23.6% had AAC only, 60% had both CAC and AAC, and 12% had neither CAC nor AAC. Pearson correlation coefficient for CAC and AAC was r = 0.46, p < 0.0001.
Supplemental Fig. 1.
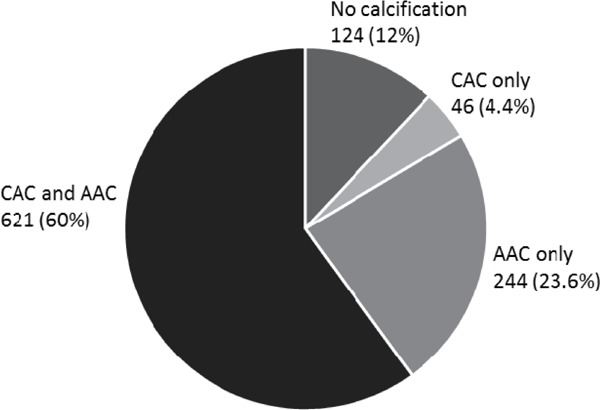
Prevalence of CAC and AAC, SESSA (2006–2008)
The number of individuals and percentages indicated are those with CAC > 0 and/or AAC > 0 Agatston score (CAC and AAC, CAC only, and AAC only) or CAC and AAC equal to 0 Agatston score (no calcification).
The distributions of Log CAC and Log AAC are shown in Supplemental Fig. 2.
Supplemental Fig. 2.
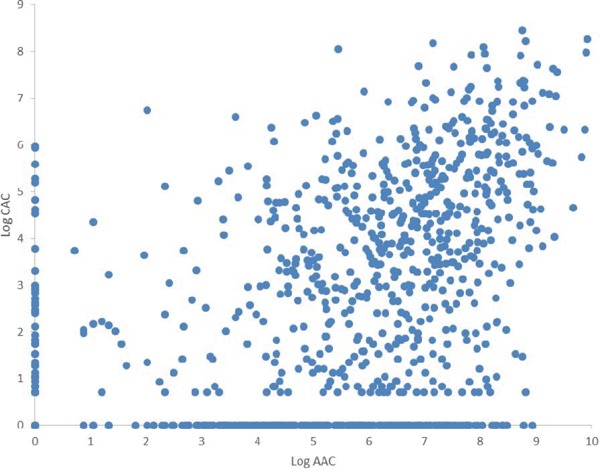
Distribution of Log CAC and Log AAC, SESSA (2006–2008)
CAC and AAC Associations with CVD Risk Factors
In Table 2, after adjustments for the relationship between each potential risk factor and AAC or CAC for age and CT type, the risk factors that did not have a significant association with AAC or CAC were BMI, HDL-C, LDL-C, TG, and eGFR. Age, systolic blood pressure, smoking, and alcohol intake were significantly associated with CAC and AAC. HbA1c and CRP only associated with CAC, whereas uric acid only associated with AAC.
Table 2. Age-adjusted odds ratios for the highest quintile of CAC and AAC compared to lower four quintiles per 1 SD higher or the presence of risk factors in Japanese men, SESSA 2006–2008.
| Variables | SD | CAC |
AAC |
||
|---|---|---|---|---|---|
| OR | 95%CI | OR | 95%CI | ||
| Age (years) | 10.0 | 2.64 | 2.11, 3.31 | 3.54 | 2.74, 4.57 |
| Body mass index (kg/m2) | 3.0 | 1.16 | 0.99, 1.37 | 1.03 | 0.88, 1.22 |
| Systolic blood pressure (mmHg) | 18.9 | 1.35 | 1.15, 1.59 | 1.43 | 1.21, 1.69 |
| HDL-cholesterol (mg/dL) | 17.0 | 0.95 | 0.80, 1.11 | 0.89 | 0.75, 1.06 |
| LDL-cholesterol (mg/dL) | 31.6 | 1.02 | 0.87, 1.20 | 0.95 | 0.81, 1.12 |
| Triglycerides (mg/dL) | 61.9 | 1.12 | 0.95, 1.33 | 1.17 | 0.99, 1.37 |
| HbA1c (%) | 0.79 | 1.17 | 1.01, 1.36 | 1.13 | 0.97, 1.31 |
| Uric Acid (mg/dL) | 1.2 | 1.09 | 0.93, 1.28 | 1.23 | 1.05, 1.46 |
| C-reactive protein (mg/mL) | 3.8 | 1.22 | 1.06, 1.22 | 1.02 | 0.86, 1.21 |
| eGFR (mL/min/1.73 m2) | 14.5 | 0.87 | 0.73, 1.03 | 0.91 | 0.77, 1.08 |
| Alcohol intake (g/day) | 27.6 | 1.18 | 1.01, 1.40 | 1.45 | 1.22, 1.72 |
| Smoking amount (pack-year) | 25.1 | 1.28 | 1.10, 1.49 | 1.43 | 1.22, 1.66 |
| Diabetes mellitus medication | - | 2.09 | 1.33, 3.27 | 2.06 | 1.31, 3.26 |
| Hypertension medication | - | 1.70 | 1.22, 2.37 | 2.67 | 1.90, 3.74 |
| Lipid medication | - | 3.09 | 2.07, 4.60 | 2.01 | 1.33, 3.04 |
All ORs were estimated by a logistic regression model for quintile 5 in reference to the lower 4 quintiles. All continuous variables are per 1 SD higher. The type of CT scan was included in all models. CAC, coronary artery calcification; AAC, aortic artery calcification; SD, standard deviation; OR, odds ratios; 95% CI, 95% confidence interval; HDL, high-density lipoprotein; LDL, low-density lipoprotein; eGFR, estimated glomerular filtration rate. LDL-cholesterol levels were calculated using Friedewald formula [LDL-cholesterol (mg/dL)= total cholesterol (mg/dL)-HDL-cholesterol (mg/dL) triglyceride (mg/dL)/5]. eGFR was estimated using the Japanese Society of Nephrology equation “194 × Serum creatinine−1.094 × Age−0.287”. Dyslipidemia is defined as TG ≥ 150 mg/dL, high-density lipoprotein cholesterol < 40, or low-density lipoprotein cholesterol ≥ 140 according to the 2012 guidelines by the Japan Atherosclerosis Society. TG, CRP, and alcohol were log transformed.
In Table 3, all the variables in Model 1 were included simultaneously in the second logistic regression model (Model 2), hence adjusting for each other. After simultaneous adjustments, age, systolic blood pressure, and smoking were independently associated with CAC and AAC. Alcohol intake was independently associated with AAC only. We examined the magnitude of the relationship between CAC and AAC to compare odds ratios, and the results obtained revealed differences in the association patterns of risk factors. Age more strongly associated with the presence of AAC than with the presence of CAC; p < 0.001 for the difference in odds ratios. Alcohol intake, BMI, and hypertension medication were associated with the presence of AAC, but not with the presence of CAC; p = 0.020, p = 0.011, p = 0.005, respectively, for the difference in odds ratios. Regarding HDL-C, OR was not statistically significant for each outcome, whereas a difference was observed in the magnitude of the association between the presence of CAC and the presence of AAC (p = 0.004). An analysis using continuous variables as non-zeros versus zeros for CAC and AAC provided similar results to the analysis for the quintiles. Results are shown in Supplemental Table 1.
Table 3. Multivariable adjusted odds ratios of risk factors in 1SD change for the highest quintile of CAC and AAC compared to lower four quintiles in Japanese men, SESSA 2006–2008.
| Variables | CAC |
AAC |
p* | ||
|---|---|---|---|---|---|
| OR | 95%CI | OR | 95%CI | ||
| Age (years) | 2.30 | 1.77, 2.98 | 3.48 | 2.57, 4.73 | < 0.001 |
| Body mass index (kg/m2) | 0.97 | 0.80, 1.17 | 0.79 | 0.65, 0.97 | 0.011 |
| Systolic blood pressure (mmHg) | 1.29 | 1.08, 1.53 | 1.28 | 1.07, 1.54 | 0.270 |
| HDL-cholesterol (mg/dL) | 0.98 | 0.80, 1.20 | 0.86 | 0.70, 1.07 | 0.004 |
| LDL-cholesterol (mg/dL) | 1.08 | 0.90, 1.28 | 1.06 | 0.89, 1.28 | 0.638 |
| Triglycerides (mg/dL) | 0.98 | 0.80, 1.20 | 1.02 | 0.83, 1.26 | 0.309 |
| HbA1c (%) | 0.94 | 0.73, 1.21 | 1.91 | 0.69, 1.18 | 0.671 |
| Uric Acid (mg/dL) | 1.01 | 0.84, 1.21 | 1.14 | 0.95, 1.38 | 0.328 |
| C-reactive protein (mg/ml) | 1.13 | 0.97, 1.32 | 1.07 | 0.91, 1.25 | 0.473 |
| eGFR (mL/min/1.73 m2) | 0.94 | 0.78, 1.14 | 0.97 | 0.80, 1.18 | 0.235 |
| Alcohol intake (g/day) | 1.17 | 0.97, 1.41 | 1.42 | 1.16, 1.73 | 0.020 |
| Smoking amount (pack-year) | 1.22 | 1.04, 1.43 | 1.34 | 1.13, 1.58 | 0.071 |
| Diabetes mellitus medication | 1.85 | 1.02, 3.33 | 1.91 | 1.02, 3.56 | 0.163 |
| Hypertension medication | 1.20 | 0.83, 1.74 | 2.15 | 1.48, 3.12 | 0.005 |
| Lipid medication | 2.83 | 1.83, 4.37 | 1.78 | 1.11, 2.84 | 0.880 |
All ORs were estimated by a logistic regression model for quintile 5 in reference to the lower 4 quintiles. All variables were entered in the model simultaneously and the type of CT scan was also included in the model. All continuous variables are per 1 SD higher and skewed variables were log transformed. SD, standard deviation; CAC, coronary artery calcification; AAC, aortic artery calcification; OR, odds ratios; 95% CI, 95% confidence interval; HDL, high-density lipoprotein; LDL, low-density lipoprotein; CRP, C-reactive protein. LDL-cholesterol levels was calculated using Friedewald formula [LDL-cholesterol (mg/dL)= total cholesterol (mg/dL)-HDL-cholesterol (mg/dL)-triglyceride (mg/dl)/5]. eGFR is estimated using the Japanese Society of Nephrology equation “194 × Serum creatinine−1.094 × Age−0.287”. TG, CRP, and alcohol were log transformed. p* is the p value for the difference in the odds value.
Supplemental Table 1. Multivariable adjusted odds ratios of risk factors for the presence CAC and AAC versus zero CAC and zero AAC in Japanese men, SESSA 2006–2008.
| Variables | CAC |
AAC |
||
|---|---|---|---|---|
| OR | 95%CI | OR | 95%CI | |
| Age (years) | 2.40 | 1.97, 2.91 | 4.92 | 3.53, 6.87 |
| Body mass index (kg/m2) | 1.47 | 1.23, 1.77 | 0.79 | 0.62, 1.02 |
| Systolic blood pressure (mmHg) | 1.22 | 1.03, 1.44 | 1.48 | 1.12, 1.95 |
| HDL-cholesterol (mg/dL) | 1.01 | 0.85, 1.21 | 0.86 | 0.66, 1.12 |
| LDL-cholesterol (mg/dL) | 1.12 | 0.95, 1.31 | 1.28 | 1.01, 1.62 |
| Triglycerides (mg/dL) | 1.25 | 1.04, 1.49 | 1.05 | 0.82, 1.35 |
| HbA1c (%) | 1.08 | 0.87, 1.33 | 0.91 | 0.67, 1.23 |
| Uric Acid (mg/dL) | 1.02 | 0.86, 1.19 | 1.04 | 0.82, 1.32 |
| C-reactive protein (mg/ml) | 1.06 | 0.90, 1.25 | 1.05 | 0.81, 1.38 |
| eGFR (mL/min/1.73 m2) | 1.23 | 1.02, 1.47 | 1.27 | 0.96, 1.65 |
| Alcohol intake (g/day) | 1.14 | 0.97, 1.34 | 1.10 | 0.86, 1.41 |
| Smoking amount (pack-year) | 1.14 | 0.97, 1.34 | 2.21 | 1.62, 3.01 |
| Diabetes mellitus medication | 2.03 | 1.00, 4.11 | 1.17 | 0.43, 3.23 |
| Hypertension medication | 1.36 | 0.93, 1.97 | 1.46 | 0.78, 2.75 |
| Lipid medication | 1.35 | 0.83, 2.22 | 1.33 | 0.62, 2.82 |
All ORs were estimated by a logistic regression model for the presence of CAC and AAC in reference to zero CAC and zero AAC. All variables were entered in the model simultaneously and the type of CT scan was also included in the model. All continuous variables are per 1 SD higher and skewed variables were log transformed. SD, standard deviation; CAC, coronary artery calcification; AAC, aortic artery calcification; OR, odds ratio; 95% CI, 95% confidence interval; HDL, high-density lipoprotein; LDL, low-density lipoprotein; CRP, C-reactive protein. LDL-cholesterol levels were calculated using Friedewald formula [LDL-cholesterol (mg/dL) = total cholesterol (mg/dL)-HDL-cholesterol (mg/dL)-triglyceride (mg/dL)/5]. eGFR was estimated using the Japanese Society of Nephrology equation “194 × Serum creatinine−1.094 × Age−0.287.” TG, CRP, and alcohol were log transformed.
Table 4 shows the results of the multiple linear regressions as coefficient estimates per SD change. Risk factors predicted the extent of calcification in participants. These results were consistent with those shown in Table 3. However, a difference was observed in the relationships between BMI and CAC and that between LDL-C and CRP and AAC. r2 was larger for the log (AAC + 1) model (0.49) than for the log (CAC + 1) (0.23) model.
Table 4. Multiple linear regression Models for correlates of Log-transformed CAC and AAC per 1 SD change, SESSA 2006–2008.
| Log (CAC + 1) |
Log (AAC + 1) |
|||
|---|---|---|---|---|
| r2 | 0.23 | 0.49 | ||
| coefficient | P value | coefficient | P value | |
| Age (years) | 0.82 | < 0.001 | 1.59 | < 0.001 |
| Body mass index (kg/m2) | 0.17 | 0.021 | −0.15 | 0.038 |
| Systolic blood pressure (mmHg) | 0.27 | < 0.001 | 0.31 | < 0.001 |
| HDL-cholesterol (mg/dL) | 0.002 | 0.975 | −0.09 | 0.256 |
| LDL-cholesterol (mg/dL) | 0.13 | 0.068 | 0.16 | 0.014 |
| Triglycerides (mg/dL) | 0.04 | 0.652 | 0.01 | 0.912 |
| HbA1c (%) | 0.005 | 0.955 | 0.02 | 0.779 |
| Uric Acid (mg/dL) | −0.03 | 0.668 | 0.06 | 0.361 |
| C-reactive protein (mg/ml) | 0.11 | 0.140 | 0.20 | 0.005 |
| eGFR (mL/min/1.73 m2) | 0.07 | 0.325 | 0.03 | 0.685 |
| Alcohol intake (g/day) | 0.14 | 0.059 | 0.22 | 0.002 |
| Smoking amount (pack-Year) | 0.18 | 0.009 | 0.50 | < 0.001 |
The model was adjusted for all variables in the table and diabetes, hypertension, and lipid medications. SD, standard deviation; CAC, coronary artery calcification; AAC, aortic artery calcification; HDL, high-density lipoprotein; LDL, low-density lipoprotein; CRP, C-reactive protein. LDL-cholesterol levels were calculated using Friedewald formula [LDL-cholesterol (mg/dL) = total cholesterol (mg/dL)-HDL-cholesterol (mg/dL)-triglyceride (mg/dL)/5]. eGFR was estimated using the Japanese Society of Nephrology equation “194 × Serum creatinine−1.094 × Age−0.287”. TG, CRP, and alcohol were log transformed.
Discussion
In this cross-sectional study on community-based Japanese men, similarities in CVD risk factor associations were observed between the two measures of calcification; however, these relationships were not entirely consistent. We found that age, alcohol, and hypertension medication were more strongly related to severe AAC than to severe CAC. In studies from Western countries, age and smoking were more strongly associated with AAC than with CAC16, 29, 30). Although p value for the difference of smoking showed a statistical significance marginally, the present results are consistent with these studies. Our results suggest that lifestyle modifications in alcohol intake and smoking are more effective for preventing AAC in Japanese individuals. To the best of our knowledge, this is the first study to compare differences between CAC and AAC assessed by CT in relation to their associations with CVD risk factors in a general population in Asia.
Studies on AAC and alcohol are limited, and alcohol intake was positively associated with AAC in the present study. A previous study reported similar findings to the present results regarding the dose response between alcohol intake and the severity of AAC31). A recent study on Japanese men found that light to moderate consumption of alcohol reduced mortality from aortic diseases; however, this was not the case for heavy drinkers32). Regarding CAC, study results are not consistent. The CARDIA study reported a positive association between alcohol intake and CAC33). Previous studies also found an inverse relationship between alcohol intake and CAC34), suggesting a protective association. MESA did not identify any protective association between alcohol intake and CAC, but found that CAC was more prevalent in heavy hard liquor drinkers35). Even if a protective association exists with alcohol consumption, it was shown to be independent of CAC36). Thus, the suggested protective effects of alcohol on CHD or other diseases may be mediated through other mechanisms that are not related to arterial calcification.
We did not find relationships between CAC or AAC and serum lipids when categorical variables of cholesterol (LDL-C > 160 mg/dL) (data not shown) were included in the model. One reason that may explain the lack of an association with known risk factors is our study population was community-based and, thus, may include individuals with less advanced dyslipidemia and diabetes mellitus, resulting in weaker relationships. Similar findings to the present results were reported by the population-based Rotterdam study37). Other studies reported inconsistent findings regarding the relationship between arterial calcification and lipid profiles38–40). Therefore, higher powered studies to clarify the relationship between serum lipids and CAC and AAC are needed.
We identified systolic blood pressure as an independent risk factor for CAC and AAC. Other studies have also found a relationship between blood pressure and CAC2, 30, 40, 41). A positive relationship between blood pressure and AAC has also been reported2). We found no independent significant association between HbA1c and calcification in either arterial bed. A study on conventional coronary artery disease risk factors and CAC detected by EBCT in 30,908 healthy individuals showed a relationship between diabetes and CAC in men and women41). A relationship between fasting glucose and CAC in women only has also been reported42). However, no relationship between fasting glucose and CAC or AAC was noted in postmenopausal women38).
The present study demonstrated that BMI was inversely associated with AAC, but not with CAC. Previous studies also reported this inverse association in men and women2), whereas others have shown positive associations with CAC42, 43) or no relationship between arterial calcification with obesity in men16). CAC was not associated with BMI in men and women40), whereas AAC was not associated with BMI in women38). These differences may be because of variations in study population characteristics, such as age, gender, and ethnicity. Our study participants were lean with a mean BMI of 23.5. Previous studies suggested that the relationship between CHD and BMI is mediated by other CVD risk factors44). More studies are needed to clarify this relationship, particularly in a lean population, because most of the reported relationships were conducted on Western populations who are more likely to be obese than Asians43).
Novel risk factors were not independently related with either of the vascular beds; however, uric acid was significantly associated with AAC and CRP with CAC after age adjustments. The significance of these relationships was lost after accounting for traditional CVD risk factors. We found that CRP was not associated with calcification, consistent with previous findings showing no relationship between CRP and CAC45, 46).
There were consistencies in the relationships between the model investigating the relationships between risk factors and the continuous distribution of CAC and AAC (Table 4), as well as the categorical model (Table 3). AAC has an impact on medical and surgical treatments because it impairs the outcomes of aneurysmal repair and aortic stenting47). Thus, the early detection of AAC is important because of its clinical implications. Although our study showed similarities in CVD risk factors between the two vascular beds, there were also some differences in the magnitude of their relationships with age, alcohol, BMI, HDL-C, and hypertension medication. A novel insight into the cause of CVDs may be obtained by identifying factors that are unique to a single vascular bed versus those associated with calcification at both vascular beds.
It currently remains unclear why AAC was more strongly related with CVD risk factors than CAC was. This may be attributed to the differences in pathophysiological mechanisms, for example, cigarette smoking has been suggested to be a stronger risk factor for peripheral than central atherosclerosis16). The presence of AAC predicts risks for future clinical CVD1), which may predict the presence of CAC, and, thus, future clinical CVD. Except for age and alcohol intake, which were more strongly associated with AAC, other risk factors appear to have similar impacts on CAC and AAC. AAC, which is easily detected by plain X-ray, may be used to detect arterial calcification. The predictive values of CAC and AAC for CVD events need to be compared in future research.
The prevalence of AAC and CAC was previously reported to be lower in Japanese than in Caucasians and Japanese Americans48, 49). CAC scores were also found to be higher in men than in women50). Because our population was only men from Japan, our results may not be generalized to women or populations outside Japan, which is a limitation of the present study.
A strength of the present study is that we investigated the relationships between CVD risk factors and CAC and AAC in middle-aged and elderly men, allowing for an assessment over a wide age range. Another strength is that we examined healthy participants who were free of CVD and randomly selected from a community-based sample.
Because of the observational and cross-sectional natures of the present study, the causality and direction of the relationships between CAC and AAC and CVD risk factors may not be proven and, similar to all other observational studies, unknown confounding factors may not be fully controlled.
Conclusion
In a community-based sample of Japanese men who were free of clinical CVD, calcification in the coronary and aortic vascular beds showed similar associations with the CVD risk factors investigated; however, the strengths of these associations were slightly greater overall for AAC than for CAC.
Acknowledgments
SESSA Research Group Members
Chairperson: Hirotsugu Ueshima (Center for Epidemiologic Research in Asia, Department of Public Health, Shiga University of Medical Science, Otsu, Shiga).
Co-chairpersons: Katsuyuki Miura (Department of Public Health, Shiga University of Medical Science, Otsu, Shiga).
Research members: Minoru Horie, Takashi Yamamoto, Hiroshi Maegawa, Kiyoshi Murata, Kazuhiko Nozaki, Akihiko Shiino, Ikuo Toyama,, Teruhiko Tsuru, Hisakazu Ogita, Aya Kadota, Akira Fujiyoshi, Naoyuki Takashima, Takashi Kadowaki, Sayaka Kadowaki, Naomi Miyamatsu, Naoko Miyagawa, Sayuki Torii, Hideki Hayashi, Yasutaka Nakano, Emiko Ogawa, Itsuko Miyazawa, Akio Shimizu, Robert D. Abbott, Keiko Kondo, Maryam Zaid, Sentaro Suzuki, Takahiro Ito, Akira Andoh, Ayako Kunimura (Shiga University of Medical Science, Otsu, Shiga), Yoshihiko Nishio (Kagoshima University, Kagoshima), Kenichi Mitsunami (Vories Memorial Hospital, Omihachiman, Shiga), Toru Kita, Takeshi Kimura, Yasuharu Tabara (Kyoto University, Kyoto), Yasuyuki Nakamura (Ryukoku University, Kyoto), Tomonori Okamura (Keio University, Tokyo), Akira Sekikawa, Emma JM Barinas-Mitchell (University of Pittsburgh, Pittsburgh, PA, USA), Takayoshi Ohkubo (Teikyo University, Tokyo), Yoshikuni Kita (Tsuruga Nursing University, Tsuruga, Fukui) , Yoshitaka Murakami (Toho University, Ota, Tokyo) Atsushi Hozawa (Tohoku University, Sendai, Miyagi), Nagako Okuda (University of Human Arts and Sciences, Iwatsuki-ku, Saitama), Aya Higashiyama, Seiko Ohno (Research and Development Initiative Center, National Cerebral and Cardiovascular Center, Suita, Osaka), Shinya Nagasawa (Kanazawa Medical University, Kanazawa, Ishikawa), Takashi Hisamatsu (Shimane University, Matsue, Shimane), Masahiro Yamazoe (Tokyo Medical and Dental University, Tokyo), Yoshino Saito (Aino University, Takatsuki, Osaka), Daniel Edmundowicz (Temple University, Philadelphia, United States), Hisatomi Arima, Atsushi Satoh (Fukuoka University, Fukuoka), Koichiro Azuma (Keio University School of Medicine, Tokyo), Masahiko Yanagita (Doshisha University, Kyoto), Tatsuya Sawamura (Shinshu University, Nagano), Michiya Igase (Ehime University, Matsuyama, Ehime).
Funding
This study was supported by Grants-in-Aid for Scientific Research (A) 13307016, (A) 17209023, (A) 21249043, (A) 23249036, and (A) 25253046 from the Ministry of Education, Culture, Sports, Science, and Technology Japan, and by grant R01HL068200 by Glaxo-Smith Klein.
Conflict of Interest
None.
References
- 1). Wilson PW, Kauppila LI, O'Donnell CJ, Kiel DP, Hannan M, Polak JM, Cupples LA: Abdominal aortic calcific deposits are an important predictor of vascular morbidity and mortality. Circulation, 2001; 103: 1529-1534 [DOI] [PubMed] [Google Scholar]
- 2). Iribarren C, Sidney S, Sternfeld B, Browner WS: Calcification of the aortic arch: risk factors and association with coronary heart disease, stroke, and peripheral vascular disease. JAMA, 2000; 283: 2810-2815 [DOI] [PubMed] [Google Scholar]
- 3). Kalsch H, Lehmann N, Moebus S, Hoffmann B, Stang A, Jockel KH, Erbel R, Mahabadi AA: Aortic Calcification Onset and Progression: Association With the Development of Coronary Atherosclerosis. J Am Heart Assoc, 2017; 6: e005093. [DOI] [PMC free article] [PubMed] [Google Scholar]
- 4). Okada H, Tada H, Hayashi K, Kawashima H, Takata T, Sakata K, Nohara A, Mabuchi H, Yamagishi M, Kawashiri MA: Aortic Root Calcification Score as an Independent Factor for Predicting Major Adverse Cardiac Events in Familial Hypercholesterolemia. J Atheroscler Thromb, 2018; 25: 634-642 [DOI] [PMC free article] [PubMed] [Google Scholar]
- 5). Takamura K, Fujimoto S, Kondo T, Hiki M, Kawaguchi Y, Kato E, Daida H: Incremental Prognostic Value of Coronary Computed Tomography Angiography: High-Risk Plaque Characteristics in Asymptomatic Patients. J Atheroscler Thromb, 2017; 24: 1174-1185 [DOI] [PMC free article] [PubMed] [Google Scholar]
- 6). Zaid M, Fujiyoshi A, Kadota A, Abbott RD, Miura K: Coronary Artery Calcium and Carotid Artery Intima Media Thickness and Plaque: Clinical Use in Need of Clarification. J Atheroscler Thromb, 2017; 24: 227-239 [DOI] [PMC free article] [PubMed] [Google Scholar]
- 7). Okuno S, Ishimura E, Kitatani K, Fujino Y, Kohno K, Maeno Y, Maekawa K, Yamakawa T, Imanishi Y, Inaba M, Nishizawa Y: Presence of abdominal aortic calcification is significantly associated with all-cause and cardiovascular mortality in maintenance hemodialysis patients. Am J Kidney Dis, 2007; 49: 417-425 [DOI] [PubMed] [Google Scholar]
- 8). Tatami Y, Yasuda Y, Suzuki S, Ishii H, Sawai A, Shibata Y, Ota T, Shibata K, Niwa M, Morimoto R, Hayashi M, Kato S, Maruyama S, Murohara T: Impact of abdominal aortic calcification on long-term cardiovascular outcomes in patients with chronic kidney disease. Atherosclerosis, 2015; 243: 349-355 [DOI] [PubMed] [Google Scholar]
- 9). Papanas N, Tziakas D, Mavridis G, Giannakis I, Symeonidis G, Stakos D, Milousis A, Maltezos E, Louridas G, Hatseras D: Aortic arch calcification predicts the extent of coronary atherosclerosis in patients with or without type 2 diabetes: short communication. Acta Clin Belg, 2007; 62: 52-55 [DOI] [PubMed] [Google Scholar]
- 10). Nicoll R, Henein MY: The predictive value of arterial and valvular calcification for mortality and cardiovascular events. Int J Cardiol Heart Vessel, 2014; 3: 1-5 [DOI] [PMC free article] [PubMed] [Google Scholar]
- 11). Criqui MH, Denenberg JO, McClelland RL, Allison MA, Ix JH, Guerci A, Cohoon KP, Srikanthan P, Watson KE, Wong ND: Abdominal aortic calcium, coronary artery calcium, and cardiovascular morbidity and mortality in the Multi-Ethnic Study of Atherosclerosis. Arterioscler Thromb Vasc Biol, 2014; 34: 1574-1579 [DOI] [PMC free article] [PubMed] [Google Scholar]
- 12). Guo J, Fujiyoshi A, Willcox B, Choo J, Vishnu A, Hisamatsu T, Ahuja V, Takashima N, Barinas-Mitchell E, Kadota A, Evans RW, Miura K, Edmundowicz D, Masaki K, Shin C, Kuller LH, Ueshima H, Sekikawa A: Increased Aortic Calcification Is Associated With Arterial Stiffness Progression in Multiethnic Middle-Aged Men. Hypertension, 2017; 69: 102-108 [DOI] [PMC free article] [PubMed] [Google Scholar]
- 13). Mackey RH, Venkitachalam L, Sutton-Tyrrell K: Calcifications, arterial stiffness and atherosclerosis. Adv Cardiol, 2007; 44: 234-244 [DOI] [PubMed] [Google Scholar]
- 14). Sekikawa A, Shin C, Curb JD, Barinas-Mitchell E, Masaki K, El-Saed A, Seto TB, Mackey RH, Choo J, Fujiyoshi A, Miura K, Edmundowicz D, Kuller LH, Ueshima H, Sutton-Tyrrell K: Aortic stiffness and calcification in men in a population-based international study. Atherosclerosis, 2012; 222: 473-477 [DOI] [PMC free article] [PubMed] [Google Scholar]
- 15). Post W, Bielak LF, Ryan KA, Cheng YC, Shen H, Rumberger JA, Sheedy PF, 2nd, Shuldiner AR, Peyser PA, Mitchell BD: Determinants of coronary artery and aortic calcification in the Old Order Amish. Circulation, 2007; 115: 717-724 [DOI] [PMC free article] [PubMed] [Google Scholar]
- 16). Criqui MH, Kamineni A, Allison MA, Ix JH, Carr JJ, Cushman M, Detrano R, Post W, Wong ND: Risk factor differences for aortic versus coronary calcified atherosclerosis: the multiethnic study of atherosclerosis. Arterioscler Thromb Vasc Biol, 2010; 30: 2289-2296 [DOI] [PMC free article] [PubMed] [Google Scholar]
- 17). Ueshima H, Sekikawa A, Miura K, Turin TC, Takashima N, Kita Y, Watanabe M, Kadota A, Okuda N, Kadowaki T, Nakamura Y, Okamura T: Cardiovascular disease and risk factors in Asia: a selected review. Circulation, 2008; 118: 2702-2709 [DOI] [PMC free article] [PubMed] [Google Scholar]
- 18). Kadota A, Miura K, Okamura T, Fujiyoshi A, Ohkubo T, Kadowaki T, Takashima N, Hisamatsu T, Nakamura Y, Kasagi F, Maegawa H, Kashiwagi A, Ueshima H: Carotid intima-media thickness and plaque in apparently healthy Japanese individuals with an estimated 10-year absolute risk of CAD death according to the Japan Atherosclerosis Society (JAS) guidelines 2012: the Shiga Epidemiological Study of Subclinical Atherosclerosis (SESSA). J Atheroscler Thromb, 2013; 20: 755-766 [DOI] [PubMed] [Google Scholar]
- 19). Fujiyoshi A, Miura K, Ohkubo T, Kadowaki T, Kadowaki S, Zaid M, Hisamatsu T, Sekikawa A, Budoff MJ, Liu K, Ueshima H: Cross-sectional comparison of coronary artery calcium scores between Caucasian men in the United States and Japanese men in Japan: the multi-ethnic study of atherosclerosis and the Shiga epidemiological study of subclinical atherosclerosis. Am J Epidemiol, 2014; 180: 590-598 [DOI] [PMC free article] [PubMed] [Google Scholar]
- 20). Seino Y, Nanjo K, Tajima N, Kadowaki T, Kashiwagi A, Araki E, Ito C, Inagaki N, Iwamoto Y, Kasuga M, Hanafusa T, Haneda M, Ueki K: Report of the committee on the classification and diagnostic criteria of diabetes mellitus. J Diabetes Investig, 2010; 1: 212-228 [DOI] [PMC free article] [PubMed] [Google Scholar]
- 21). Teramoto T, Sasaki J, Ishibashi S, Birou S, Daida H, Dohi S, Egusa G, Hiro T, Hirobe K, Iida M, Kihara S, Kinoshita M, Maruyama C, Ohta T, Okamura T, Yamashita S, Yokode M, Yokote K: Executive summary of the Japan Atherosclerosis Society (JAS) guidelines for the diagnosis and prevention of atherosclerotic cardiovascular diseases in Japan -2012 version. J Atheroscler Thromb, 2013; 20: 517-523 [DOI] [PubMed] [Google Scholar]
- 22). Nakamura M, Sato S, Shimamoto T: Improvement in Japanese clinical laboratory measurements of total cholesterol and HDL-cholesterol by the US Cholesterol Reference Method Laboratory Network. J Atheroscler Thromb, 2003; 10: 145-153 [DOI] [PubMed] [Google Scholar]
- 23). Friedewald WT, Levy RI, Fredrickson DS: Estimation of the concentration of low-density lipoprotein cholesterol in plasma, without use of the preparative ultracentrifuge. Clin Chem, 1972; 18: 499-502 [PubMed] [Google Scholar]
- 24). Matsuo S, Imai E, Horio M, Yasuda Y, Tomita K, Nitta K, Yamagata K, Tomino Y, Yokoyama H, Hishida A: Revised equations for estimated GFR from serum creatinine in Japan. Am J Kidney Dis, 2009; 53: 982-992 [DOI] [PubMed] [Google Scholar]
- 25). Kashiwagi A, Kasuga M, Araki E, Oka Y, Hanafusa T, Ito H, Tominaga M, Oikawa S, Noda M, Kawamura T, Sanke T, Namba M, Hashiramoto M, Sasahara T, Nishio Y, Kuwa K, Ueki K, Takei I, Umemoto M, Murakami M, Yamakado M, Yatomi Y, Ohashi H: International clinical harmonization of glycated hemoglobin in Japan: From Japan Diabetes Society to National Glycohemoglobin Standardization Program values. J Diabetes Investig, 2012; 3: 39-40 [DOI] [PMC free article] [PubMed] [Google Scholar]
- 26). Nasir K, Shaw LJ, Liu ST, Weinstein SR, Mosler TR, Flores PR, Flores FR, Raggi P, Berman DS, Blumenthal RS, Budoff MJ: Ethnic differences in the prognostic value of coronary artery calcification for all-cause mortality. J Am Coll Cardiol, 2007; 50: 953-960 [DOI] [PubMed] [Google Scholar]
- 27). Greenland P, Bonow RO, Brundage BH, Budoff MJ, Eisenberg MJ, Grundy SM, Lauer MS, Post WS, Raggi P, Redberg RF, Rodgers GP, Shaw LJ, Taylor AJ, Weintraub WS: ACCF/AHA 2007 clinical expert consensus document on coronary artery calcium scoring by computed tomography in global cardiovascular risk assessment and in evaluation of patients with chest pain: a report of the American College of Cardiology Foundation Clinical Expert Consensus Task Force (ACCF/AHA Writing Committee to Update the 2000 Expert Consensus Document on Electron Beam Computed Tomography) developed in collaboration with the Society of Atherosclerosis Imaging and Prevention and the Society of Cardiovascular Computed Tomography. J Am Coll Cardiol, 2007; 49: 378-402 [DOI] [PubMed] [Google Scholar]
- 28). Hanley JA, Negassa A, Edwardes MD, Forrester JE: Statistical analysis of correlated data using generalized estimating equations: an orientation. Am J Epidemiol, 2003; 157: 364-375 [DOI] [PubMed] [Google Scholar]
- 29). Chuang ML, Gona P, Oyama-Manabe N, Manders ES, Salton CJ, Hoffmann U, Manning WJ, O'Donnell CJ: Risk factor differences in calcified and noncalcified aortic plaque: the Framingham Heart Study. Arterioscler Thromb Vasc Biol, 2014; 34: 1580-1586 [DOI] [PMC free article] [PubMed] [Google Scholar]
- 30). Allison MA, Criqui MH, Wright CM: Patterns and risk factors for systemic calcified atherosclerosis. Arterioscler Thromb Vasc Biol, 2004; 24: 331-336 [DOI] [PubMed] [Google Scholar]
- 31). Jiang CQ, Xu L, Lam TH, Thomas GN, Zhang WS, Cheng KK, Schooling CM: Alcohol consumption and aortic arch calcification in an older Chinese sample: the Guangzhou Biobank Cohort Study. Int J Cardiol, 2013; 164: 349-354 [DOI] [PubMed] [Google Scholar]
- 32). Shirakawa T, Yamagishi K, Yatsuya H, Tanabe N, Tamakoshi A, Iso H: Alcohol consumption and mortality from aortic disease among Japanese men: The Japan Collaborative Cohort study. Atherosclerosis, 2017; 266: 64-68 [DOI] [PubMed] [Google Scholar]
- 33). Culic V: Re: “Alcohol consumption, binge drinking, and early coronary calcification: findings from the Coronary Artery Risk Development in Young Adults (CARDIA) Study”. Am J Epidemiol, 2005; 162: 391-392 [DOI] [PubMed] [Google Scholar]
- 34). Vliegenthart R, Oei HH, van den Elzen AP, van Rooij FJ, Hofman A, Oudkerk M, Witteman JC: Alcohol consumption and coronary calcification in a general population. Arch Intern Med, 2004; 164: 2355-2360 [DOI] [PubMed] [Google Scholar]
- 35). McClelland RL, Bild DE, Burke GL, Mukamal KJ, Lima JA, Kronmal RA: Alcohol and coronary artery calcium prevalence, incidence, and progression: results from the Multi-Ethnic Study of Atherosclerosis (MESA). Am J Clin Nutr, 2008; 88: 1593-1601 [DOI] [PMC free article] [PubMed] [Google Scholar]
- 36). Yang T, Doherty TM, Wong ND, Detrano RC: Alcohol consumption, coronary calcium, and coronary heart disease events. Am J Cardiol, 1999; 84: 802-806 [DOI] [PubMed] [Google Scholar]
- 37). Odink AE, van der Lugt A, Hofman A, Hunink MG, Breteler MM, Krestin GP, Witteman JC: Risk factors for coronary, aortic arch and carotid calcification; The Rotterdam Study. J Hum Hypertens, 2010; 24: 86-92 [DOI] [PubMed] [Google Scholar]
- 38). Kuller LH, Matthews KA, Sutton-Tyrrell K, Edmundowicz D, Bunker CH: Coronary and aortic calcification among women 8 years after menopause and their premenopausal risk factors : the healthy women study. Arterioscler Thromb Vasc Biol, 1999; 19: 2189-2198 [DOI] [PubMed] [Google Scholar]
- 39). Oei HH, Vliegenthart R, Hofman A, Oudkerk M, Witteman JC: Risk factors for coronary calcification in older subjects. The Rotterdam Coronary Calcification Study. Eur Heart J, 2004; 25: 48-55 [DOI] [PubMed] [Google Scholar]
- 40). Allison MA, Wright CM: Age and gender are the strongest clinical correlates of prevalent coronary calcification (R1). Int J Cardiol, 2005; 98: 325-330 [DOI] [PubMed] [Google Scholar]
- 41). Hoff JA, Daviglus ML, Chomka EV, Krainik AJ, Sevrukov A, Kondos GT: Conventional coronary artery disease risk factors and coronary artery calcium detected by electron beam tomography in 30,908 healthy individuals. Ann Epidemiol, 2003; 13: 163-169 [DOI] [PubMed] [Google Scholar]
- 42). Reilly MP, Wolfe ML, Localio AR, Rader DJ: Coronary artery calcification and cardiovascular risk factors: impact of the analytic approach. Atherosclerosis, 2004; 173: 69-78 [DOI] [PubMed] [Google Scholar]
- 43). Fujiyoshi A, Sekikawa A, Shin C, Masaki K, David Curb J, Ohkubo T, Miura K, Kadowaki T, Kadowaki S, Kadota A, Edmundowicz D, Shah A, Evans RW, Bertolet M, Choo J, Willcox BJ, Okamura T, Maegawa H, Murata K, Kuller LH, Ueshima H: A cross-sectional association of obesity with coronary calcium among Japanese, Koreans, Japanese Americans, and U.S. whites. Eur Heart J Cardiovasc Imaging, 2013; 14: 921-927 [DOI] [PMC free article] [PubMed] [Google Scholar]
- 44). Schulte H, Cullen P, Assmann G: Obesity, mortality and cardiovascular disease in the Munster Heart Study (PROCAM). Atherosclerosis, 1999; 144: 199-209 [DOI] [PubMed] [Google Scholar]
- 45). Jenny NS, Brown ER, Detrano R, Folsom AR, Saad MF, Shea S, Szklo M, Herrington DM, Jacobs DR, Jr.: Associations of inflammatory markers with coronary artery calcification: results from the Multi-Ethnic Study of Atherosclerosis. Atherosclerosis, 2010; 209: 226-229 [DOI] [PMC free article] [PubMed] [Google Scholar]
- 46). Nagasawa SY, Ohkubo T, Masaki K, Barinas-Mitchell E, Miura K, Seto T, El-Saed A, Kadowaki T, Willcox BJ, Edmundowicz D, Kadota A, Evans RW, Kadowaki S, Fujiyoshi A, Hisamatsu T, Bertolet MH, Okamura T, Nakamura Y, Kuller LH, Ueshima H, Sekikawa A: Associations between Inflammatory Markers and Subclinical Atherosclerosis in Middle-aged White, Japanese-American and Japanese Men: The ERA-JUMP Study. J Atheroscler Thromb, 2015; 22: 590-598 [DOI] [PMC free article] [PubMed] [Google Scholar]
- 47). Tintut Y, Demer LL: Recent advances in multifactorial regulation of vascular calcification. Curr Opin Lipidol, 2001; 12: 555-560 [DOI] [PubMed] [Google Scholar]
- 48). El-Saed A, Curb JD, Kadowaki T, Okamura T, Sutton-Tyrrell K, Masaki K, Seto TB, Takamiya T, Choo J, Edmundowicz D, Evans RW, Fujiyoshi A, Nakamura Y, Miura K, Shin C, Kuller LH, Ueshima H, Sekikawa A: The prevalence of aortic calcification in Japanese compared to white and Japanese-American middle-aged men is confounded by the amount of cigarette smoking. Int J Cardiol, 2013; 167: 134-139 [DOI] [PMC free article] [PubMed] [Google Scholar]
- 49). Abbott RD, Ueshima H, Rodriguez BL, Kadowaki T, Masaki KH, Willcox BJ, Sekikawa A, Kuller LH, Edmundowicz D, Shin C, Kashiwagi A, Nakamura Y, El-Saed A, Okamura T, White R, Curb JD: Coronary artery calcification in Japanese men in Japan and Hawaii. Am J Epidemiol, 2007; 166: 1280-1287 [DOI] [PMC free article] [PubMed] [Google Scholar]
- 50). Ohmoto-Sekine Y, Yanagibori R, Amakawa K, Ishihara M, Tsuji H, Ogawa K, Ishimura R, Ishiwata S, Ohno M, Yamaguchi T, Arase Y: Prevalence and distribution of coronary calcium in asymptomatic Japanese subjects in lung cancer screening computed tomography. J Cardiol, 2016; 67: 4. [DOI] [PubMed] [Google Scholar]