Abstract
BACKGROUND:
Pharmacological therapy in the management of OA causes many new health problems due to side effects caused by long-term use of drugs, such as long-term use of Non-Steroidal Anti-Inflammatory Drugs (NSAIDs) will cause gastric ulcers and impaired kidney function. In OA pathogenesis, PGE2 gene is involved in the inflammation process.
AIM:
This study aims to identify the influence of Wharton Jelly Mesenchymal Stem Cell (MSC-WJ) on PGE2 expression gene in synoviocyte by in vitro.
MATERIAL AND METHODS:
The method used in this study is the co-culture method of primary cells and stem cells in the appropriate media. This research is pure experimental research. The sample used came from synovial tissue of osteoarthritis patients who underwent Total Knee Replacement (TKR) surgery. This study was divided into 6 groups treated with 4 replications. The expression analysis of the Prostaglandin E2 gene was done using qPCR (Real-Time Polymerase Chain Reaction). The expression analysis of the Prostaglandin E2 gene was carried out before and after the co-culture with Wharton’s Jelly and continued with the analysis of statistical data processing using the SPSS.15 program. PGE2 gene expression data were processed using the Kruskal-Wallis test and continued with the Mann-Whitney test with a 95% confidence level.
RESULTS:
The results showed that Mesenchymal Stem Cells Wharton Jelly could reduce the expression of Prostaglandin E2 gene after co-culture for 24 hours and 48 hours in synoviocyte cells osteoarthritis significantly compared with the control group. The administration of Mesenchymal Stem Cells for 24 hours reduced the expression level of PGE2 gene by 0.61 times compared to the control group (p < 0.05) and the administration of Mesenchymal Stem Cells for 48 hours decreased the expression level of PGE2 gene by 0, 47 times compared to the control group (p < 0.05).
CONCLUSION:
This study concluded that MSC-WJ in OA synoviocyte significantly reduced the expression of the PGE2 gene (p < 0.05).
Keywords: Co-culture, Prostaglandin E2, Mesenchymal Stem Cells
Introduction
According to the American College of Rheumatology, osteoarthritis is a heterogeneous condition in the joints characterized by the process of degradation, repair, and inflammation that occurs in the connective tissue, the vulnerable layer of joints, synovium, and subchondral bone. According to the World Health Organization (WHO) in 2004, the prevalence of osteoarthritis sufferers in the world reached 151.4 million and around 27.4 million people in the Southeast Asia region [1].
At the molecular level, an imbalance between catabolic and anabolic activity in which the major injury response occurs in joint cartilage results in osteoarthritis. When the pro-inflammatory response occurs in the cartilage, some types of prostanoid enzymes such as cyclooxygenase (COX) will be produced and released in excessive amounts. Cyclooxygenase activation will increase the production of MMP, inhibit the expression of Prostaglandin E2 (PGE2) and collagen genes and will stimulate the apoptosis process.
Studies conducted by Hardi et al., (2002) and Shimpo et al., (2009) have analyzed the role of PGE2 in chondrocytes. Pro-inflammatory cytokines IL-1β stimulate and produce PGE2 in large quantities, and this will induce the degradation process of osteoarthritis [2], [3]. Molecularly, IL-1β will increase the expression of the cyclooxygenase 2 (COX-2) gene and prostaglandin E synthase-1 (mPGE-1) microsomal at mRNA and protein levels. So an increase in PGE2 production is related to mPGES-1 and COX-2 derivatives from osteoarthritis chondrocytes stimulated by IL-1β. A better understanding of the pathogenesis of OA has recently been obtained, among others, thanks to increased knowledge about joint-prone biochemistry and molecular biology, which is expected to be able to manage OA patients with a variety of more appropriate and safer therapies. Therapy that can cure osteoarthritis with satisfactory results has not been found to date. There are limitations in terms of joint cartilage availability, difficulties in isolation, expansion of chondrocytes and differentiation of chondrocytes isolated in culture making cell-based OA therapy change to the use of Mesenchymal Stem Cells (MSC) which can be a potential source of cells for cartilage repair [4]. Mesenchymal Stem Cells (MSC) have been considered as alternative promising cell sources for cartilage repair. Stem cells or stem cells are stem cells that can form new cells. Wharton’s Jelly is one type of Mesenchymal Stem Cells that can differentiate into chondrocytes which are the main joint-prone cells that are very necessary for the treatment of osteoarthritis, where cartilage tissue is damaged or worn.
Based on the description above, the use of stem cells derived from Wharton Jelly Mesenchymal Stem Cells can be used as an alternative for the treatment of osteoarthritis; the authors are interested in conducting in vitro studies of mesenchymal stem cells against cells that are isolated directly from the synovial tissue and fluid of OA patients. In synovial tissue, it contains pro and anti-inflammatory factors, so co-culture of OA cells with mesenchymal stem cells will reduce proinflammatory factors and increase anti-inflammatory factors which in turn will indicate improvements made by cells. Stem cells to osteoarthritis cells.
Material and Method
This study was a pure experimental study which was divided into 6 treatment groups with 4 number of replications. Group I was an Osteoarthritis synoviocyte cell (OA) control group which was incubated for 24 hours, group II was an OA synoviocyte cell control group which was incubated for 48 hours, group III was a Mesenchymal Stem Cell Wharton Jelly (MSC-WJ) group incubated for 24 hour, group IV was incubated for 48 hours in Mesenchymal Stem Cell Wharton Jelly (MSC-WJ) group, group V was synoviocyte-MSC-WJ cell co-culture group which was incubated for 24 hours and group VI was cell co-culture group synoviocytes-MSC-WJ incubated for 48 hours. The number of cells used in each treatment group was 105 cells, each for synoviocyte and MSC-WJ cells. Mesenchymal Stem Cell Wharton Jelly comes from IMERI (Indonesian Medical Education and Research Institute) Faculty of Medicine, University of Indonesia. Synoviocyte cells are derived from synovial tissue of grade IV Osteoarthritis undergoing Total Knee Replacement surgery at Dr. M. Djamil Padang, Indonesia. The synoviocyte cells taken for treatment are the results of the 3rd phase cell culture.
Isolation of OA primary cells
Synovial tissue and search are obtained from OA patients after Total Knee Replacement (TKR). Ten samples were used for experiments. Synovial tissue is planted in the well plate with 10% Fetal Bovine Serum (FBS), 1% penicillin/streptomycin and 1% fungizone in Dulbecco’s Modified Eagle’s Medium (DMEM, Life Technologies) which is planted with an explant planting system. Cells were sub-cultured three times, and the result of 3rd sub-culture was used for treatment. Each experiment was repeated for three times.
Coculture of stem cells with OA primary cells
OA primary cells were cultured with 50–60% confluence, then cultured together with mesenchymal stem cells from Wharton Jelly. The cells were observed for 24 and 48 hours and calculated with Haemocytometer with 105 cells/well.
RNA extraction and cDNA synthesis
RNA was extracted from the isolates of synovial tissue grade IV from OA patients with TRIzol® (Invitrogen, USA) according to manufacture’s protocol. The quantity of RNA was calculated by NanoDrop. Synthesis of cDNA was performed by using iScript cDNA Syntesis Kit (BioRad, USA) on thermal cycler C1000 (BioRad, USA) Reverse Transcriptase PCR (RT-PCR) devices. The reaction of cDNA synthesis was 5 μg total RNA, 1 x RT buffer, 20 pmol oligodT, 4 mM dNTP, 10 mM DTT, 40 U TMII RTase and H2O-DEPC SuperScript enzymes with a total volume of 20 μl. The cDNA synthesis was performed at 52°C for 50 min according to the manual kit protocol (Biorad, USA).
PCR Gradient Amplification
DNA was amplified with SYBR Green amplification kits. The PCR program was 95°C pre-denaturation for 30 sec, followed by 5-sec denaturation, gradient annealing at 55°C for 5 sec for 50 cycles, additional melting curve 65-95°C with an increase of 0.5°C every 5 sec.
Measurement of gene concentration
The measurement of gene concentration in this study was the relative quantification method [5].
ΔCT experiment = CT experiment target –experiment housekeeping
ΔCT control = CT control target –control housekeeping
ΔΔCT experiment = ΔCT experiment – ΔCTcontrol
The comparison of gene expression levels = 2ΔΔCT. The measurement of gene concentration was by using LightCycler® software program referred to Livak formula (concentration in picogram size).
Statistical analysis
Data will be presented in the form of tables and graphs, as well as the results of the expression of the PGE2 gene. In the PGE2 gene expression level, data normality test was performed using the Shapiro Wilk Test and data homogeneity with the Levene Test. Criteria for testing decisions on the Shapiro Wilk Test that is if the p-value > 0.05 then said the data is normally distributed, while the decision criteria in the Levene Test is if the value of p > 0.05, then the data is said to be homogeneous. For the PGE2 gen expression, the data is not normally distributed and homogeneous, so the non-parametric Kruskal Wallis test is carried out and continued with the Mann Whitney Test [6]. Data is processed using SPSS 15 statistical analysis.
Research Ethics
This study was already passed the ethics clearance and has been approved by the Ethics Committee of the Faculty of Medicine, Andalas University, Padang with registration number: 550/KEP/FK/2017 (Attached).
Results
Sample Characteristics
The result of isolation of synoviocyte cells obtained from synovial tissue is a fibroblast-shaped cell grown in a culture medium on a plate. Synovial cell morphology is presented in Figure 1. In each passage, a uniform cell morphology with cell shape is like fibroblast cells, has a nucleus located in the middle and attaches to the base of the plate containing the medium.
Figure 1.
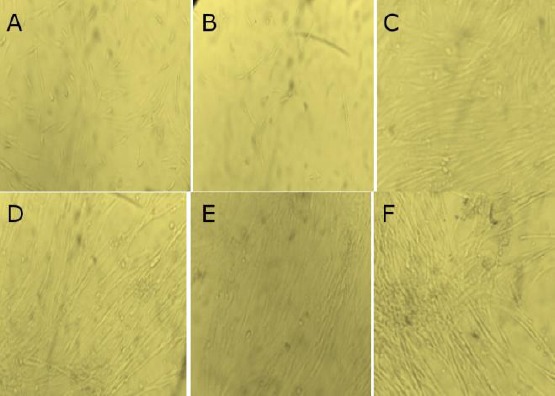
Morphology cells; A) 24-hour synoviocyte cell; B) 48-hour synoviocyte cell; C) MSC-WJ 24 hours; D) MSC-WJ 48 hours; E) synoviocyte co-culture MSC-WJ 24 hours; F) synoviocyte co-culture MSC-WJ 48 hours
Real-time PCR Optimization of PGE2 gene
From the results of the optimization on Real-time PCR obtained graphical form as shown in Figure 2.
Figure 2.
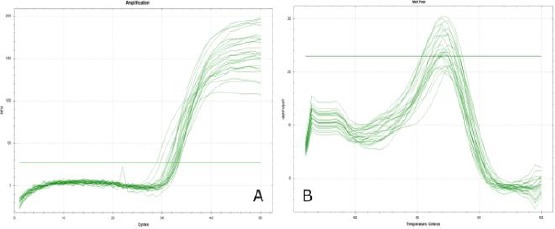
Graph of QPCR primary optimization results of PGE2 gene; A) Graph of amplification curve results on qPCR; B) Homogeneous melting peak graphs from the results of qPCR
From Figure 2 it can be seen that on the amplification curve on qPCR 50 cycles, the PGE2 target gene is amplified with both Figure 2 (A) and from the melting peak graph Figure 2 (B) shows a 1 peak curve that clearly shows that from the optimization results PGE2 gene primer obtained sharp and homogeneous peaks. This proves that the primers used are specific primers. To confirm the results of this optimization, the electrophoresis method was done on 0.5% agarose gel loaded with 1 x TBE. After optimization using real-time PCR, then electrophoresis is done to see the optimized primary base pass as shown in Figure 3.
Figure 3.
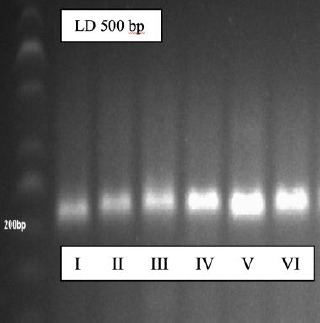
The results of electrophoresis of the PGE2 gene
From these results it was found that the PGE2 primer was specific; this was marked by a single ribbon print during electrophoresis. To ensure qPCR is carried out and from data sequencing, it is found that the PGE2 primer is specific at 203 bp.
Expression of PGE2 Gene
From the results of the research obtained, before the analysis is carried out, a preliminary test is carried out for the basic assumptions of normality and homogeneity of the data (Appendix 3). The results of the normality test with the Shapiro Wilk Test obtained a significant value of > 0.05 in all treatment groups, meaning that the data was normally distributed. To test variant homogeneity based on the Levene Test is 0.03 < 0.05, this means that the PGE2 gene research data has not a homogeneous variant. Because of the results of the preliminary test, the data is normally distributed and not homogeneous, so the data is processed by the Kruskal Wallis test and continued with the Mann Whitney Test (p < 0.05)
From Figure 4 in the box-plot diagram, it can be seen that homogeneously distributed data is seen from the median value in the diagram that is located in the middle, but from the results of the Levene, Test results are not homogeneous (p ≤ 0.05).
Figure 4.
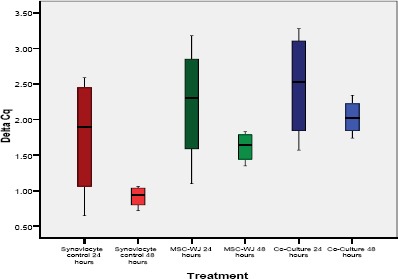
PGE2 expression in various treatment groups (box-plot diagrams with median values)
If seen from Table 3 and Figure 5 it appears that the PGE2 gene expression from the lowest to the highest obtained results in a row is in group VI, followed by groups V, IV and III, while for group I and II the expression level is the highest which is used as a standard PGE2 expression.
Table 1.
Primer Design
| No. Primer Nucleotide Sequence | NM NCBI Accession Number Gene |
Amplicon Size |
|---|---|---|
| 1. PGE-2 F 5’-TCAAGATGTACGTGGTGGCC-3’ | NM_004878.4 | 203 bp |
| 2. PGE-2 R 5’-CAGAAAGGAGTAGACGAAGCC-3’ | NM_004878.4 | 203 bp |
| 3. HPRT1 5’-CCTGGCGTCGTGATTAGTGAT-3’ | NM_000194.2 | 158 bp |
| 4. HPRT1 5’-CCCATCTCCTTCATCACATCTC-3’. | NM_000194.2 | 158 bp |
Table 2.
Effect of Mesenchymal Stem Cell on PGE2 gene expression levels in osteoarthritis synoviocyte cells
| Groups | Gene expression | |
|---|---|---|
| average | Assymp Sig | |
| 24 hours-synoviocyte control | 1,00 ± 0,00 | 0,00 |
| 48 hours-synoviocyte control | 1,00 ± 0,00 | |
| 24 hours-MSC-WJ | 0,73 ± 0,01 | |
| 48 hours-MSC-WJ | 0,62 ± 0,01 | |
| 24 hours Co-Culture | 0,61 ± 0,02 | |
| 48 hours Co-Culture | 0,47 ± 0,01 | |
Table 3.
Analysis of the influence of Wharton Jelly Mesenchymal Stem Cell on PGE2 gene expression
| Groups | PGE2 gene expression (ng/µl) | |||||
|---|---|---|---|---|---|---|
| I | II | III | IV | V | VI | |
| I | - | 1.00 | 0.01 | 0.01 | 0.01 | 0.01 |
| II | 1.00 | - | 0.01 | 0.01 | 0.01 | 0.01 |
| III | 0.01 | 0.01 | - | 0.02 | 0.02 | 0.02 |
| IV | 0.01 | 0.01 | 0.02 | - | 1.00 | 0.04 |
| V | 0.01 | 0.01 | 0.02 | 1.00 | - | 0.02 |
| VI | 0.01 | 0.01 | 0.02 | 0.04 | 0.02 | - |
*) significantly difference (p < 0,05); I = 24-hour synoviocyte control group; II = 48-hour synoviocyte control group; III = 24 hours Mesenchymal Stem Cell Wharton Jelly (MSC-WJ); IV = 48 hours of Mesenchymal Stem Cell Wharton Jelly (MSC-WJ); V = Synoviocyte Co-Culture Group-24 hours MSC-WJ; VI = 48-hour synoviocyte co-culture group-MSC-WJ.
Figure 5.
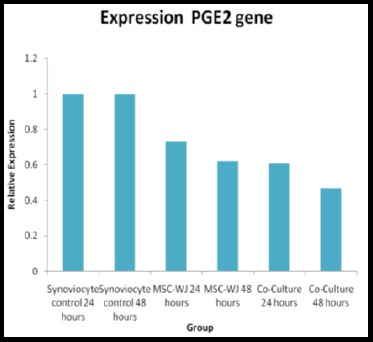
Histogram level of PGE2 gene expression in various treatment groups
From Table 3 it can be seen that there are significant differences in PGE2 gene expression between group I with groups II, III, IV, V and VI (p < 0.05), meaning that there are significant differences in PGE2 gene expression between synoviocyte control groups 24 hours with 48-hour synoviocyte control group 24 hours and 48 hours MSC-WJ control group 24 hours and 48 hours co-culture group. The expression of PGE2 gene between group II and group III, IV, V and VI found a significant difference (p < 0.05), where from the calculation of the Livak-Schmittgen Formula (2011) it was found that gene expression in group II was higher than groups III, IV, V and VI as shown in Table 3. PGE2 gene expression between group III and the group I, II, IV, V, and VI found significant differences (p < 0.005), where the value of gene expression in group III was greater than in groups IV, V and VI.
The expression of the PGE2 gene between group IV and group V had no significant difference (p > 0.05), although the expression level in group IV was higher compared to group V (Table 3). For group IV, when compared with groups I, II, III and VI from the Mann Whitney test results there was a significant difference (p < 0.05) with a higher expression level in group IV compared to group V and VI. The expression level between groups V and VI found a significant difference (p < 0.05) with group V expression values higher than group VI.
Discussion
Sample Characteristics
Synoviocyte cells are fibroblast-shaped cells grown in a culture medium on a plate. In each passage in various treatment groups, uniform cell morphology with cell shape such as fibrous cells is obtained, having a nucleus located in the middle and attached to the base of the plate containing the medium. According to Shikichi et al., (2000), the synovial membrane consists of a superficial layer containing two to three layers of cells below it called synovial intima. In the part of the synovial membrane cavity, there are thick intima cells and subintima which function as a link between tissues and are rich in blood vessels [7]. The main function of the synoviocytes that make up the synovium membrane is to provide various molecules of lubricants such as glycosaminoglycans, oxygen, and plasma proteins, nutrients for joint spaces and susceptibility to joints and chondrocytes [8]. Synovial cell morphology before and after treatment had similar characteristics, both in the synoviocyte control group, in the control group, and after synoviosit co-culture and Mesenchymal Stem Cell Wharton Jelly (MSC-WJ) treatment.
Synoviocyte cells morphologically, including fibroblast cells (fibroblast-like synoviocyte) are bipolar or multipolar cells, having a long and growing cell shape attached to the substrate. Fibroblasts Like Synoviocyte can be cultured from synovial tissue of TKR (Total Knee Replacement), synovectomy or synovial biopsy. After being digested with the collagenase enzyme, the cells attached to the flash are composed of synovial fibroblasts and synovial macrophages. Fibroblast Like Synoviocyte proliferation can be repeated up to the third passage, which in this condition contains 95% homogeneous cells. The use of fibroblast-like synoviocyte after the 9th post is not recommended anymore because there has been a decline in cell quality [9].
Mesenchymal Stem Cells (MSCs) are adult stem cells that have morphology such as fibroblasts (fibroblast-like) and the ability to differentiate MSCs into several types of connective tissue cells that make these cells as candidates for cell sources in the treatment of tissue regeneration [10]. From the results of the study, morphological images of culture synoviocytes were very similar to Mesenchymal Stem Cell Wharton Jelly, because these two cells are fibroblast-like cells. Another great advantage of this cell culture is cell homogeneity which appears in the morphological picture of the two types of cells cultured. According to Listyorini (2001), a measure of success that can be used in making this cell culture is the absence of contamination in culture and cell success in multiplying. The advantage of cell culture is that it is easily homogeneous, easy to characterize, easily controlled at certain temperatures, osmotic pressure and pH [11].
PGE2 gene expression
Based on the research that has been done, it can be seen that the lowest regulated PGE2 gene in group VI which is the treatment group of synoviocyte cell and MSC-WJ co-culture for 48 hours is by the initial hypothesis that Wharton Jelly Mesenchymal Stem Cell can reduce expression from the PGE2 gene. The expression of the PGE2 gene in the 48-hour synoviocyte cell and MSC-WJ co-culture treatment group decreased by 0.47 times PGE2 was relatively lower compared to the control group, whereas in group V which was the treatment group of synoviocyte cell co-culture and MSC-WJ for 24 hours decreased by 0.61 times PGE2 was relatively lower compared to the control group.
There are several related studies that can explain the results of this study. At the time of the inflammatory process, the PGE2 gene which is a gene that plays a role in the inflammatory response to the pathogenesis of osteoarthritis. Activation of the PGE2 gene involves the role of NFKβ as a cytokine regulating the occurrence of an inflammatory response, activation of NFKβ will trigger the expression of genes that induce articular joint damage resulting in osteoarthritis. This is in line with the results of this study that the high ΔCq value of the PGE2 gene in the osteoarthritis synoviocyte control group will decrease the expression of the PGE2 gene [12]. The results of the 24-hour MSC-WJ group also showed high PGE2 expression levels; this is in line with recent studies that show that prostaglandin E2 enzymes play a role in the process of self-renewal of MSC-WJ [13]. During the differentiation process from MSC, there will be an increase in PGE2 gene activity and expression. In a study conducted by Lu et al., (2017) it was reported that there was an increase in PGE2 gene expression during the differentiation process of human Mesenchymal Stem Cells. From the results of incubation for 24 hours in vitro showed significant migration from MSC compared to the control group. This shows that PGE2 is one of the cytokines needed by MSC in the differentiation process [14].
The Human Mesenchymal Stem Cell is a promising and potential agent in cell therapy. MSC is a progenitor cell that can differentiate into osteoblasts and contribute to modulate the immune response in bone regeneration therapy [15], [16], [17], [18]. The results of PGE2 gene expression in the synoviocyte co-culture group and 48 hours of MSC-WJ were significantly lower compared to 24-hour synoviocyte and MSC-WJ co-culture groups. This can be caused by the effect of the immunomodulatory effect of MSC-WJ which has begun to work on osteoarthritis synoviocyte cells which begin to control PGE2 gene expression. This is consistent with the results of a study which states that bone marrow-derived Mesenchymal Stem Cells can modulate the effects of proinflammatory cytokines on human corneal epithelial cells [19]. According to research Ryan et al., (2014) Mesenchymal Stem Cell immunomodulation effects can reduce the expression level of prostaglandin E2 gene after co-culture in vitro at a dose of 2 x 10⁶ cell/well [20]. The results of this study reinforce previous research conducted by Bull et al., (2012) which stated that the Mesenchymal Stem Cells effect on cartilage cell explants taken from grade IV knee osteoarthritis patients could reduce the expression level of prostaglandin E2 gene by 50% relative to the control group. after incubation for 48 hours [21]. This study can explain the influence of Mesenchymal Stem Cells Wharton Jelly on osteoarthritis synoviocyte cells through PGE2 gene expression parameters which play an important role in the inflammatory process in the pathogenesis of osteoarthritis. In general, MSC-WJ can reduce PGE2 gene expression which is a proinflammatory cytokine in osteoarthritis. The results of this study can also be useful as a reference for the use of stem cells, especially MSC-WJ as a promising osteoarthritis therapy in the future.
The results showed that there was no effect of Mesenchymal Stem Cells on synoviocyte cell morphology in all treatment groups and Mesenchymal Stem Cells Wharton Jelly can reduce the expression of prostaglandin E2 gene after co-culture for 24 hours and 48 hours in synoviocyte cells osteoarthritis significantly compared with the control group. The administration of Mesenchymal Stem Cells for 24 hours reduced the expression level of PGE2 gene by 0.61 times compared to the control group (p < 0.05) and the administration of Mesenchymal Stem Cells for 48 hours decreased the expression level of PGE2 gene by 0.47 times compared to control group (p < 0.05).
Acknowledgment
The authors thank Dr. Rizki Rahmadian, SpOT (K), M. Kes, Dr. Hirowati Ali, Ph.D., Andalas Cancer Research Center and Stem Cell (ACRC) and Biomedical Laboratory, Faculty of Medicine, Andalas University and Indonesian Medical Education and Research Institute (IMERI), Faculty of Medicine, University of Indonesia.
Footnotes
Funding: This research did not receive any financial support
Competing Interests: The authors have declared that no competing interests exist
References
- 1.WHO. The global burden of disease 2004 Up-date. Switzerland: WHO Press 2004; 2004. [Google Scholar]
- 2.Hardy MM, Seibert K, Manning PT, Currie MG, Woerner BM, Edwards D, Koki A, Tripp CS. Cyclooxygenase 2?dependent prostaglandin E2 modulates cartilage proteoglycan degradation in human osteoarthritis explants. Arthritis & Rheumatism: Official Journal of the American College of Rheumatology. 2002;46(7):1789–803. doi: 10.1002/art.10356. https://doi.org/10.1002/art.10356 PMid:12124863. [DOI] [PubMed] [Google Scholar]
- 3.Shimpo H, Sakai T, Kondo S, Mishima S, Yoda M, Hiraiwa H, et al. Regulation of prostaglandin E2 synthesis in cells derived from chondrocytes of patients with osteeoarthritis. Journal of Orthopaedic Science. 2009;15:611–617. doi: 10.1007/s00776-009-1370-7. https://doi.org/10.1007/s00776-009-1370-7 PMid:19802674. [DOI] [PubMed] [Google Scholar]
- 4.Demoor M, Ollitrault D, Gomez-Leduc T, Bouyoucef M, Hervieu M, Fabre H, Lafont J, Denoix JM, Audigie F, Mallein-Gerin F, Legendre F. Cartilage tissue engineering:molecular control of chondrocyte differentiation for proper cartilage matrix reconstruction. Biochimica et Biophysica Acta (BBA)-General Subjects. 2014;1840(8):2414–40. doi: 10.1016/j.bbagen.2014.02.030. https://doi.org/10.1016/j.bbagen.2014.02.030 PMid:24608030. [DOI] [PubMed] [Google Scholar]
- 5.Livak KJ, Schmittgen TD. Analysis of relative gene expression data using real-time quantitative PCR and the 2? ΔΔCT method. methods. 2001;25(4):402–8. doi: 10.1006/meth.2001.1262. https://doi.org/10.1006/meth.2001.1262 PMid:11846609. [DOI] [PubMed] [Google Scholar]
- 6.Razali NM, Wah YB. Power comparison of Saphiro Wilk, Kolmogorov- Smirnov, Lilefors and Anderson Drling-test. Faculty of Computer and Mathematical Science, University Technology MARA. 2017 [Google Scholar]
- 7.Shikichi M, Kitamura HP, Yanase H, Konno A, Takahashi-Iwanaga H, Iwanaga T. Three-dimensional ultrastructure of synoviocytes in the horse joint as revealed by the scanning electron microscope. Arch Histol Cytol. 1999;62(3):219–29. doi: 10.1679/aohc.62.219. https://doi.org/10.1679/aohc.62.219 PMid:10495876. [DOI] [PubMed] [Google Scholar]
- 8.Felson DT. Osteoarthritis of the knee. NEJM. 2006;354:841–8. doi: 10.1056/NEJMcp051726. https://doi.org/10.1056/NEJMcp051726 PMid:16495396. [DOI] [PubMed] [Google Scholar]
- 9.Rosengren S, Boyle DL, Firestein GS. Acquisition, Culture and Phenotyping of Synovial Fibroblast. Methods in Molecular Medicine. 2007;135:365–75. doi: 10.1007/978-1-59745-401-8_24. https://doi.org/10.1007/978-1-59745-401-8_24 PMid:17951672. [DOI] [PubMed] [Google Scholar]
- 10.Trzaska KA, Kuzhikandathil EV, Rameshwar P. Specification of a dopaminergic phenotype from adult human mesenchymal stem cells. Stem Cells. 2007;25:2797–2808. doi: 10.1634/stemcells.2007-0212. https://doi.org/10.1634/stemcells.2007-0212 PMid:17656644. [DOI] [PubMed] [Google Scholar]
- 11.Listyorini D. Kultur Jaringan Hewan. FMIPA UM. 2001 [Google Scholar]
- 12.Tornatore L, Thotakura AK, Bennett J, Moretti M, Franzoso G. The nuclear factor kappa B signaling pathway:integrating metabolism with inflammation. Trends in cell biology. 2012;22(11):557–66. doi: 10.1016/j.tcb.2012.08.001. https://doi.org/10.1016/j.tcb.2012.08.001 PMid:22995730. [DOI] [PubMed] [Google Scholar]
- 13.Kota DJ, Prabhakara KS, Todelano FN, Bhattarai D, Chen Q, DiCarlo B, et al. Prostaglandin E2 indicates therapeutic efficacy of Mesenchymal Stem Cells In Experimental Traumatic Brain Injury. Stem Cells. 2017;35(5):1416–1430. doi: 10.1002/stem.2603. https://doi.org/10.1002/stem.2603 PMid:28233425. [DOI] [PubMed] [Google Scholar]
- 14.Xiaomin Lu, Jibin Han, Xiuping Xu, Jingyuan Xu, Ling Liu, et al. PGE2 Promotes the Migration of Mesenchymal Stem Cells throught the Activation of FAK and ERK1/2 Pathway. Stem Cells Int. 2017 doi: 10.1155/2017/8178643. 8178643. https://doi.org/10.1155/2017/8178643. [DOI] [PMC free article] [PubMed] [Google Scholar]
- 15.Kode JA, Mukherjee S, Joglekar MV, Hardikar AA. Mesenchymal stem cells:immunobiology and role in immunomodulation and tissue regeneration. Cytotherapy. 2009;11(4):377–91. doi: 10.1080/14653240903080367. https://doi.org/10.1080/14653240903080367 PMid:19568970. [DOI] [PubMed] [Google Scholar]
- 16.Stappenbeck TS, Miyoshi H. The role of stromal stem cells in tissue regeneration and wound repair. Science. 2009;324(5935):1666–9. doi: 10.1126/science.1172687. https://doi.org/10.1126/science.1172687 PMid:19556498. [DOI] [PubMed] [Google Scholar]
- 17.Alvarez-Viejo M, et al. Quantifying mesenchymal stem cells in the mononuclear cell fraction of bone marrow samples obtained for cell therapy. Trans Proc. 2013;45(1):434–439. doi: 10.1016/j.transproceed.2012.05.091. https://doi.org/10.1016/j.transproceed.2012.05.091 PMid:23375334. [DOI] [PubMed] [Google Scholar]
- 18.Deng P, Chen QM, Hong C, Wang CY. Histone methyltransferases and demethylases:regulators in balancing osteogenic and adipogenic differentiation of mesenchymal stem cells. International journal of oral science. 2015;7(4):197. doi: 10.1038/ijos.2015.41. https://doi.org/10.1038/ijos.2015.41 PMid:26674421 PMCid:PMC5153596. [DOI] [PMC free article] [PubMed] [Google Scholar]
- 19.Wen L, Zhu M, Petsoglou C. Differentiation and immunomodulatory effects of bone marrow-derived mesenchymal stem cells on human corneal epithelium. Chin J Cell Stem Cell. 2014;4(1):5–15. [Google Scholar]
- 20.Ryan AE, Lohan P, O'flynn L, Treacy O, Chen X, Coleman C, Shaw G, Murphy M, Barry F, Griffin MD, Ritter T. Chondrogenic differentiation increases antidonor immune response to allogeneic mesenchymal stem cell transplantation. Mol Ther. 2014;22(3):655–67. doi: 10.1038/mt.2013.261. https://doi.org/10.1038/mt.2013.261 PMid:24184966 PMCid:PMC3944342. [DOI] [PMC free article] [PubMed] [Google Scholar]
- 21.Van Buul GM, Villafuertes E, Bos PK, Waarsing JH, Kops N, Narcisi R, Weinans H, Verhaar JA, Bernsen MR, Van Osch GJ. Mesenchymal stem cells secrete factors that inhibit inflammatory processes in short-term osteoarthritic synovium and cartilage explant culture. Osteoarthritis and Cartilage. 2012;20(10):1186–96. doi: 10.1016/j.joca.2012.06.003. https://doi.org/10.1016/j.joca.2012.06.003 PMid:22771777. [DOI] [PubMed] [Google Scholar]


