

Summary
A minority of hand, foot and mouth disease (HFMD) caused by enterovirus A71 (EV‐A71) results in severe neural complications. However, whether monocyte‐mediated immunity is involved in the disease progression of HFMD remains unknown. One hundred and twenty mild and 103 severe HFMD patients were recruited and enzyme‐linked immunosorbent assay (ELISA), flow cytometry and Transwell culture were performed in the study. Peripheral monocyte counts were lower in both absolute counts and frequencies in severe cases compared to mild cases. After screening 10 monocyte‐related cytokines by ELISA, only monocyte chemoattractant protein‐1 (MCP‐1) was found at higher levels in sera of mild cases compared to those with severe symptoms. Monocytes purified from mild cases produced more MCP‐1 than the cells from severe patients when stimulated in vitro. We observed that immune exhaustion markers programmed death 1 (PD‐1) and programmed death ligand 1 (PD‐L1) were highly regulated on the surface of monocytes from severe cases compared to mild cases. PD‐L1 blockade induced a higher production of MCP‐1 in the supernatant of a Transwell system. The production of MCP‐1 also increased following PD‐L1 blockade of purified monocytes activated by granulocyte–macrophage colony‐stimulating factor (GM‐CSF) combined with R848 or EV‐A71 virus. Our results indicate that absolute count, frequency and levels of MCP‐1 secretion of peripheral monocytes, together with their immune status, probably contribute to differential disease prognosis in EV‐A71‐associated HFMD.
Keywords: enterovirus A71 (EV‐A71), hand, foot and mouth disease (HFMD), monocyte, monocyte chemoattractant protein‐1 (MCP‐1), programmed cell death‐1 (PD‐1)
Introduction
Enterovirus A71 (EV‐A71) is a non‐enveloped, single‐strand positive RNA virus, belonging to the Enterovirus genus of the family Picornaviridae 1. The prevalence of hand, foot and mouth disease (HFMD) caused by EV‐A71 has increased considerably in recent years, particularly in the Asia–Pacific region 1. It has diverse symptoms ranging from none in the majority of sufferers to fatality 2, 3, 4, 5. Severe HFMD is usually associated with neurological diseases, such as aseptic meningitis, acute flaccid paralysis, brainstem encephalitis and fulminant neurogenic pulmonary edema, all of which can result in high mortality, particularly in infants and young children 1, 6. However, the specific factors associated with these diversified clinical outcomes remains unclear 3, 5, 7, 8. It should also be noted that no vaccines are currently available for EV‐A71.
Monocytes, a component of the innate immune system, compose 2–10% of all leukocytes in humans and serve multiple roles in immune function. They migrate promptly from the bloodstream to sites of infection in tissues in response to inflammation signals, and can act as precursor cells that differentiate into macrophages or dendritic cells to participate directly in the immune response to a pathogen 9, 10. Many studies have indicated that systemic infection of microbial pathogens induces a robust innate immune response mediated primarily by monocytes, and cytokines secreted by monocytes have an important role in this response 11, 12. However, the influence of innate immunity and monocytes on HFMD caused by EV‐A71 is still unclear.
Given the short incubation period and the clinical features of EV‐A71‐induced HFMD, it seems reasonable to presume that host monocyte‐mediated innate immunity might be associated to some degree with different (mild or severe) disease progression. To test this possibility, this study focused on investigating the relationship between the immune characteristics of monocytes and the severity of disease symptoms in EV‐A71 induced HFMD.
Methods
Ethics statement
This study was approved by the Ethics Committees of Peking University Health Science Center. Informed consent was obtained from the patients involved in our study.
Study cohort
Two hundred and twenty‐three children hospitalized with HFMD caused by EV‐A71 were recruited at the Beijing Ditan Hospital between July 2013 and September 2014. All patients were aged between 1 month and 10 years and were separated into ‘severe’ (103 cases) and ‘mild’ (120 cases) groups according to the Hand, foot and mouth disease control and prevention guide (2008) and Hand, foot and mouth disease treatment guidelines (2008) published by the Ministry of Public Health of China 13, 14. No significant differences in age or sex were found between the two groups (Supporting information, Table S1). The mild cases manifested fever, reduced appetite and sore throat and mouth, vesicular rashes on hands, feet and buttocks and ulcers in the oral mucosa. The severe cases exhibited complications with varying degrees of central nervous system (CNS involvement) that caused symptoms such as myoclonus, ataxia, nystagmus, oculomotor palsies and bulbar palsy in various combinations, and/or respiratory distress with tachycardia, tachypnea and rales, with or without frothy sputum.
Routine whole blood screening was carried out according to the standard clinical diagnostic criteria established by Beijing Ditan Hospital. Absolute CD4+/CD8+ T cell counts were performed using standardized single platform counting technologies employing cytometric methods. All cytometric reagents were obtained from BD Biosciences (BD Biosciences, San Jose, CA, USA) and CD4+/CD8+ T cell counts were determined within 12 h by using a FACSCalibur (BD Biosciences). Stool specimens were collected from children diagnosed with HFMD and kept at –80°C until use. Viral RNA was extracted from the supernatant of 10% (v/v) stool specimens using the QIAamp Viral RNA Mini Kit (Qiagen, Hilden, Germany) and subjected to reverse transcription–polymerase chain reaction (RT–PCR), according to the manufacturer’s instructions (DAAN Gene, Guangzhou, China). The RT–PCR kit specifically detected PE, EV‐A71 and CVA16. The identification of EV‐A71 infection depended on the analysis of real‐time PCR data. In addition, peripheral blood mononuclear cells (PBMCs) from 35 severe cases and 35 mild cases were prepared at the start of patient hospitalization from fresh ethylenediamine tetraacetic acid (EDTA) anti‐coagulated peripheral blood using Histopaque‐1077 (Sigma, St Louis, MO, USA) and were stored (5 × 10⁶ cells per vial) in liquid nitrogen until used. Serum and EDTA anti‐coagulated plasma were stored at −80°C until use.
Isolation of monocytes
Untouched monocytes were enriched from PBMCs using a human monocyte isolation kitⅡ(Miltenyi Biotec, Auburn, CA, USA). In brief, monocytes were negatively isolated by depleting non‐monocytes [i.e. T cells, natural killer (NK) cells, B cells, dentritic cells and basophils] using a cocktail of biotin‐conjugated antibodies against CD3, CD7, CD16, CD19, CD56 and CD123 and glycophorin A), followed by anti‐biotin microbeads. The purity of monocytes obtained in this fashion was consistently greater than 95%.
Toll‐like receptor (TLR) ligands and EV‐A71 stimulation
The EV‐A71 isolate was obtained initially from the Beijing Center for Disease Control and Prevention. The viral genome was sequenced and the isolate designated BC08 (GenBank JQ514785) 15. Multiplicity of infection (MOI) represents the infection titer of separated EV‐A71 [1 × 50% tissue culture infective dose (TCID50) = 0·693 × MOI) and the working concentration of separated EV‐A71 was 0·053 μl/100 μl. Untouched monocytes were sorted using the human monocyte isolation KitⅡ (Miltenyi Biotec). Then, 1 × 10⁵ monocytes cells were resuspended in RPMI‐1640 medium supplemented with 10% fetal bovine serum (R10) and seeded in 96‐well plates. Cells were stimulated with 20 ng/ml granulocyte–macrophage colony‐stimulating factor (GM‐CSF) (Invivogen, San Diego, CA, USA), GM‐CSF + lipopolysaccharides (LPS, TLR‐4 agonist) (1 μg/ml; Invivogen), GM‐CSF + R848 (Resiquimod; TLR‐7/8 agonist) (10 μg/ml; Invivogen), GM‐CSF + EV‐A71 (0·5 MOI/200 μl) for 48 h. Culture supernatants were collected for cytokine detection.
Monocyte surface markers analysis
Isolated PBMCs (1 × 10⁵) from EV‐A71‐infected patients were settled in R10 medium and stained with antibodies against cell surface markers at room temperature for 30 min. The following monoclonal antibodies were used for monocyte phenotypical characterization: CD3‐ef450 (clone UCHT1), CD14‐phycoerythrin (PE) (clone M5E2), CD16‐allophycocyanin‐cyanin 7 (APC‐Cy7) (clone 3G8), CD80‐fluorescein isothiocyanate (FITC) (clone L307), CD86‐APC [clone 2331(FUN‐1)] and programmed death ligand 1 (PD‐L1)‐PE‐Cy7 (clone MIH1), PD‐1‐PE‐Cy7 (clone EH12) and human leukocyte antigen D‐related‐peridinin chlorophyll (HLA‐DR‐PerCp) (clone L243) (BD Biosciences). After staining, PBMCs were washed twice with fluorescence activated cell sorter (FACS) buffer and analyzed using a BD FACS Fortessa (BD Biosciences). The data were analyzed using FlowJo software, version 10.0.8 (TreeStar, Inc., San Carlos, CA, USA), and the mean fluorescence intensity (MFI) was adopted for the expression of the surface markers.
Cytokine detection
The levels of tumor necrosis factor (TNF)‐α, interleukin (IL)‐8, macrophage inflammatory protein (MIP)‐1α, MIP‐1β, monocyte chemoattractant protein (MCP)‐1, IL‐1β, IL‐1RA, IL‐6, interferon gamma‐induced protein (IP)‐10 and regulated upon activation, normal T cell expressed and secreted (RANTES) in plasma or cultured cell supernatants were analyzed using ELISA kits according to the manufacturer’s instructions (eBioscience, San Diego, CA, USA). The sensitivities of the ELISAs were 1·7 pg/ml for TNF‐α, 5 pg/ml for IL‐8, 16 pg/ml for MIP‐1α, 4 pg/ml for MIP‐1β, 7 pg/ml for MCP‐1, 2 pg/ml for IL‐1β, 4 pg/ml for IL‐1RA, 2 pg/ml for IL‐6, 2 pg/ml for IP‐10 and 4·2 pg/ml for RANTES.
Transwell membrane co‐culture system of PBMCs and RD cells
Transwell chambers (Corning, New York, NY, USA) were employed in the co‐culture system. The upper and lower cultures were separated by a 3·0 μm pore size polycarbonate membrane. Briefly, the lower compartment of the chamber was loaded with rhabdomyosarcoma (RD) cells (infected at an MOI of 5 with EV‐A71 for 2 h) and the upper chamber was loaded with PBMCs (1 × 10⁶ cells/well) + anti‐PD‐L1 functional grade; PBMCs (1 × 10⁶ cells/well) + isotype antibody (negative control) and medium alone (blank), respectively. R848 (an agonist for TLR‐7/8, activating the immune cells) and IL‐2 (maintaining the functions of PBMCs) were added to all the upper layers. The chambers were cultured in a humidified incubator with 5% CO2 at 37°C for 12 h.
Quantitative detection of the EV‐A71 RNA
Total RNA from RD cells was extracted using Trizol reagent (Invitrogen, Carlsbad, CA, USA). Then, cDNA was prepared using the RevertAid first‐strand cDNA synthesis kit (Thermo Scientific, Fremont, CA, USA). The level of EV‐A71 viral RNA was determined by real‐time RT–PCR using SYBR GreenⅠMaster Mix (Roche, Indianapolis, IN, USA) and detected using a LightCycler 480 Ⅱ real‐time PCR detection system (Roche). The primer sequences used for the EV‐A71 RT–PCR were as follows: viral protein 1 (VP1) forward: CACTCCAAGCTGCTGAAATTG and VP1 reverse: CCGCCCTACTGAAGAAACTATC.
Intracellular cytokine staining (ICS)
For ICS, frozen PBMCs were thawed at 37°C and subcultured overnight. PBMCs (2·5 × 106) were settled in 96‐well plates with R10 medium and incubated with GM‐CSF (20 ng/ml) + R848 (10 μg/ml) + anti‐PD‐L1 antibody (MIH1; eBioscience) [or mouse immunoglobulin (Ig)G1κ isotype antibody] or GM‐CSF (20 ng/ml) + EV‐A71 (0·5 MOI) + anti‐PD‐L1 antibody (or isotype antibody) for 6 h. Cells were then stained with antibodies against cell surface markers at room temperature for 30 min and treated with fixation buffer and permeabilization buffer for the next step of intracellular staining. The monoclonal antibodies against intracellular markers were added to the cells at room temperature for 1 h. The following monoclonal antibodies were used for ICS detection: CD3‐AF700 (clone UCHT1), CD14‐ef450 (clone 61D3) and MCP‐1‐PE (clone 5D3‐F7) (BD Biosciences). After staining, PBMCs were washed twice with FACS buffer and analyzed using a BD FACS Fortessa (BD Biosciences). The data were analyzed using FlowJo software, version 10.0.8 (TreeStar, Inc.).
PD‐L1 blockade on purified monocytes
Untouched monocytes were isolated from PBMCs of healthy donors as described above and treated by anti‐PD‐L1(B7‐H1) monoclonal antibody (MIH1; eBioscience) or mouse IgG1κ isotype control antibody for 6 h at 4°C. The monocytes were washed twice and adjusted to a concentration of 5 × 10⁶ cells per 100 μl in R10 medium. The monocytes were then co‐cultured with 20 ng/ml GM‐CSF and 0·5 MOI EV‐A71 or 10 µg/ml R848 into 96‐well tissue culture plates for 3 days. The culture supernatants were collected for MCP‐1 detection by ELISA.
Statistical analysis
All statistical analyses were performed using GraphPad Prism version 5.0 software (GraphPad Software Inc., San Diego, CA, USA). The data were expressed as the mean the mean ± standard deviation or as the median with the interquartile range where appropriate. Differences between groups were assessed using the non‐parametric Mann–Whitney U‐test and non‐parametric Wilcoxon matched‐pairs test; P‐values < 0·05 were considered statistically significant.
Results
The frequencies and absolute counts of peripheral monocytes significantly were decreased in severe cases of EV‐A71 induced HFMD
CD3+/CD4+/CD8+ T cell counts among the 223 EV‐A71‐infected patients (both mild and severe cases) and 117 healthy individuals were compared. As shown in Fig. 1a, both frequencies (P < 0·001) and absolute counts (P < 0·001) of peripheral monocytes were significantly increased in the EV‐A71‐infected cohort compared to healthy non‐infected controls. When the data from the EV‐A71‐infected patients were separated into severe and mild cases according to their clinical manifestations, lower levels of monocytes (P = 0·028 for absolute count and P = 0·006 for frequency) were found in severe cases compared to those classified clinically as mild (Fig. 1b). In addition, red blood cells (RBC) (P < 0·001), white blood cells (WBC) (P < 0·001), platelets (PLT) (P < 0·001), neutrophils (P < 0·001 for absolute count), CD3+ T cells (P < 0·001 for absolute count), CD4+ T cells (both P < 0·001 for frequency and absolute count), CD8+ T cells (P = 0·020 for frequency and P = 0·002 absolute count) and the CD4+/CD8+ ratio (P < 0·001) all exhibited significant differences between EV‐A71‐infected patients and healthy controls (Supporting information, Fig. S1). However, no differences in these indicators were seen between the severe and mild EV‐A71 infected groups (Supporting information, Fig. S2).
Figure 1.

Distribution of peripheral monocytes of health control, mild cases and severe cases. (a) Comparison of the counts and percentages of peripheral monocytes between in 223 enterovirus A71 (EV‐A71)‐infected patients and 117 healthy controls. (b) Comparison of the counts and percentages of peripheral monocytes between in 120 mild cases and 103 severe cases. The data were expressed as the median with the interquartile range. Differences between groups were assessed using the non‐parametric Mann–Whitney U‐test.
Plasma MCP‐1 levels were reduced in severe compared to mild cases
The level of the monocyte‐associated cytokine secretions were assayed in the plasma of sex‐ and age‐matched mild (n = 35) and severe cases (n = 35). The concentration of MCP‐1, detected by ELISA, was significantly decreased in severe compared to mild cases (P = 0·016, Fig. 2), indicating an impairment in chemotaxis function of monocytes during severe EV‐A71 infection. By contrast, no difference in the level of a range of other cytokines (TNF‐α, IL‐8, MIP‐1α, MIP‐1β, MIP‐1β, IL‐1β, IL‐1RA, IL‐6, IP‐10 and RANTES) was found between the severe and mild groups.
Figure 2.
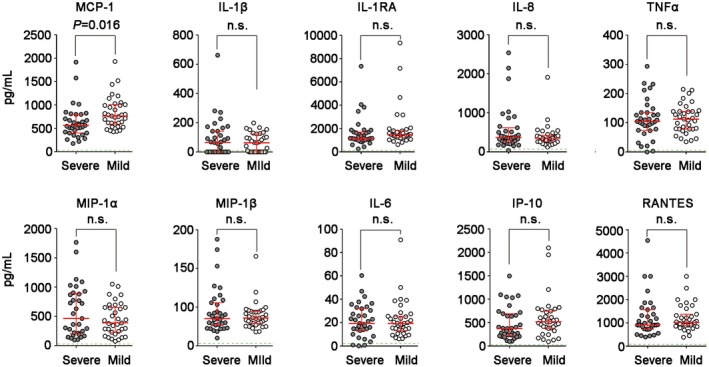
Comparison of serum levels of monocyte‐related cytokines [monocyte chemoattractant protein‐1 (MCP‐1), interleukin (IL)‐1β, IL‐1RA, IL‐8, tumor necrosis factor (TNF)‐α, macrophage inflammatory protein (MIP)‐1α, MIP‐1β, IL‐6, interferon‐γ‐inducible protein (IP)‐10 and regulated upon activation, normal t cell expressed and secreted (RANTES)] between in sex‐ and age‐matched mild (n = 35) and severe (n = 35) EV‐A71‐infected cases. The data are expressed as the median with the interquartile range. Differences between groups were assessed using the non‐parametric Mann–Whitney U‐test.
MCP‐1 expression was reduced in monocytes of severe cases
To confirm that disease severity relates directly with the cytokine secretion capacity of monocytes, untouched purified monocytes isolated from PBMCs of mild (n = 20) and severe cases (n = 20) were stimulated with GM‐CSF, GM‐CSF + LPS, GM‐CSF + R848 and GM‐CSF + EV‐A71 following preliminary experiments to demonstrate the concentration of stimulants LPS, R848 and EV‐A71 used, the capacity of monocyte was reflected by MCP‐1 and TNF‐α production in supernatants (Supporting information, Fig. S3). As shown in Fig. 3, MCP‐1 production under GM‐CSF (P = 0·008), GM‐CSF + LPS (P = 0·045) + GM‐CSF + R848 stimulation (P = 0·045) were all significantly decreased in severe compared with mild cases. These results indicate that monocytes obtained from severe HFMD cases showed lower levels of MCP‐1 production following in‐vitro stimulation with TLR ligands.
Figure 3.

The expression levels of monocyte chemoattractant protein‐1 (MCP‐1), tumor necrosis factor (TNF)‐α, interleukin (IL)‐6, IL‐8, macrophage inflammatory protein (MIP)‐1α, MIP‐1β and IL‐1β in supernatant of stimulated monocytes were detected by enzyme‐linked immunosorbent assay (ELISA); 1 × 10⁵ untouched monocytes of mild (n = 20) and severe (n = 20) cases were seeded in each well of 96‐well plates and stimulated with 20 ng/ml granulocyte–macrophage colony‐stimulating factor (GM‐CSF), GM‐CSF + lipopolysaccharide (LPS) (1 μg/ml), GM‐CSF + R848 (10 μg/ml) and GM‐CSF + enterovirus A71 (EV‐A71) [0·5 multiplicity of infection (MOI)/200 μl] for 48 h. The mean values and the standard deviation are indicated. Differences between groups were assessed using the non‐parametric Wilcoxon matched‐pairs test.
Immunophenotypical characteristics of monocytes from severe versus mild cases of EV‐A71‐induced HFMD
The expression patterns of immune activation markers (HLA‐DR, CD69 and CD38), co‐stimulatory markers (CD80 and CD86) and immune exhaustion indicators (PD‐1 and PD‐L1) were assayed in monocytes from severe (n = 20) and mild (n = 20) cases of EV‐A71‐induced HFMD. This phenotypical analysis showed that both HLA‐DR (P < 0·001) and CD38 (P = 0·002) were down‐regulated in monocytes from severe cases, while the expression of PD‐1 (P = 0·005) and PD‐L1 (P = 0·027) showed the opposite trend (Fig. 4a,b). These results indicate that, compared to mild cases, monocytes obtained from severe cases of EV‐A71 induced HFMD exhibit an immune overactivated and exhausted phenotype, indicating that they have become dysfunctional and exhausted.
Figure 4.

Phenotypical profiles of the stimulated monocytes in mild and severe cases. (a) The mean fluorescence intensity (MFI) levels of human leucocyte antigen D‐related (HLA‐DR), CD38, CD69, CD80, CD86, programmed death 1 (PD‐1) and programmed death ligand 1 (PD‐L1) on monocytes of severe and mild enterovirus A71 (EV‐A71)‐infected patients were compared. (b) Comparison of immunophenotypical characteristics of monocytes between severe (n = 20) and mild (n = 20) EV‐A71‐infected patients. The mean values and the standard deviation are indicated. Differences between groups were assessed using the non‐parametric Wilcoxon matched‐pairs test.
PD‐L1 blockade stimulated the production of MCP‐1 from activated PBMCs
The interaction of PD‐1/PD‐L1 is known to influence the secretion of MCP‐1 from activated monocytes. Therefore, an anti‐PD‐L1 monoclonal Ab (MIHI) was used to block the PD‐1/PD‐L1 interaction in PBMCs co‐cultured with EV‐A71‐infected RD cells in a Transwell system. Compared to PBMCs cultured in the presence of isotype antibody (negative control), there was higher production of MCP‐1 (P = 0·040) and IL‐6 (P = 0·049) by cells treated with anti‐PD‐L1 (Fig· 5a), and replication of EV‐A71 in the RD cells was decreased accordingly (P = 0·009) (Fig. 5b). In addition, PD‐L1 blockade was shown to increase intracellular MCP‐1 production of CD14+ monocytes in PBMCs activated by R848 (P = 0·002) or EV‐A71 virus (P = 0·002), as shown in Fig. 5c. However, recombinant MCP‐1 failed to inhibit replication of EV‐A71 in the RD cells (Supporting information, Fig. S4) and expression of PD‐1 and PD‐L1 on monocytes activated by R848 (Supporting information, Fig. S5). Presumably, the causes of the decrease of EV‐A71 replication induced by PD‐L1 blockade were possibly associated with the synergistic effect of multiple cytokines [such as IL‐6, interferon (IFN)‐γ, etc.]. Collectively, these results indicate that PD‐1/PD‐L1 blockade induced higher production of MCP‐1 by activated monocytes and simultaneously restrained the replication of EV‐A71.
Figure 5.

Programmed death 1 ligand (PD‐L1) blockade stimulated the production of monocyte chemoattractant protein‐1 (MCP‐1) from activated peripheral blood mononuclear cells (PBMCs). (a,b) PBMCs co‐cultured with rhabdomyosarcoma (RD) cells [enterovirus A71 (EV‐A71+)] in the Transwell system. (a) Histograms showing representative results for enzyme‐linked immunosorbent assay (ELISA) antigen determination for MCP‐1, interleukin (IL)‐6, IFN‐γ and IL‐1β in supernatants of co‐cultured PBMCs and RD (EV‐A71 infected for 2 h) for 12 h. Samples of Transwell are shown as a schematic diagram in the right side of (b). (b) Histograms showing representative results for EV‐A71 replication influenced by anti‐PD‐L1 blockade, isotype antibody (negative control) and medium (blank). (c) PD‐L1 blockade was shown to increase intracellular MCP‐1 production of CD14+ monocytes in PBMCs activated by R848 or EV‐A71 virus; 2·5 × 106 PBMCs were settled in 96‐well plates with R10 medium and incubated with granulocyte–macrophage colony‐stimulating factor (GM‐CSF) + R848 + anti‐PD‐L1 antibody [or mouse immunoglobulin (Ig)G1κ isotype antibody] or GM‐CSF + EV‐A71 + anti‐PD‐L1 antibody (or isotype antibody) for 6 h. Cells performed intracellular cytokine staining with the following monoclonal antibodies: CD3‐AF700, CD14‐ef450 and MCP‐1‐PE. U.D. = undetectable. The experiments were repeated for four times. Differences between groups were assessed using the non‐parametric Wilcoxon matched‐pairs test.
PD‐L1 blockade induced the increase of MCP‐1 produced by activated purified monocytes
Finally, the anti‐PD‐L1 monoclonal antibody (MIHI) was used to block the interaction between PD‐1 and PD‐L1 on purified monocytes activated by R848 or EV‐A71 virus. Figure 6 shows that compared to the monocytes treated with isotype antibody, the production of MCP‐1 in activated monocytes treated with anti‐PD‐L1 was significantly increased (P = 0·002). This result demonstrated that the PD‐1/PD‐L1 interaction is linked to MCP‐1 cytokine production.
Figure 6.

Untouched monocytes were negatively isolated from peripheral blood mononuclear cells (PBMCs) of healthy donors and treated by anti‐programmed death ligand 1 (PD‐L1) monoclonal antibody (MIH1) or mouse immunoglobulin (Ig)G1κ isotype control antibodies for 6 h. The monocytes were co‐cultured with 20 ng/ml granulocyte–macrophage colony‐stimulating factor (GM‐CSF) and 0·5 multiplicity of infection (MOI) enterovirus A71 (EV‐A71) or 10 µg/ml R848 into 96‐well tissue culture plates for 3 days and the culture supernatants were collected for monocyte chemoattractant protein‐1 (MCP‐1) detection. Differences between groups were assessed using the non‐parametric Wilcoxon matched‐pairs test.
Discussion
EV‐A71 infections are normally characterized by a short incubation period of 3–6 days with severe disease symptoms 16. The observation that infants and young children are highly susceptible to EV‐A71 infection and that they develop severe neurological disease more frequently has been assumed to involve reduced immunity in these individuals 5, 8. Some studies have indicated that the production of cytokines such as IL‐6, IL‐10, IL‐13 and IFN‐γ appears to be responsible for the pathogenesis of EV‐A71‐associated HFMD 17, 18. Recently, it has been reported that the cerebrospinal fluid (CSF) level of MCP‐1 was significantly lower in encephalitis patients than mild cases 19, 20. Theoretically, adaptive immunity usually does not develop sufficiently to combat infectious pathogens until a number of weeks post‐infection. For example, adaptive immune responses against HCV are first detectable for 8–12 weeks after acute exposure in hepatitis C‐infected individuals suffering from both self‐limited and chronic infections 21. Based on this disparity between the kinetics of development of adaptive host immunity and the clinical features of EV‐A71 infection, it seems reasonable to postulate that some facets of the innate immune response might play a critical role in the progression of HFMD symptomology.
Monocytes and their macrophage and dendritic‐cell progeny have three main functions: phagocytosis, antigen presentation and cytokine production. These form an essential barrier for invading pathogens as a part of the host’s innate immunity system 22. Previous studies have shown that monocytes primarily mediate a robust innate immune response to systemic infection, and the recruitment of monocytes is a feature of the inflammatory response to infection 11, 12. More broadly, recent viral pathology studies have suggested that monocytes and macrophages are important in a range of chronic viral infections, such as those involving HIV, hepatitis B virus (HBV) and hepatitis C virus (HCV) 23, 24, 25, 26. Clinical studies also provided clues about the relationship between monocytes and viral pathogenesis, elevated preoperative monocyte count being an independent predictor of worse prognosis for patients with HCC after hepatic resection, especially for those with an HBV infection 27. However, there remains no clear understanding of how innate immunity and monocytes influence disease progression in acute viral infections such as EV‐A71‐induced HFMD.
Therefore, a key objective of this study was to explore the relationship between the immune status of monocytes and disease severity in HFMD. MCP‐1, a small proinflammatory cytokine involved in a variety of inflammatory responses 28, 29, 30, is important in recruiting inflammatory cells expeditiously and directing them to sites of infection to kill invading microbes 31, 32. Consequently, the decreased absolute count and frequency of monocytes and MCP‐1 secretion level in severe cases hinted at the impaired immune status of monocytes. Based on these in‐vivo results, the level of MCP‐1 secreted by monocytes isolated from PBMC of patients was continuously tested in vitro, and the lower level of MCP‐1 secreted by monocytes from severe cases supported in‐vivo data. The immune activation state of monocytes (HLA‐DR, CD38 and CD69) was analyzed in severe and mild cases, and for HLA‐DR and CD38 levels were significantly higher in mild compared to severe cases. PD‐1 and PD‐L1 were also found to be expressed at higher levels in severe HFMD cases. It is well known that, as the key co‐inhibitor signal, the PD‐1/PD‐L1 pathway would affect the interaction of monocytes and T cells and further inhibit immune functioning of T cells 33. In addition, high levels of PD‐1/PD‐L1 also indicate that immune cells could be in a state of immune exhaustion, which is usually associated with functionally and systemically weak immune responses to invasive pathogens 34.
Previous clinical studies have shown that PD‐1/PD‐L1 blockade can intervene in both the development of HIV infection and in complications associated with chronic HBV infection 21, 35, 36. In this study, PD‐L1 blockade induced higher production of MCP‐1 by activated monocytes and was associated with decreased levels of EV‐A71 replication, indicating that PD‐L1 blockade can recover monocyte function to some extent, thereby inhibiting virus replication in vitro. This might indicate a potential new strategy for treatment of virus infection. However, the clinical characteristics of HFMD present a number of obstacles to pursuing the development of this strategy in the case of EV‐A71 infection. HFMD patients are mainly children of aged less than 3 years; consequently, blood sample volumes have a maximum limit of 3 ml, meaning that relatively few purified monocytes are available from each patient. In addition, the mild cases of HFMD are not normally hospitalized, given the self‐limiting nature of the disease. Notably, the experiments related with PD‐1/PD‐L1 blockade were preliminary exploration about the partial mechanism of HFMD severity progression. There should be multiple factors functioning and leading to different biological outcomes.
Collectively, the results of this study suggest that the absolute count, frequency, MCP‐1 secretion and immune status of monocytes contribute significantly to the differential prognosis of EV‐A71‐induced HFMD, and consequently provide new insights into the mechanism of severe HFMD development. In addition, PD‐1/PD‐L1 blockade has been shown to provide a potential new avenue for treatment of virus infection.
Disclosures
All authors declare no conflicts of interest.
Author contributions
T. S., H. Z., H. D., C. X., B. X., L. W. and X. L. collected the samples from patients and contributed to data acquisition. T. S. and Y. P. conceived and designed the study and experiments. X. P., T. S. and Y. P. wrote and edited the paper. All authors read and approved the final manuscript.
Supporting information
Fig. S1. Blood routine and distribution of peripheral T cell subsets in 223 EV‐A71‐infected patients and 117 healthy controls. (a‐d) The percentage and count of RBC, WBC and PLT (a), neutrophil (b), CD3+, CD4+ and CD8+ T‐cell (c and d) were analyzed. The red line represents the mean percentage or count for each index in the two different groups. The data were expressed as the median with the interquartile range.
Fig. S2. Blood cell distributions in periphery of mild cases and severe cases. (a‐d) The percentage and count of RBC, WBC and PLT (a), neutrophil (b), CD3+, CD4+ and CD8+ T‐cell (c and d) were analyzed. The red line represents the mean percentage or count for each index in the two different groups. The data were expressed as the median with the interquartile range. Differences between groups were assessed using non‐parametric Mann ‐Whitney U test.
Fig. S3. Preliminary experiments for determining concentration (μg/ml) of stimulants LPS and R848. MCP‐1 was detected for assessment of stimulation by ELISA. The experiment was repeated for three times. Differences between groups were assessed using non‐parametric Wilcoxon matched pairs test.
Fig. S4. Recombinant Human MCP‐1 failed to influence the replication of EV‐A71 virus in the RD cells. Recombinant Human MCP‐1 (100 ng/ml, Gibco) was added to the RD cells (infected at an MOI of 5 with EV‐A71 for 2 h) culture medium and EV‐A71 copies in RD cells were detected at 12 hrs post infection. Same volume of medium was used as control. The experiment was repeated for four times. Differences between groups were assessed using non‐parametric Wilcoxon matched pairs test.
Fig. S5. Recombinant human MCP‐1 failed to influence the expression of PD‐1 and PD‐L1 on activated monocytes. 2.5 × 10⁶ PBMCs were settled in 96‐well plate with R10 medium and incubated with GM‐CSF (20 ng/ml) + R848 (10 μg/ml) + recombinant Human MCP‐1 (100 ng/ml, Gibco) for 6 hrs. The monoclonal Abs against surface markers were added to the cells at room temperature for 30 min. After staining, PBMCs were washed twice with FACS buffer and the mean fluorescent intensity (MFI) levels of PD‐1(a) and PD‐L1(b) on CD14+ monocytes were analyzed using a BD FACS Fortessa (BD Biosciences). Same volume of medium was used as control. The experiment was repeated for four times. Differences between groups were assessed using non‐parametric Wilcoxon matched pairs test.
Table. S1. Basic information of mild and severe EV‐A71‐associated HFMD patients and healthy controls.
Acknowledgements
We thank Dr Malcolm A. McCrae for critical reading and revision on the manuscript. Xinyi Pei and Xueying Fan performed the experiments and analyses. This work was supported by the National Natural Science Foundation of China (NSFC grant 81772184).
Contributor Information
Y. Peng, Email: ypeng78@bjmu.edu.cn
T. Shen, Email: taoshen@hsc.pku.edu.cn.
References
- 1. Pathinayake PS, Hsu AC, Wark PA. Innate immunity and immune evasion by enterovirus 71. Viruses 2015; 7:6613–30. [DOI] [PMC free article] [PubMed] [Google Scholar]
- 2. Repass GL, Palmer WC, Stancampiano FF. Hand, foot, and mouth disease: identifying and managing an acute viral syndrome. Clevel Clin J Med 2014; 81:537–43. [DOI] [PubMed] [Google Scholar]
- 3. Zhao D, Sun B, Jiang H et al Enterovirus71 virus‐like particles produced from insect cells and purified by multistep chromatography elicit strong humoral immune responses in mice. J Appl Microbiol 2015; 119:1196–205. [DOI] [PubMed] [Google Scholar]
- 4. Chang LY, King MCC, Hsu KH et al Risk factors of enterovirus 71 infection and associated hand, foot, and mouth disease herpangina in children during an epidemic in Taiwan. Pediatrics 2002; 109:e88. [DOI] [PubMed] [Google Scholar]
- 5. Chang L‐Y, Hsiung CA, Lu C‐Y et al Status of cellular rather than humoral immunity is correlated with clinical outcome of enterovirus 71. Pediatr Res 2006; 60:466–71. [DOI] [PMC free article] [PubMed] [Google Scholar]
- 6. Klein MH. EV71 vaccines: a first step towards multivalent hand, foot and mouth disease vaccines. Expert Rev Vaccines 2015; 14:337–40. [DOI] [PubMed] [Google Scholar]
- 7. Chang PC, Chen SC, Chen KT. The current status of the disease caused by enterovirus 71 infections: epidemiology, pathogenesis, molecular epidemiology, and vaccine development. Int J Environ Res Public Health 2016; 13:890. [DOI] [PMC free article] [PubMed] [Google Scholar]
- 8. Lin YW, Wang SW, Tung YY, Chen SH. Enterovirus 71 infection of human dendritic cells. Exp Biol Med 2009; 234:1166–73. [DOI] [PubMed] [Google Scholar]
- 9. Hettinger J, Richards DM, Hansson J et al Origin of monocytes and macrophages in a committed progenitor. Nat Immunol 2013; 14:821–30. [DOI] [PubMed] [Google Scholar]
- 10. Merino KM, Allers C, Didier ES, Kuroda MJ. Role of monocyte/macrophages during HIV/SIV infection in adult and pediatric acquired immune deficiency syndrome. Front Immunol 2017; 8:1693. [DOI] [PMC free article] [PubMed] [Google Scholar]
- 11. Pamer EG. Immune responses to Listeria monocytogenes . Nat Rev Immunol 2004; 4:812–23. [DOI] [PubMed] [Google Scholar]
- 12. Indramohan M, Sieve AN, Break TJ, Berg RE, Flynn JL. Inflammatory monocyte recruitment is regulated by interleukin‐23 during systemic bacterial infection. Infect Immun 2012; 80:4099–105. [DOI] [PMC free article] [PubMed] [Google Scholar]
- 13. The Ministry of Public Health of China . Hand, Foot and Mouth Disease Control and Prevention Guideline. Chinese J Exp Clin Infect Dis 2008; 3:210–13. [Google Scholar]
- 14. The Ministry of Public Health of China . Hand, Foot and Mouth Disease Treatment Guideline. Chinese J Community Doctors 2009; 25:6–7. [Google Scholar]
- 15. Liu J, Chen L, Guo J et al Sequence analysis and pathogenicity of a human enterovirus 71 isolate (BC08). J Viral Dis 2012; 6:19–25. [Google Scholar]
- 16. Aswathyraj S, Arunkumar G, Alidjinou EK, Hober D. Hand, foot and mouth disease (HFMD): emerging epidemiology and the need for a vaccine strategy. Med Microbiol Immunol. 2016; 205:397–407. [DOI] [PubMed] [Google Scholar]
- 17. Wang SM, Lei HY, Huang KJ et al Pathogenesis of enterovirus 71 brainstem encephalitis in pediatric patients roles of cytokines and cellular immune activation in patients with pulmonary edema. J Infect Dis 2003; 188:564–70. [DOI] [PubMed] [Google Scholar]
- 18. Khong WX, Foo DGW, Trasti SL, Tan EL, Alonso S. Sustained high levels of interleukin‐6 contribute to the pathogenesis of enterovirus 71 in a neonate mouse model. J Virol 2011; 85:3067–76. [DOI] [PMC free article] [PubMed] [Google Scholar]
- 19. Liu J, Li S, Cai C, Xu Y, Jiang Y, Chen Z. Cerebrospinal fluid chemokine patterns in children with enterovirus 71‐related encephalitis. Sci Rep 2018; 8: 1658. [DOI] [PMC free article] [PubMed] [Google Scholar]
- 20. Wang SM, Lei HY, Yu CK, Wang JR, Su IJ, Liu CC. Acute chemokine response in the blood and cerebrospinal fluid of children with enterovirus 71‐associated brainstem encephalitis. J Infect Dis 2008; 198:1002–6. [DOI] [PubMed] [Google Scholar]
- 21. Park SH, Rehermann B. Immune responses to HCV and other hepatitis viruses. Immunity 2014; 40:13–24. [DOI] [PMC free article] [PubMed] [Google Scholar]
- 22. Ginhoux F, Jung S. Monocytes and macrophages: developmental pathways and tissue homeostasis. Nat Rev Immunol 2014; 14:392–404. [DOI] [PubMed] [Google Scholar]
- 23. Zheng J, Liang H, Xu C et al An unbalanced PD‐L1/CD86 ratio in CD14++CD16+ monocytes is correlated with HCV viremia during chronic HCV infection. Cell Mol Immunol 2014; 11:294–304. [DOI] [PMC free article] [PubMed] [Google Scholar]
- 24. Nouri‐Aria KT, Magrin S, Alexander GJ, Anderson MG, Williams R, Eddleston AL. Abnormal T‐cell activation in chronic hepatitis B viral infection – a consequence of monocyte dysfunction. Immunology 1988; 64:733–8. [PMC free article] [PubMed] [Google Scholar]
- 25. Liang H, Duan Z, Li D et al Higher levels of circulating monocyte–platelet aggregates are correlated with viremia and increased sCD163 levels in HIV‐1 infection. Cell Mol Immunol 2014; 12:435–43. [DOI] [PMC free article] [PubMed] [Google Scholar]
- 26. Campbell JH, Hearps AC, Martin GE, Williams KC, Crowe SM. The importance of monocytes and macrophages in HIV pathogenesis, treatment, and cure. Aids 2014; 28:2175–87. [DOI] [PMC free article] [PubMed] [Google Scholar]
- 27. Shen SLFS, Huang XQ, Chen B et al Elevated preoperative peripheral blood monocyte count predicts poor prognosis for hepatocellular carcinoma after curative resection. BMC Cancer 2014; 14:744. [DOI] [PMC free article] [PubMed] [Google Scholar]
- 28. Peterson KE, Errett JS, Wei T et al MCP‐1 and CCR28 contribute to non‐lymphocyte‐mediated brain disease induced by Fr98 polytropic retrovirus infection in mice: role for astrocytes in retroviral neuropathogenesis. J Virol 2004; 78:6449–58. [DOI] [PMC free article] [PubMed] [Google Scholar]
- 29. Ruiz Silva M, van der Ende‐Metselaar H, Mulder HL, Smit JM, Rodenhuis‐Zybert IA. Mechanism and role of MCP‐1 upregulation upon chikungunya virus infection in human peripheral blood mononuclear cells. Sci Rep 2016; 6: 32288. [DOI] [PMC free article] [PubMed] [Google Scholar]
- 30. Sierra B, Perez AB, Vogt K et al MCP‐1 and MIP‐1α expression in a model resembling early immune response to dengue. Cytokine 2010; 52:175–83. [DOI] [PubMed] [Google Scholar]
- 31. Yadav A, Saini V, Arora S. MCP‐1: chemoattractant with a role beyond immunity: a review. Clin Chim Acta 2010; 411:1570–9. [DOI] [PubMed] [Google Scholar]
- 32. Daly C, Rollins BJ. Monocyte chemoattractant protein‐1 (CCL2) in inflammatory disease and adaptive immunity: therapeutic opportunities and controversies. Microcirculation 2010; 10:247–57. [DOI] [PubMed] [Google Scholar]
- 33. Boussiotis VA, Longo DL. Molecular and biochemical aspects of the PD‐1 checkpoint pathway. N Engl J Med 2016; 375:1767–78. [DOI] [PMC free article] [PubMed] [Google Scholar]
- 34. Zinselmeyer BH, Heydari S, Sacristán C et al PD‐1 promotes immune exhaustion by inducing antiviral T cell motility paralysis. J Exp Med 2013; 210:757–74. [DOI] [PMC free article] [PubMed] [Google Scholar]
- 35. Guihot AMA, Massiani MA, Samri A, Soulié C, Autran B, Spano JP. Drastic decrease of the HIV reservoir in a patient treated with nivolumab for lung cancer. Ann Oncol 2018; 29:517–8. [DOI] [PubMed] [Google Scholar]
- 36. Fisicaro P, Valdatta C, Massari M et al Antiviral intrahepatic T‐cell responses can be restored by blocking programmed death‐1 pathway in chronic hepatitis B. Gastroenterology 2010; 138:682–93.e4. [DOI] [PubMed] [Google Scholar]
Associated Data
This section collects any data citations, data availability statements, or supplementary materials included in this article.
Supplementary Materials
Fig. S1. Blood routine and distribution of peripheral T cell subsets in 223 EV‐A71‐infected patients and 117 healthy controls. (a‐d) The percentage and count of RBC, WBC and PLT (a), neutrophil (b), CD3+, CD4+ and CD8+ T‐cell (c and d) were analyzed. The red line represents the mean percentage or count for each index in the two different groups. The data were expressed as the median with the interquartile range.
Fig. S2. Blood cell distributions in periphery of mild cases and severe cases. (a‐d) The percentage and count of RBC, WBC and PLT (a), neutrophil (b), CD3+, CD4+ and CD8+ T‐cell (c and d) were analyzed. The red line represents the mean percentage or count for each index in the two different groups. The data were expressed as the median with the interquartile range. Differences between groups were assessed using non‐parametric Mann ‐Whitney U test.
Fig. S3. Preliminary experiments for determining concentration (μg/ml) of stimulants LPS and R848. MCP‐1 was detected for assessment of stimulation by ELISA. The experiment was repeated for three times. Differences between groups were assessed using non‐parametric Wilcoxon matched pairs test.
Fig. S4. Recombinant Human MCP‐1 failed to influence the replication of EV‐A71 virus in the RD cells. Recombinant Human MCP‐1 (100 ng/ml, Gibco) was added to the RD cells (infected at an MOI of 5 with EV‐A71 for 2 h) culture medium and EV‐A71 copies in RD cells were detected at 12 hrs post infection. Same volume of medium was used as control. The experiment was repeated for four times. Differences between groups were assessed using non‐parametric Wilcoxon matched pairs test.
Fig. S5. Recombinant human MCP‐1 failed to influence the expression of PD‐1 and PD‐L1 on activated monocytes. 2.5 × 10⁶ PBMCs were settled in 96‐well plate with R10 medium and incubated with GM‐CSF (20 ng/ml) + R848 (10 μg/ml) + recombinant Human MCP‐1 (100 ng/ml, Gibco) for 6 hrs. The monoclonal Abs against surface markers were added to the cells at room temperature for 30 min. After staining, PBMCs were washed twice with FACS buffer and the mean fluorescent intensity (MFI) levels of PD‐1(a) and PD‐L1(b) on CD14+ monocytes were analyzed using a BD FACS Fortessa (BD Biosciences). Same volume of medium was used as control. The experiment was repeated for four times. Differences between groups were assessed using non‐parametric Wilcoxon matched pairs test.
Table. S1. Basic information of mild and severe EV‐A71‐associated HFMD patients and healthy controls.