

Summary
Tumor immune evasion involves the expansion of avidly proliferating immunosuppressive cells and inhibition of effector T cell proliferation. Immune checkpoints (IC) block the activation pathways of tumor‐reactive T cells. IC pathways are often exploited by tumor cells to evade immune destruction, and blocking these pathways through IC inhibitors (ICI) has shown promising results in multiple malignancies. In this study, we investigated the effects of an ICI, pembrolizumab, on various T cell subsets in vitro. We compared the suppressive activity of CD4+CD25+ regulatory T cells (conventional Treg) with T cells expressing T cell immunoglobulin‐3+ (TIM‐3+) and latency‐associated peptide (LAP)+ T cells. We found that LAP‐expressing T cells were more suppressive than conventional Treg, but TIM‐3‐expressing T cells were not suppressive. Our results show that pembrolizumab does not modulate functions of Treg and mediates its immunostimulatory effects via the release of effector T cells from suppression. These findings may assist in the development of agents designed to intervene in IC pathways to overcome Treg resistance to ICI.
Keywords: cell activation, cell proliferation, regulatory T cells
Introduction
The majority of human malignancies are associated with tumor resistance to host immunity. Tumors are known to induce dysfunction in anti‐tumor effector cells and an immunosuppressive environment via assistance of host immune cells such as regulatory T cells (Treg), myeloid‐derived suppressor cells (MDSC) and tumor‐associated macrophages (TAM) 1. These suppressive populations proliferate avidly, leading to frequent reports of elevated levels within the tumor microenvironment (TME) and in periphery of cancer patients.
T cell‐mediated immune responses are of paramount significance in immunity against tumor antigens. T cell activation involves cross‐talk between the T cell receptor (TCR) and co‐stimulatory molecules, and is influenced by many factors 2. The frequency of T cells with a specific TCR for a particular epitope is generally very low (1–10/million CD4+ T cells), therefore epitope‐specific T cell populations are required to rapidly proliferate and expand to induce effective immune responses 3.
Immune checkpoints (IC) attenuate sustained T cell activation to regulate immune homeostasis. Cancers and chronic infections lead to an increase in IC expression leading to T cell exhaustion, characterized by loss in cytokine secretion and effector functions 4. IC up‐regulation and their negative impact on immune cell responses provided a strong rationale for the development of therapeutic agents to block interactions between these receptors and their ligands in order to achieve more potent and prolonged immune cell responses to eliminate tumor cells.
Pembrolizumab is one of the pioneering IC inhibitors (ICI), initially approved by the Food and Drug Administration (FDA) to treat advanced or non‐resectable melanoma, but has recently received approval for different cancers including any non‐resectable or metastatic solid tumors that show genetic anomalies, mismatch repair deficiency (dMMR) or microsatellite instability (MSI‐H) 5. Pembrolizumab works by blocking the interactions between programmed death 1 (PD‐1), expressed on T cells, with its ligands PD‐L1 and PD‐L2 expressed on tumor cells, to restore effective T cell responses against tumor cells. The PD‐1 pathway greatly affects the release of interferon (IFN)‐γ, tumor necrosis factor (TNF)‐α and IL‐2 cytokines 6. Pembrolizumab restores the release of these effector cytokines for potent immune‐mediated tumor cell targeting. The success of pembrolizumab involved numerous studies that investigated the different aspects of its mechanism of action. However, continued investigations will lead to the development of additional agents to modulate additional and novel IC pathways.
In this study, we investigated the suppressive potentials of T cell subsets on responder T cells using in‐vitro suppression assays. Importantly, we investigated the effects of pembrolizumab on the suppressive capacities of these cells, and report that pembrolizumab does not affect the suppressive activity of Treg, which are resistant to ICI. Additionally, we found that CD4+ T cells expressing T cell immunoglobulin‐3 and mucin‐domain containing‐3 (TIM‐3) have the potential to promote proliferation of responder T cells.
Materials and methods
Cell isolation and preparation
This study was performed under ethical approval by the Qatar Biomedical Research Institute, Doha, Qatar (Protocol no. 2017–006). All healthy donors (HD) provided written informed consent prior to sample donation. Peripheral blood mononuclear cells (PBMC) were isolated from fresh whole blood from four HD by density‐gradient centrifugation using Histopaque‐1077 (Sigma‐Aldrich, St Louis, MO, USA). PBMC were frozen in cryovials at a density of 5 million cells per 1 ml freezing media [50% fetal bovine serum (FBS), 40% RPMI‐1640 media and 10% dimethylsulfoxide (DMSO)] to be used in batches for subsequent analyses.
Thawed PBMC were stained for flow cytometric analyses for day 0 and also suspended at 2 × 10⁶ cells/well in 1 ml complete medium (RPMI‐1640 supplemented with 2 mM L‐glutamine, 10% FCS and 1% penicillin/streptomycin) in 24‐well treated culture plates in the presence of soluble 2 µg/ml anti‐CD3 (clone OKT3; eBioscience, San Diego, CA, USA) and 2 µg/ml anti‐CD28 antibodies (clone CD28.2; eBioscience) for up to 5 days at 37°C. Flow cytometric analyses for days 1–5 were carried out by collecting cells at 24‐h intervals. PBMC activated for 24 h were sorted using BD FACS Aria III cell sorter.
Multi‐parametric flow cytometry
Cells were washed with phosphate‐buffered saline (PBS) and resuspended in 100 µl staining buffer (PBS with 2% FCS and 1% sodium azide). Cells were blocked for Fc receptor using FcR blocker (Miltenyi Biotec, Bergisch Gladbach, Germany). To gate out dead cells, fixable viability dye eFluor 660 (FVD660; eBioscience) was used. Cells were then stained with cell surface antibodies; CD3 peridinin chlorophyll/cyanin 5.5 (PerCP/Cy5.5) (cloneSK‐7; BD Biosciences, Oxford, UK), CD4 Alexa Fluor 700 (clone RPA‐T4; BioLegend, San Diego, CA, USA), CD25 brilliant violet 650 (clone BC96; BioLegend), latency‐associated peptide phycoerythrin (LAP‐PE) (clone Tw4‐2F8; BioLegend), PD‐1 PE/DazzleTM 594 (clone EH12.2H7; BioLegend), T cell immunoglobulin and mucin domain 3 (TIM‐3) brilliant violet 711 (clone 7D3; BD Biosciences), lymphocyte‐activation gene 3 (LAG‐3) brilliant violet 421 (clone T47‐530; BD Biosciences), added to 50 µl brilliant violet staining buffer (BD Biosciences) per tube and incubated at 4°C for 30 min.
For intracellular staining, cells were washed twice with staining buffer and fixed/permeabilized using fixation/permeabilization buffer (eBioscience) at 4ºC for 45 min. After two washes with permeabilization wash buffer (eBioscience), cells were blocked using mouse serum (Sigma‐Aldrich) and rat serum (Sigma‐Aldrich) for 10 min and stained with forkhead box protein 3 (FoxP3‐PE/Cy7) (clone PCH101; eBioscience) and Helios‐fluorescein isothiocyanate (FITC) (clone 22F6; BioLegend) antibodies for another 30 min at 4°C. Cells were then washed twice with permeabilization wash buffer (eBioscience) and resuspended in flow cytometry staining buffer.
All data were acquired on a BD LSRFortessa X‐20 flow cytometer and cell sorting was performed on a BD FACSAria III SORP cell sorter, using BD FACSDiva software (BD Biosciences). All cell sorts were performed using a 100 µ nozzle at 20 psi sheath pressure and at 10°C cooled sample collection to minimize sorter‐induced cell stress (SICS). Data analyses were performed on FlowJo software (FlowJo version 10; TreeStar, Ashland, OR, USA).
Suppression assays
Carboxyfluorescein diacetate succinimidyl ester (CFSE)‐based suppression assays were performed using different T cell subsets. Sorted pure CD4+TIM‐3–LAP+, CD4+TIM‐3+LAP– and CD4+CD25+ cells were used as suppressors and CD4+CD25– cells as responders. A constant number of responder cells (10 000 cells per well) were co‐cultured at different ratios (0 : 1, 1 : 1, 1 : 2, 1 : 4, 1 : 8, 1 : 16) with suppressor cells in the presence of polyclonal stimulation (plate‐bound anti‐CD3 (2 µg/ml) and anti‐CD28 (2 µg/ml), with and without 2 µg/ml pembrolizumab (Keytruda; Merck & Co., Kenilworth, NJ, USA) in duplicate wells in 96‐well round‐bottomed non‐tissue culture plates. Responder cells were labeled with CFSE and proliferation was measured by calculating the percentage of CFSE loss after 3 days. Suppressive activity was assessed from the percentage of CFSE+ responder T cells after 3 days of culture.
Statistical analyses
Statistical analyses were performed using GraphPad Prism version 5 software (GraphPad Software, La Jolla, CA, USA). We checked normality using the Shapiro–Wilk normality test. A paired t‐test was performed on samples that passed the normality test, and non‐parametric/Wilcoxon matched‐pairs signed‐rank tests were performed for samples that did not show normal distribution. The P‐values are represented as: ***P < 0·001, **P < 0·01 and *P < 0·05. A P‐value of > 0·05 is considered statistically non‐significant (n.s.). The data are presented as mean ± standard error of the mean (s.e.m.).
Results
Multiple immune checkpoints and latency‐associated peptide are up‐regulated upon TCR stimulation
We investigated the kinetics of TIM‐3, LAG‐3, PD‐1 and LAP following activation by soluble anti‐CD3/CD28 antibodies for up to 5 days. In accordance with previous reports, we found that these molecules are expressed at low levels in resting CD4+ T cells and were up‐regulated following TCR stimulation (Fig. 1a). We found that TIM‐3 and PD‐1 were highly up‐regulated during the course of 5 days. In contrast, LAG‐3 and LAP were up‐regulated initially, but their expression declined after early activation (Fig. 1a).
Figure 1.
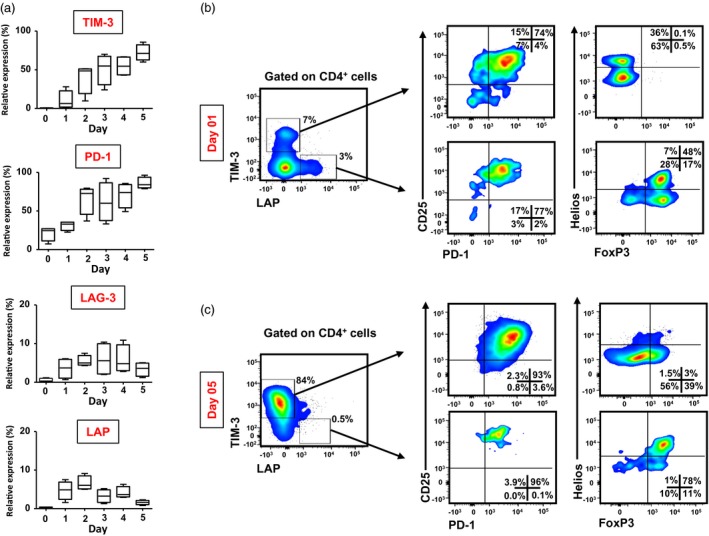
Kinetics of immune checkpoint and regulatory T cell (Treg)‐related marker expression on CD4+ T cells following activation. Peripheral blood mononuclear cells (PBMC) from healthy donors (HD) were cultured for 5 days in the presence of soluble anti‐CD3 and anti‐CD28 antibodies, and stained for CD4, CD25, T cell immunoglobulin‐3 (TIM‐3), programmed death 1 (PD‐1), lymphocyte‐activation gene 3 (LAG‐3) and latency‐associated peptide (LAP) antibodies at 1‐day intervals. Box‐plots show the kinetics of TIM‐3, PD‐1, LAG‐3 and LAP expression for 5 days following activation (a). Representative flow cytometric plots show TIM‐3 and LAP expression on CD4+ cells, and CD25/PD‐1 expression and forkhead box protein 3 (FoxP3)/Helios expression in CD4+TIM‐3+/–LAP+/– subsets, following activation for 1 day (b) and 5 days (c). Live cells were gated first using 7‐aminoactinomycin D (7AAD) viability dye. Data are from four individual experiments.
Activated TIM‐3+ and LAP+ T cells co‐express PD‐1, but TIM‐3+ cells do not express FoxP3 after early activation
TIM‐3 and PD‐1 are negative regulators of T cell activation, and their expression is associated with T cell exhaustion. Additionally, the IL‐2 receptor alpha chain, CD25, is expressed on CD4+ Treg and LAP is associated with the functional activity of Treg through modulation of transforming growth factor (TGF)‐β 7. We found that following early activation, the majority of TIM‐3+ cells and LAP+ cells also co‐express PD‐1 and CD25 (Fig. 1b). We then wanted to investigate FoxP3 and Helios, a member of the Ikaros family of zinc‐finger proteins, previously reported to be associated with suppressive activity of Treg 8, expression in TIM‐3+ and LAP+ T cells. We found that after 1 day of activation, the majority of CD4+TIM‐3–LAP+ cells express both FoxP3 and Helios, and a significant proportion of cells were FoxP3+Helios– (Fig. 1b). Interestingly, we found that CD4+TIM‐3+LAP– cells do not express FoxP3, but these cells can express Helios (Fig. 1b). Moreover, 5‐day kinetics showed that prolonged activation induces FoxP3 expression in both CD4+TIM‐3+LAP– and CD4+TIM‐3–LAP+ T cells (Fig. 1c).
LAP+ Treg are more suppressive than conventional Treg
To investigate the suppressive potential of T cell subsets, we sorted CD4+CD25+ conventional Treg, CD25+TIM‐3+LAP– and CD25+TIM‐3–LAP+ T cells following 1‐day activation and CD4+CD25– responder T cells without activation (Fig. 2a,b). We performed suppression assays to compare the suppressive potentials of TIM‐3+ and LAP+ cells with conventional CD25+ Treg. We found that conventional CD4+CD25+ Treg were able to suppress responder T cell proliferation in all donors (Fig. 3a). However, LAP+ T cells showed higher suppression of responder T cells than conventional Treg. Interestingly, TIM3+ cells did not show any suppressive activity compared to LAP+ and conventional Treg (Fig. 3a). We found that LAP+ T cells are significantly more suppressive than conventional Treg and TIM‐3+ T cells (conv. Treg, 16·7 ± 6·4; TIM‐3+, –21·7 ± 14·5; LAP+, 45·34 ± 13·0; Fig. 3b,c). Overall, there was a threefold increase in suppressive activity of LAP+ T cells compared to conventional Treg (Fig. 3c).
Figure 2.
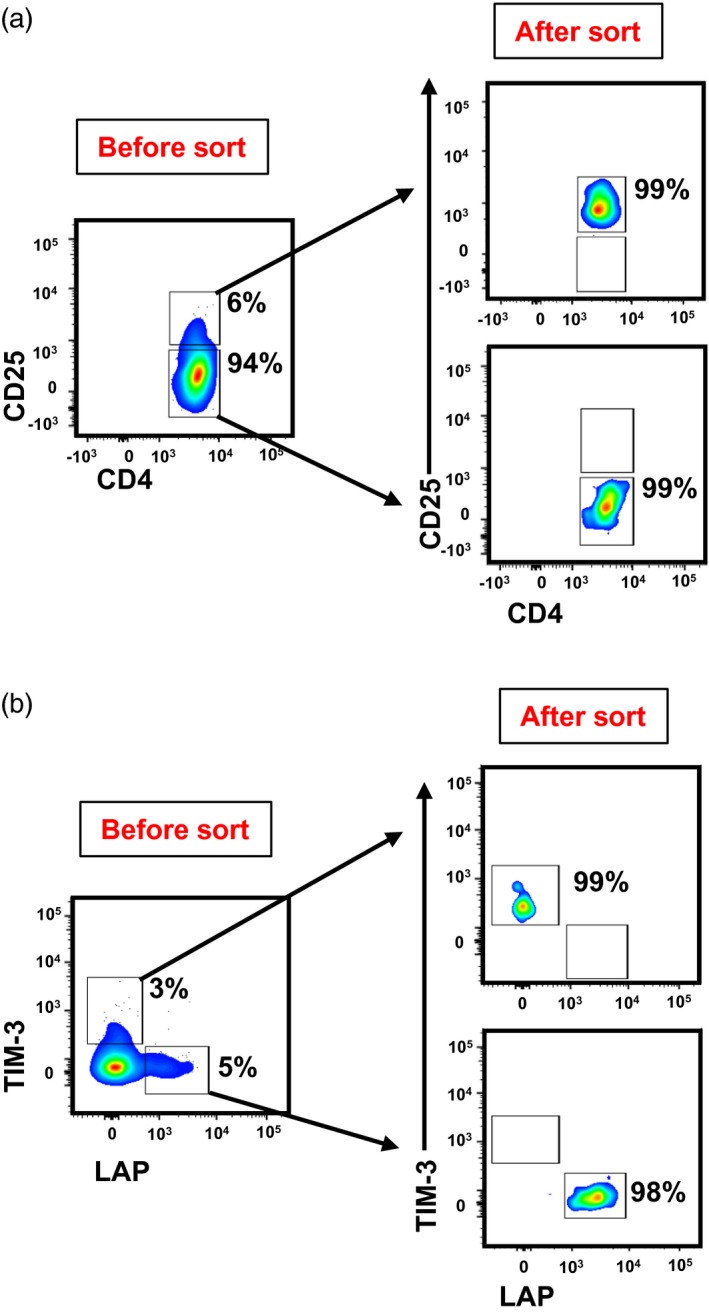
Sorting strategy and purity of CD4+CD25+ conventional regulatory T cell (Treg) and CD4+ latency‐associated peptide (LAP)–T cell immunoglobulin‐3 (TIM‐3)+ and CD4+LAP+TIM‐3– T cells. Activated peripheral blood mononuclear cells (PBMC) from healthy donors (HD) were stained with CD4, CD25, TIM‐3 and LAP antibodies to sort conventional Treg, responder T cells and CD4+TIM‐3+ LAP– and CD4+TIM‐3–LAP+ T cells. Representative flow cytometric plots gated on CD4+ cells from live cells, showing the gating strategy employed for sorting CD4+CD25+ conventional Treg and CD4+CD25– responder T cells, and the purity of sorted populations. (a) Representative flow cytometric plots CD4+ cells from live cells, showing the gating strategy employed for sorting CD4+TIM‐3+LAP‐ and CD4+TIM‐3‐LAP+ T cells, and the purity of sorted populations (b).
Figure 3.
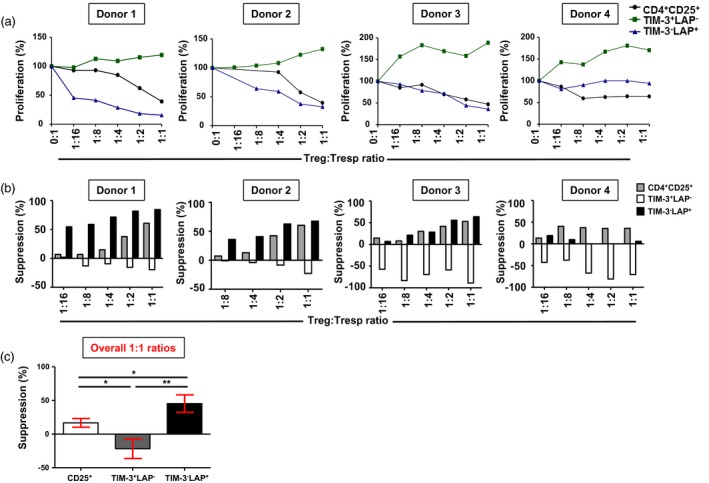
Suppressive potential of various T cell subsets on CD4+CD25– responder T cells. Carboxyfluorescein diacetate succinimidyl ester (CFSE)‐based suppression assays were performed to investigate responder T cell proliferation. The effects of CD4+CD25+ conventional regulatory T cell (Treg) and CD4+ T cell immunoglobulin‐3 (TIM‐3)+/–latency‐associated peptide (LAP)+/– T cells on the proliferation of CD4+CD25– responder T cells were studied on sorted populations (> 95% purity). Line graphs show the effects on proliferation of CD4+CD25– responder T cells by varying ratios of Treg/TIM‐3+/–LAP+/– T cells and responder T cells in four healthy donors (HD) (a). Bar plots show the percentages of suppression of responder T cells by varying ratios of Treg and TIM‐3+/–LAP+/– T cells in four HD (b). Bar plot shows the comparison in suppressive activity of conventional Treg, TIM‐3+ T cells and LAP+ T cells (c). Data represent the mean values ± standard error of the mean (s.e.m.) from the four HD.
PD‐1 blockade does not affect the suppressive potential of Treg
We investigated the suppressive activity of Treg in the presence or absence of pembrolizumab. Pembrolizumab effectively blocked PD‐1 expression in non‐activated (Fig. 4a) and activated CD4+ T cells (Fig. 4b). We found that pembrolizumab did not affect the overall suppressive activity of conventional Treg (Fig. 4c–e) or TIM‐3+ (Fig. 5a) and LAP+ T cells (Fig. 5b). Altogether, our data suggest that pembrolizumab has no effects on the suppression/proliferation of T cell subsets.
Figure 4.
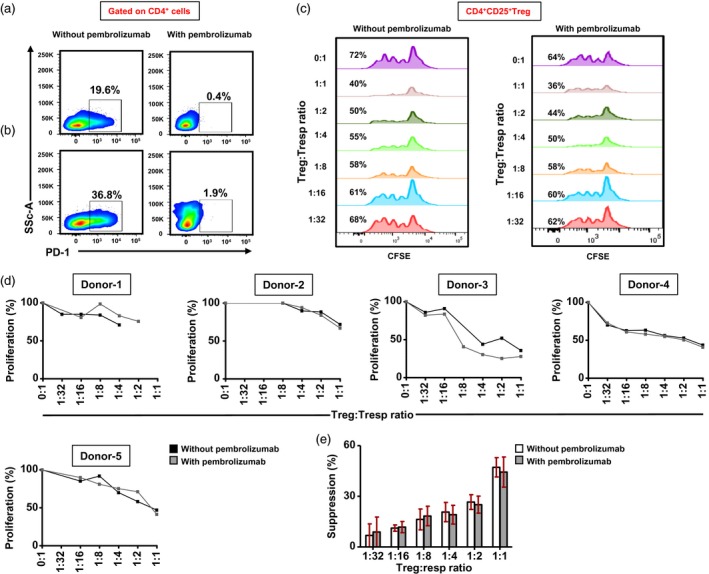
Effects of pembrolizumab on the suppressive activity of CD4+CD25+ conventional regulatory T cells (Treg). Sorted CD4+CD25+ Treg and CD4+CD25– responder T cells (Tresp) (both > 95% purity) were cultured in different ratios in the presence or absence of pembrolizumab (2 µg/ml). Efficacy of pembrolizumab was first examined by flow cytometry. Representative flow cytometric plots show the effects of pembrolizumab on programmed death 1 (PD‐1) expression after 24 h on non‐activated (a) and activated (b) CD4+ T cells. Representative histogram plots show the percentage of carboxyfluorescein diacetate succinimidyl ester (CFSE) loss in different Treg : Tresp ratios, treated with or without pembrolizumab (c). Line graphs show the effects of pembrolizumab treatment on Tresp proliferation in different Treg : Tresp ratios in five healthy donors (HD) (d). Bar plot shows the effects of pembrolizumab treatment on Treg suppression in five HD (e). Data represent the mean values ± standard error of the mean (s.e.m.) from five HD.
Figure 5.
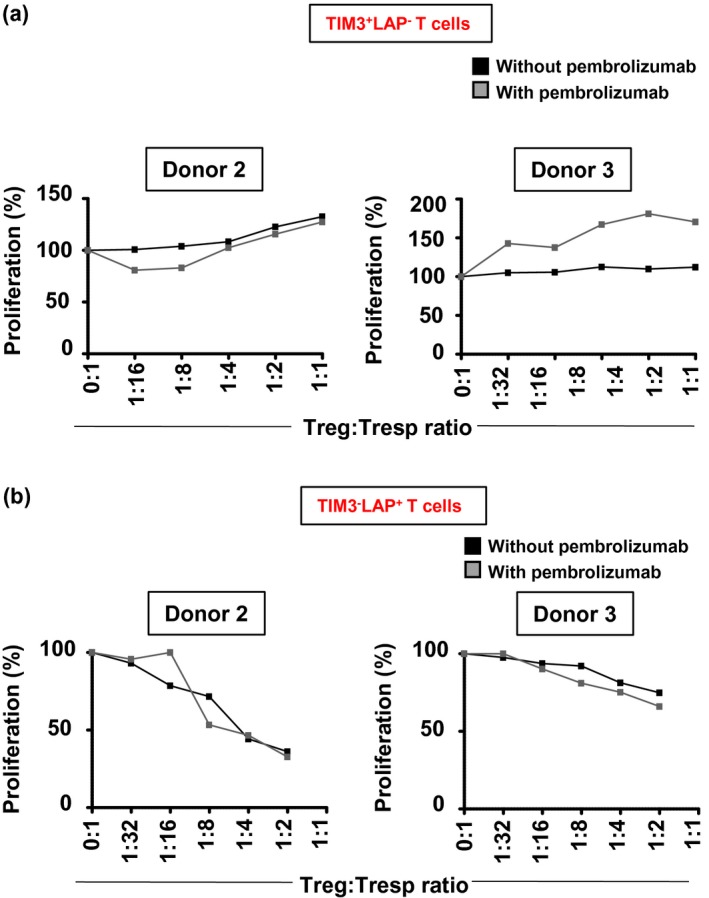
Effects of pembrolizumab on CD4+ latency‐associated peptide (LAP–) T cell immunoglobulin‐3 (TIM‐3)+ and CD4+LAP+TIM3– T cells. Sorted CD4+TIM‐3+, CD4+ (LAP)+ T cells and CD4+CD25– responder T cells (Tresp) (all > 95% purity) were cultured in different ratios in the presence or absence of pembrolizumab (2 µg/ml). Line graphs show the effect of pembrolizumab on proliferation of Tresp cells with varying ratios of CD4+TIM‐3+ T cells in two healthy donors (HD) (a). Line graphs show the effect of pembrolizumab on proliferation of Tresp cells with varying ratios of CD4+LAP+ T cells in two HD (b).
Discussion
IC expression on T cells have multi‐faceted effects; IC expression on effector T cells (Teff) ensures proper attenuation of Teff responses and expression on Treg guarantees the proper function of Treg to control Teff functions 9. Moreover, the expression of various functional markers has been shown to indicate in‐vivo suppressive activity of Treg 10.
TIM‐3 was identified as an IC expressed on differentiated T helper type 1 (Th1) T cells 11. Subsequent studies showed that TIM‐3 signaling is required for the induction of antigen‐specific tolerance and blockade enhances the development of spontaneous autoimmunity 9. TIM‐3 is constitutively expressed on innate immune cells and elevated expression levels following stimulation return to normal levels after T cells progress into exhaustive or dysfunctional states 12. In accordance with previous reports 13, our results showed that following activation, the majority of TIM‐3+ cells co‐expressed PD‐1. Interestingly, Li et al. previously showed that TIM‐3+ TILs proliferate spontaneously, but not TIM‐3+PD‐1+ TILs 14. In addition, Liu et al. recently showed that CD4+CD25highCD127‐TIM‐3+ TILs in HNCC patients are highly suppressive, as > 97% of CD4+CD25highCD127– express FoxP3 15. We found that circulating TIM‐3+ cells exhibit a non‐Treg phenotype after initial stimulation, as they do not express FoxP3, a critical regulator of Treg development and function 16. Lack of FoxP3 expression after early activation in TIM‐3+ cells suggested that these cells are non‐suppressive and could be effector cells. Gorman and Colgan showed that, following stimulation, Th1 cells express TIM‐3 and release more cytokines than TIM‐3– cells 17. These proliferating TIM‐3+ T cells are functionally competent and have an amplified ability to produce cytokines such as IL‐2, that serves as an autocrine growth factor, that result in increased proliferation of responder T cells. This was evident in our results as we found that co‐culturing responder T cells with TIM‐3+ T cells resulted in greater proliferation, as shown by CFSE proliferation assays.
Our previous work showed that ICI, pembrolizumab and tremilimumab [anti‐cytotoxic T lymphocyte antigen‐4 (CTLA‐4)] do not affect the phenotype of conventional Treg, both in vitro and in vivo 18, 19, 20. In this study, we investigated the effects of pembrolizumab on the suppressive activity of Treg, including conventional Treg and highly suppressive LAP+ Treg. There was no effect of pembrolizumab on the suppressive activity of these Treg. Therefore, our results show that Treg are resistant to ICI, which can affect the efficacy of ICI via tumor extrinsic mechanisms of resistance to immunotherapy 21. Targeting Treg through inhibition of suppressive function or recruitment to TME are plausible strategies to be used in combination with ICI to restore Treg : Teff ratios for clinical benefits 22. Of note, there have been reports of induced depletion of FoxP3+ Treg following ICI in tumor models 23, 24, 25 and in melanoma patients via monocyte‐mediated Treg lysis 26. However, a recent study on melanoma, prostate and bladder cancer patients showed that anti‐CTLA‐4 therapy does not deplete Treg populations 27. Moreover, it is important to note that studies that showed the effect of ICI on Treg mainly used anti‐CTLA‐4 antibodies, and there are no available studies that showed a direct effect of anti‐PD‐1 antibodies on Treg function. Treg responses to ICI are complex and differ from other immune cell populations 28, and therefore warrant further investigations.
In addition, our results indicate that pembrolizumab inhibits the negative regulation of T cell responses by barricading the PD‐1 pathway while other immune cell populations either remain unaffected, or induces expansion of selective immune‐cell populations that can assist in improved clinical benefits. For instance, tumor biopsies from 102 melanoma patients undergoing pembrolizumab treatment showed a significant increase in T cell frequency in therapy responders; the expanded populations included CD8+ memory T cells, but Treg and natural killer cells were not altered by PD‐1 therapy 29. In addition, PD‐1 blockade in lung cancer patients lead to an increase in CD8+PD‐1+ cells in periphery that may be associated with better clinical outcomes 30.
Disclosures
The authors declare no conflicts of interest.
Author contributions
S. T. performed experimental work, data analyses and wrote the manuscript. V. N. assisted in experimental work, data analyses and reviewing manuscript. G. P. performed cell sorting, reviewed and corrected the manuscript. E. E. conceived the idea, designed the study, obtained funds, supervised the project, analyzed and interpreted data and wrote and revised the manuscript. All authors were involved in the final approval of the manuscript.
Acknowledgements
This work was supported by a start‐up grant (VR04) for Dr Eyad Elkord from Qatar Biomedical Research Institute, Qatar Foundation.
References
- 1. Lindau D, Gielen P, Kroesen M, Wesseling P, Adema GJ. The immunosuppressive tumour network: myeloid‐derived suppressor cells, regulatory T cells and natural killer T cells. Immunology 2013; 138:105–15. [DOI] [PMC free article] [PubMed] [Google Scholar]
- 2. Smith‐Garvin JE, Koretzky GA, Jordan MS. T cell activation. Annu Rev Immunol 2009; 27:591–619. [DOI] [PMC free article] [PubMed] [Google Scholar]
- 3. Buchholz VR, Schumacher TN, Busch DH. T cell fate at the single‐cell level. Annu Rev Immunol 2016; 34:65–92. [DOI] [PubMed] [Google Scholar]
- 4. Jiang Y, Li Y, Zhu B. T‐cell exhaustion in the tumor microenvironment. Cell Death Dis 2015; 6:e1792. [DOI] [PMC free article] [PubMed] [Google Scholar]
- 5. Syn NL, Teng MWL, Mok TSK, Soo RA. De‐novo and acquired resistance to immune checkpoint targeting. Lancet Oncol 2017; 18:e731–41. [DOI] [PubMed] [Google Scholar]
- 6. Keir ME, Butte MJ, Freeman GJ, Sharpe AH. PD‐1 and its ligands in tolerance and immunity. Annu Rev Immunol 2008; 26:677–704. [DOI] [PMC free article] [PubMed] [Google Scholar]
- 7. Malek TR, Castro I. Interleukin‐2 receptor signaling: at the interface between tolerance and immunity. Immunity 2010; 33:153–65. [DOI] [PMC free article] [PubMed] [Google Scholar]
- 8. Elkord E, Abd Al Samid M, Chaudhary B. Helios, and not FoxP3, is the marker of activated Tregs expressing GARP/LAP. Oncotarget 2015; 6:20026–36. [DOI] [PMC free article] [PubMed] [Google Scholar]
- 9. Anderson AC, Joller N, Kuchroo VK. Lag‐3, Tim‐3, and TIGIT: co‐inhibitory receptors with specialized functions in immune regulation. Immunity 2016; 44:989–1004. [DOI] [PMC free article] [PubMed] [Google Scholar]
- 10. Chaudhary B, Elkord E. Regulatory T cells in the tumor microenvironment and cancer progression: role and therapeutic targeting. Vaccines (Basel) 2016; 4:28. [DOI] [PMC free article] [PubMed] [Google Scholar]
- 11. Monney L, Sabatos CA, Gaglia JL et al Th1‐specific cell surface protein Tim‐3 regulates macrophage activation and severity of an autoimmune disease. Nature 2002; 415:536–41. [DOI] [PubMed] [Google Scholar]
- 12. Han G, Chen G, Shen B, Li Y. Tim‐3: an activation marker and activation limiter of innate immune cells. Front Immunol 2013; 4:449. [DOI] [PMC free article] [PubMed] [Google Scholar]
- 13. Sakuishi K, Apetoh L, Sullivan JM, Blazar BR, Kuchroo VK, Anderson AC. Targeting Tim‐3 and PD‐1 pathways to reverse T cell exhaustion and restore anti‐tumor immunity. J Exp Med 2010; 207:2187–94. [DOI] [PMC free article] [PubMed] [Google Scholar]
- 14. Li J, Shayan G, Avery L et al Tumor‐infiltrating Tim‐3(+) T cells proliferate avidly except when PD‐1 is co‐expressed: evidence for intracellular cross talk. Oncoimmunology 2016; 5:e1200778. [DOI] [PMC free article] [PubMed] [Google Scholar]
- 15. Liu Z, McMichael EL, Shayan G et al Novel effector phenotype of tim‐3(+) regulatory T cells leads to enhanced suppressive function in head and neck cancer patients. Clin Cancer Res 2018; 24:4529–38. [DOI] [PMC free article] [PubMed] [Google Scholar]
- 16. Sakaguchi S, Miyara M, Costantino CM, Hafler DA. FOXP3+ regulatory T cells in the human immune system. Nat Rev Immunol 2010; 10:490–500. [DOI] [PubMed] [Google Scholar]
- 17. Gorman JV, Colgan JD. Acute stimulation generates Tim‐3‐expressing T helper type 1 CD4 T cells that persist in vivo and show enhanced effector function. Immunology 2018; 154:418–33. [DOI] [PMC free article] [PubMed] [Google Scholar]
- 18. Khan S, Burt DJ, Ralph C, Thistlethwaite FC, Hawkins RE, Elkord E. Tremelimumab (anti‐CTLA4) mediates immune responses mainly by direct activation of T effector cells rather than by affecting T regulatory cells. Clin Immunol 2011; 138:85–96. [DOI] [PubMed] [Google Scholar]
- 19. Ralph C, Elkord E, Burt DJ et al Modulation of lymphocyte regulation for cancer therapy: a phase II trial of tremelimumab in advanced gastric and esophageal adenocarcinoma. Clin Cancer Res 2010; 16:1662–72. [DOI] [PubMed] [Google Scholar]
- 20. Toor SM, Syed Khaja AS, Alkurd I, Elkord E. In‐vitro effect of pembrolizumab on different T regulatory cell subsets. Clin Exp Immunol 2018; 191:189–97. [DOI] [PMC free article] [PubMed] [Google Scholar]
- 21. Sharma P, Hu‐Lieskovan S, Wargo JA, Ribas A. Primary, adaptive, and acquired resistance to cancer immunotherapy. Cell 2017; 168:707–23. [DOI] [PMC free article] [PubMed] [Google Scholar]
- 22. Sasidharan Nair V, Elkord E. Immune checkpoint inhibitors in cancer therapy: a focus on T‐regulatory cells. Immunol Cell Biol 2018; 96:21–33. [DOI] [PubMed] [Google Scholar]
- 23. Selby MJ, Engelhardt JJ, Quigley M et al Anti‐CTLA‐4 antibodies of IgG2a isotype enhance antitumor activity through reduction of intratumoral regulatory T cells. Cancer Immunol Res 2013; 1:32–42. [DOI] [PubMed] [Google Scholar]
- 24. Simpson TR, Li F, Montalvo‐Ortiz W et al Fc‐dependent depletion of tumor‐infiltrating regulatory T cells co‐defines the efficacy of anti‐CTLA‐4 therapy against melanoma. J Exp Med 2013; 210:1695–710. [DOI] [PMC free article] [PubMed] [Google Scholar]
- 25. Tang F, Du X, Liu M, Zheng P, Liu Y. Anti‐CTLA‐4 antibodies in cancer immunotherapy: selective depletion of intratumoral regulatory T cells or checkpoint blockade? Cell Biosci 2018; 8:30. [DOI] [PMC free article] [PubMed] [Google Scholar]
- 26. Romano E, Kusio‐Kobialka M, Foukas PG et al Ipilimumab‐dependent cell‐mediated cytotoxicity of regulatory T cells ex vivo by nonclassical monocytes in melanoma patients. Proc Natl Acad Sci USA 2015; 112:6140–5. [DOI] [PMC free article] [PubMed] [Google Scholar]
- 27. Sharma A, Subudhi SK, Blando J et al Anti‐CTLA‐4 Immunotherapy does not deplete FOXP3(+) regualtory T cells (Tregs) in human cancers. Clin Cancer Res 2018; 168. [Epub ahead of print.] [DOI] [PMC free article] [PubMed] [Google Scholar]
- 28. Whiteside TL. FOXP3+ Treg as a therapeutic target for promoting anti‐tumor immunity. Expert Opin Ther Targets 2018; 22:353–63. [DOI] [PMC free article] [PubMed] [Google Scholar]
- 29. Ribas A, Shin DS, Zaretsky J et al PD‐1 blockade expands intratumoral memory T cells. Cancer Immunol Res 2016; 4:194–203. [DOI] [PMC free article] [PubMed] [Google Scholar]
- 30. Kamphorst AO, Pillai RN, Yang S et al Proliferation of PD‐1+ CD8 T cells in peripheral blood after PD‐1‐targeted therapy in lung cancer patients. Proc Natl Acad Sci USA 2017; 114:4993–8. [DOI] [PMC free article] [PubMed] [Google Scholar]