Abstract
Background and Purpose
Excessive fructose consumption is a risk factor for liver fibrosis. Pterostilbene protects against liver fibrosis. Here, we investigated the potential role and the mechanisms underlying the hepatocyte epithelial‐mesenchymal transition (EMT) in fructose‐induced liver fibrosis and protection by pterostilbene.
Experimental Approach
Characteristic features of liver fibrosis in 10% fructose‐fed rats and EMT in 5 mM fructose‐exposed BRL‐3A cells with or without pterostilbene and the change of miR‐34a/Sirt1/p53 and transforming growth factor‐β1 (TGF‐β1)/Smads signalling were examined. MiR‐34a inhibitor, miR‐34a minic, or p53 siRNA were used to explore the role of miR‐34a/Sirt1/p53 signalling in fructose‐induced EMT and the action of pterostilbene.
Key Results
Pterostilbene prevented fructose‐induced liver injury with fibrosis in rats. Fructose caused hepatocyte undergoing EMT, gaining fibroblast‐specific protein 1 and vimentin, and losing E‐cadherin, effects attenuated by pterostilbene. Moreover, fructose induced miR‐34a overexpression in hepatocytes with down‐regulated Sirt1, increased p53 and ac‐p53, and activated TGF‐β1/Smads signalling, whereas these disturbances were suppressed by miR‐34a inhibitor. Additionally, miR‐34a inhibitor and p53 siRNA prevented TGF‐β1‐driven hepatocyte EMT under fructose exposure. Pterostilbene down‐regulated miR‐34a, up‐regulated Sirt1, and suppressed p53 activation and TGF‐β1/Smads signalling in fructose‐stimulated animals and cells but showed no additional effects with miR‐34a inhibitor on miR‐34a/Sirt1/p53 signalling in fructose‐exposed hepatocytes.
Conclusions and Implications
These results strongly suggest that activation of miR‐34a/Sirt1/p53 signalling is required for fructose‐induced hepatocyte EMT mediated by TGF‐β1/Smads signalling, contributing to liver fibrosis in rats. Pterostilbene exhibits a protective effect against liver fibrosis at least partly through inhibiting miR‐34a/Sirt1/p53 signalling activation.
Abbreviations
- ALT
alanine aminotransferase
- AST
aspartate transaminase
- ECM
extracellular matrix
- EMT
epithelial‐mesenchymal transition
- FSP1
fibroblast‐specific protein 1
- IL‐1β
interleukin‐1β
- IL‐6
interleukin‐6
- Sirt1
sirtuin 1
- TC
total cholesterol
- TG
triglycerides
- TGF‐β1
transforming growth factor‐β1
- TNF‐α
tumor necrosis factor‐α
- α‐SMA
α‐smooth muscle actin
What is already known
Excessive fructose consumption is a risk factor for liver fibrosis.
Pterostilbene shows anti‐liver fibrosis activity.
What this study adds
Evidence that pterostilbene inhibits miR‐34a/Sirt1/p53 signaling, thus attenuating fructose‐stimulated hepatocyte EMT and liver fibrosis.
What is the clinical significance
Pterostilbene may be useful in the clinical treatment of fructose‐associated liver fibrosis.
1. INTRODUCTION
Excessive consumption of fructose is a risk factor for liver fibrosis in humans and animals (Cydylo, Davis, & Kavanagh, 2017; Lirio et al., 2016; Mule, Calcaterra, Nardi, Cerasola, & Cottone, 2014), but the underlying molecular mechanisms are still unclear. The epithelial‐mesenchymal transition (EMT) in hepatocytes is an important cellular event propagating the progression of liver fibrosis (Rowe et al., 2011). transforming growth factor‐β1 (TGF‐β1) triggers hepatocyte EMT characterized by up‐regulation of mesenchymal markers, such as vimentin and fibroblast‐specific protein 1 (FSP1) and down‐regulation of epithelial markers (such as E‐cadherin). Thus, the changing pattern of TGF‐β1/Smads signalling is suggested to induce cell EMT, participating in liver fibrosis (Kong et al., 2015; Zhang et al., 2016).
Dysregulation of microRNA 34a (miR‐34a) is highly correlated with organ fibrosis including liver fibrosis (Cermelli, Ruggieri, Marrero, Ioannou, & Beretta, 2011; Cui et al., 2017b; Du et al., 2012; Salvoza, Klinzing, Gopez‐Cervantes, & Baclig, 2016; Shetty et al., 2017), but there are some contradictions on its action under different conditions. MiR‐34a overexpression is observed in myocardial infarction, and its inhibition can reduce the severity of experimental cardiac fibrosis in mice (Huang, Qi, Du, & Zhang, 2014). Moreover, miR‐34a expression is increased in carbon tetrachloride induced liver fibrosis in rats (Tian, Ji, Zang, & Cao, 2016). On the contrary, mice with miR‐34a ablation develop more severe pulmonary fibrosis induced by bleomycin than wild‐type animals (Cui et al., 2017a). MiR‐34a is a direct target of p53 but, at high levels, increases p53 and acetylated‐p53 (ac‐p53) by inhibiting sirtuin 1 (Sirt1) in hepatocytes (Tian et al., 2016) and alveolar epithelial cells (Shetty et al., 2017). Of note, miR‐34a is always down‐regulated due to deletion and/or mutation of p53 in cancer cells (Lou et al., 2015; Ye et al., 2016). Thus, it is possible that miR‐34a/Sirt1/p53 signalling may form a positive feedback loop to control the development of pulmonary fibrosis (Shetty et al., 2017). Activated p53 isoforms including ac‐p53 and phosphorylated p53 (p‐p53) promote TGF‐β1‐driven EMT response by forming transcriptionally active multiprotein complexes with Smad3 (Piccolo, 2008; Termen, Tan, Heldin, & Moustakas, 2013). TGF‐β1‐ and methotrexate‐induced up‐regulation of miR‐34a mediates EMT in alveolar epithelial cells (Takano, Nekomoto, Kawami, & Yumoto, 2017), whereas hypoxia‐mediated down‐regulation of miR‐34a promotes EMT in tubular epithelial cells (Du et al., 2012). Additionally, high levels of miR‐34a increased the profibrogenic activity of TGF‐β1 in cardiac fibroblast, whereas its inhibition decreased the activity (Huang, Qi, Du, & Zhang, 2014). Therefore, we postulated that fructose may induce TGF‐β1‐driven EMT in hepatocytes through activating the miR‐34a/Sirt1/p53 signalling pathway, which contributes to liver fibrosis in animals.
Pterostilbene (trans‐3,5‐dimethoxy‐4‐hydroxystilbene), a structural analogue of resveratrol found mainly in grapes, wine, blueberries, and other berries, has gained much attention recently due to its pleiotropic pharmacological effects on various chronic human diseases (Chiou et al., 2010; Wang et al., 2015). It lowers body weight, plasma lipoproteins, and cholesterol levels, as well as liver lipid accumulation in animals with diabetes and diet‐induced obesity (Bhakkiyalakshmi et al., 2016; Gomez‐Zorita et al., 2014; Rimando, Nagmani, Feller, & Yokoyama, 2005). Pterostilbene also alleviates dimetyl nitrosamine‐induced liver fibrosis by reducing hepatic α‐smooth muscle (α‐SMA) and collagen 1 and inhibits TGF‐β1/Smads signalling in rats (Lee et al., 2013). As with resveratrol, pterostilbene is an activator of Sirt1 (Liu et al., 2017). Resveratrol can protect HEI‐OC1 cells from miR‐34a mimic‐induced cell death by inhibiting miR‐34a/Sirt1/p53 signalling (Xiong et al., 2015). Therefore, we speculated that pterostilbene may modulate fructose‐induced miR‐34a/Sirt1/p53 signalling, contributing to its prevention of hepatocyte EMT and liver fibrosis.
Here, we have investigated the role of miR‐34a/Sirt1/p53 signalling in fructose‐induced hepatocyte EMT and liver fibrosis and in the prevention by pterostilbene. Allopurinol was used as a positive control as it exhibits hepatoprotective effect probably mediated by its antifibrotic property with the ability to reduce TGF‐β1 in animal models (Aldaba‐Muruato, Moreno, Shibayama, Tsutsumi, & Muriel, 2012; Aldaba‐Muruato, Moreno, Shibayama, Tsutsumi, & Muriel, 2013).
2. METHODS
2.1. Animals and treatments
All animal care and experimental procedures complied with the guidelines for the care and use of laboratory animals and were approved by Nanjing University. Animal studies are reported in compliance with the ARRIVE guidelines (Kilkenny, Browne, Cuthill, Emerson, & Altman, 2010) and with the recommendations made by the British Journal of Pharmacology (McGrath & Lilley, 2015). Male Sprague–Dawley rats (180–220 g, RRID:RGD_70508) were purchased from the Laboratory Animal Center (Zhejiang Province, P. R. China) and the permission number is SCXK (zhe) 2014‐0001. Rats were maintained at a specific pathogen free facility at 22–24°C with a relative humidity of 50–60% and a 12:12 hr light–dark cycle.
The normal control group received standard rat chow (18.2% protein, 62.6% carbohydrate and 4.8% fat) and tap water, while the fructose‐fed group received the same standard rat chow and 10% fructose solution for a total of 16 weeks, as described earlier (Li, Li, Kong, & Hu, 2010). From the 7th week, fructose‐fed rats were randomly divided into five subgroups (10 rats per group): the vehicle group (water), three pterostilbene groups (10, 20, or 40 mg·kg−1), and one allopurinol group (5 mg·kg−1). Pterostilbene (≥98%) and allopurinol (≥99%,) were suspended in water by ultrasound and administered immediately via intragastric gavage (1 ml·per 100 g ). The doses of pterostilbene and allopurinol were chosen from our previous study (Wang et al., 2015). At the same time, drinking water with 10% (w/v) fructose was continued for all of fructose‐fed rats. Body weight was recorded once a week throughout the experiment.
At the end of drug treatment, rats were placed in metabolism cages for 24 hr to measure the ingestion of food and water respectively. Glucose tolerance and insulin resistance in rats were estimated by oral glucose tolerance test and insulin tolerance test respectively (Li et al., 2010). Rats were anaesthetized using sodium pentobarbital (50 mg·kg−1) after fasting for 12 hr to collect blood from the retro‐orbital venous plexus. Blood samples were centrifuged (3000× g) at 4°C for 10 min to get the serum samples frozen at −80°C for biochemical assays Parts of rat liver tissues for histological analysis were fixed with 4% paraformaldehyde. Others were cut into equal pieces and stored at −80°C until used for total RNA or protein isolation and biochemical assays.
2.2. Biochemical analysis
Triglycerides (TG) and total cholesterol (TC) contents in liver, as well as aspartate transaminase (AST) and alanine aminotransferase (ALT) levels in serum, were measured by commercially available biochemical kits (Nanjing Jiancheng Bioengineering Institute, Jiangsu, China). Liver levels of interleukin‐1β (IL‐1β); interleukin‐6 (IL‐6) and tumor necrosis factor‐α (TNF‐α) were determined by commercially available elisa kits (GeneTimes Technology, Shanghai, China).
2.3. Cell culture, induction, and treatment
The normal rat hepatocyte cell line BRL‐3A (P9‐13, RRID:CVCL_0606) was purchased from Cell Bank of the Chinese Academy of Sciences (Shanghai, China). Cells were cultured under standard culture condition (37°C, 5% CO2) in DMEM medium supplemented with 10% FBS (Wisent, St‐Bruno, QC, Canada). To evaluate the EMT in hepatocytes under high fructose induction, BRL‐3A cells were seeded into six‐well plates at 1 × 10⁶ cells per well overnight. Based on the results of our previous study ( Zhao et al., 2017 ) and preliminary experiments, 5 mM fructose was used to stimulate BRL‐3A cells. All the cell experiments were repeated 6 times, and there were 3 replicates (3 cell‐wells) in each experiment.
Scrambled control, miR‐34a mimic, miR‐34a inhibitor, and p53 siRNA were synthesized by GenePharma (Shanghai, China). The sequences are listed in Table 1. Transfections of scrambled control, miR‐34a mimic, miR‐34a inhibitor (50 nM), and p53 siRNA (50 nM) in BRL‐3A cells were performed using Lipofectamine 2000 (Invitrogen, Carlsbad, CA, USA), according to the manufacturer's instructions. The efficiency of the transfection was evaluated by measuring miR‐34a expression or p53 mRNA levels at 24 hr by qRT‐PCR.
Table 1.
The sequences of siRNA, miRNA inhibitor, and primers used in qRT‐PCR
| Genes | Sense primer (5′ → 3′) | Antisense primer (5′ → 3′) |
|---|---|---|
| r/hmiR‐34a | ACACTCCAGCTGGGTGGCAGTGTCTTAGCT | CTCAACTGGTCTCGTGGAGTCGGCAATTCAGTTGAGACAACCAG |
| URP | TGGTGTCGTGGAGTCG | |
| U6 | CTCGCTTCGGCAGCACA | AACGCTTCACGAATTTGCGT |
| rp53 | GGGAATGGGTTGGTAGTT | AGAGTGGAGGAAATGGGT |
| rGADPH | CCCCCAATGTATCCGTTGTG | TAGCCCAGGATGCCCTTTAGT |
| hp53 | GTTCCGAGAGCTGAATGAGG | TCTGAGTCAGGCCCTTCTGT |
| hGADPH | TGTGGGCATCAATGGATTTGG | ACACCATGTATTCCGGGTCAAT |
| r/hmiR‐34a inhibitor | ACAACCAGCUAAGACACUGCCA | |
| Scrambled control inhibitor | CAGUACUUUUCUCUAGUACAA | |
| rP53 siRNA | GCUCCGACUAUACCACUAUTT | AUAGUGGUAUAGUCGGAGCTT |
| hP53 siRNA | CUACUUCCUGAAAACAACGdTdT | CGUUGUUUUCAGGAAGUAGdTdT |
| Scrambled control siRNA | UUCUCCGAACGUGUCACGUTT | ACGUGACACGUUCGGAGAATT |
| r/hmiR‐34a mimics | UGGCAGUGUCUUAGCUGGUUGU | AACCAGCUAAGACACUGCCAUU |
To investigate the effects of pterostilbene and allopurinol on fructose‐induced EMT state in hepatocytes, BRL‐3A cells were seeded into six‐well plates at 1 × 10⁶ cells per well. At confluence, cells were starved in serum‐free medium for 24 hr and then incubated with different concentrations of pterostilbene or allopurinol in the presence of 5 mM fructose. Pterostilbene or allopurinol was dissolved in the culture medium containing 0.5% DMSO, which showed no effect on the tested genes and proteins of the cells in this study. These cells were collected for qRT‐PCR, western blotting, or immunofluorescent staining analysis
2.4. qRT‐PCR analysis
Total RNA was extracted from BRL‐3A cells and rat liver tissues, using Trizol reagent (Gibco BRL); Samples (1 μg) of total RNA was reverse transcribed using the M‐MLV‐RT system (Promega), and carried out at 42°C for 1 hr and terminated by the enzyme deactivation at 70°C for 10 min. qRT‐PCR was carried out using SYBR Green (Bio‐Rad) in ABI PRISM™ 7900HT detection systems (Applied Biosystems). All the primers were provided by Invitrogen Corporation. Primer sequences were listed in Table 1. The reverse transcription reaction products were amplified by qRT‐PCR with iTaqTM Universal SYBR® Green Supermix (Bio‐Rad) and respective primers. The qRT‐PCR cycling conditions were 95°C for 5 min followed by 40 cycles of a two‐step amplification programme (95°C for 15 s and 60°C for 20 s). Specificity of the amplification was confirmed using a melting curve analysis. Data were collected and recorded by CFX Manager Software (Bio‐Rad) and expressed as a function of threshold cycle (Ct). The samples for qRT‐PCR analysis were evaluated using a single predominant peak as a quality control. Relative expressions of target genes were determined by the Ct (2−∆∆Ct) method. MiRNAs or mRNAs were normalized to U6 or GAPDH respectively.
2.5. Western blot analysis
The antibody‐based procedures used in this study comply with the recommendations made by the British Journal of Pharmacology. BRL‐3A cells and rat liver tissues were homogenized in 10 volumes of hypotonic buffer (25 mM Tris–HCl, pH 8.0, 1 mM EDTA, 5 μg·ml−1 leupeptin, 1 mM Pefabloc SC, 50 μg·ml−1 aprotinin, 5 μg·ml−1 soybean trypsin inhibitor, 4 mM benzamidine). The final supernatants were obtained by centrifugation at 12,000× g for 20 min. Protein concentrations were determined by BCA protein assay kit (Thermo, USA) with BSA as a standard. The total protein extract was used for western blot analysis for the markers of liver fibrosis (collagen 1 and α‐SMA) and hepatocyte EMT (FSP1, vimentin, and E‐cadherin), as well as the key molecules of miR‐34a/Sirt1/p53 and TGF‐β1/Smads signalling. Samples were standardized by total protein content and subjected to 10% or 12% SDS‐PAGE, followed by immunoblotting using these primary polyclonal antibodies: rabbit anti‐collagen 1 (1:10,000, Cat# ab34710, RRID:AB_731684), rabbit anti‐α‐SMA (1:200, Cat# ab5694, RRID:AB_2223021), rabbit anti‐FSP1 (1:1,000, Cat# ab197896, RRID:AB_2728774), rabbit anti‐vimentin (1:1,000, Cat# ab45939, RRID:AB_2257290), as well as rabbit anti‐p53 (1:1,000, Cat# ab131442, RRID:AB_11155283), and anti‐acetylated e_k; p53 (acetyl K370) (1:1,000, Cat# ab183544) were purchased from Abcam (Cambridge, United Kingdom). Rabbit anti‐TGF‐β1 (1:500, Cat# sc‐146, RRID:AB_632485), goat anti‐p‐Smad2 (1:500, Cat# sc‐6200, RRID:AB_656619), anti‐Smad2 (1:500, Cat# sc‐101801, RRID:AB_2239649), rabbit anti‐p‐Smad3 (1:500, Cat# sc‐130218, RRID:AB_2193186), mouse anti‐Smad3 (1:500, Cat# sc‐101154, RRID:AB_1129525), mouse anti‐Smad4 (1:500, Cat# sc‐7966, RRID:AB_627905), and rabbit anti‐GAPDH (1:2,000, Cat# sc‐25778, RRID:AB_10167668) were purchased from Santa Cruz Biotechnology (Santa Cruz, CA). Rabbit anti‐Sirt1 (1:1,000, Cat# 9475, RRID:AB_2617130) and mouse anti‐E‐cadherin (1:1,000, Cat# 14472, RRID:AB_2728770) were purchased from Cell Signalling Technology (Beverly, MA). Blots were incubated overnight at 4°C in primary antibody in 5% milk. The goat antirabbit secondary antibody (1:5,000, Cat# sc‐2004, RRID:AB_631746) and goat antimouse secondary antibody (1:5,000, Cat# sc‐2005, RRID:AB_631736) were purchased from Santa Cruz.
Immunoreactive bands were visualized by ECL immunoblot detection system (Pierce Biotechnology, Inc., Rockford, IL, USA) and exposed to Kodak X‐rayfilm (Eastman Kodak Company, Louisville, KY). Protein expression levels were defined as grey value (Version 1.4.2b, Mac OS X, ImageJ, RRID:SCR_003070, National Institutes of Health, Bethesda, Maryland, USA) and standardized to GAPDH and expressed as a fold of the basal level in control group.
2.6. Histopathological analysis and immunofluorescent staining
Rat liver tissues were fixed with 4% paraformaldehyde, embedded in paraffin, and sectioned (3 μm) transversely. Liver sections were stained with haematoxylin and eosin (H&E) reagent, Oil Red O solution, or Masson‐trichrome reagent. Images (n=10) were randomly selected from 6 liver sections of three rats per group to evaluate the histological score for hepatic injury. The histological scores for hepatic injury (oedema, necrosis of liver cells, and signs of fibrosis) were determined by two independent pathologists (blindly) according to a modified score system, described previously (Chevallier, Guerret, Chossegros, Gerard, & Grimaud, 1994).
BRL‐3A cells, fixed with 4% paraformaldehyde, were incubated with primary anti‐FSP1 (1:50) and anti‐E‐cadherin (1:100) at 4°C overnight. Liver sections (3 μm), after removal of paraffin wax, were incubated with primary antibodies anti‐FSP1 (1:2,000, Cat# ab197896, RRID:AB_2728774) and anti‐α‐SMA (1:100, Cat# ab5694, RRID:AB_2223021) at 4°C overnight. After washing three times with PBS, secondary antibodies, Alexa Fluor® 488 goat antirabbit IgG (1:500, Cat# A‐11008, RRID:AB_143165) and Alexa Fluor® 555 goat antimouse IgG (1:500, Cat# A‐21422, RRID:AB_141822) were incubated for 60 min at room temperature. The sections were stained with 5 μg·ml−1 DAPI (Sigma‐Aldrich) for 1 min. Images were captured on a Leica TCS SP5 confocal microscope (Leica, Richmond Hill, ON, Canada) with Openlab image software (Improvision, Lexington, MA, USA).
2.7. Data and statistical analysis
The data and statistical analysis in this study comply with the recommendations on experimental design and analysis in pharmacology (Curtis et al., 2015). All data were normally distributed and are presented as mean ± SEM. Statistical analyses were performed with GraphPad PRISM (version 6.0; Graph Pad Software, RRID:SCR_002798). For multiple comparisons, ANOVA was used followed by post hoc Dunnett's test (only in those tests where F achieved the necessary level of statistical significance, P < 0.05). For single comparisons, the unpaired Student's t test was used.
Materials
Pterostilbene was supplied by Bide Pharmatech Ltd. (Jiangsu, China), allopurinol by Sigma‐Aldrich (St. Louis, MO) and crystalline fructose by Wanqing Pharmatech Ltd (Jiangsu, China).
Nomenclature of targets and ligands
Key protein targets and ligands in this article are hyperlinked to corresponding entries in http://www.guidetopharmacology.org, the common portal for data from the IUPHAR/BPS Guide to PHARMACOLOGY (Harding et al., 2018), and are permanently archived in the Concise Guide to PHARMACOLOGY 2017/18 (Alexander et al., 2017).
3. RESULTS
3.1. Pterostilbene alleviates metabolic disorder and liver injury in fructose‐fed rats
As previously noted (Li et al., 2010; Sodhi et al., 2015) high fructose intake caused body weight gain and insulin resistance, but no significant changes in food intake and liquid intake of rats (Figure 1a–g). Staining of liver sections with H&E, Oil Red O, and Masson's trichrome showed that fructose induced hepatic histopathological changes, microvesicular steatosis, and extracellular matrix (ECM) accumulation in rats (Figure 2a). In addition, when the histological scores for hepatic injury were evaluated in liver sections, significantly higher scores was found in the fructose‐fed group compared with those from the control group (Figure 2b). Serum levels of AST and ALT in fructose‐fed rats were also significantly higher than those in the control group (Figure 2c,d). The levels of TG, TC, IL‐1β, IL‐6, and TNF‐α in liver were significantly increased in fructose‐fed rats (Figure S3A–E). Pterostilbene and allopurinol showed no significant effect on body weight but improved insulin resistance in this animal model (Figure 1a–g). Moreover, they attenuated fructose‐induced hepatic histopathological change, microvesicular steatosis, and ECM accumulation in rats (Figure 2a). After treatment with pterostilbene and allopurinol, the histological scores and serum levels of AST and ALT were significantly reduced in the liver of the fructose‐fed group (Figure 2b–d). Pterostilbene and allopurinol also reduced TG, TC, IL‐1β, IL‐6, and TNF‐α levels in the liver of fructose‐fed rats (Figure S3A–E).
Figure 1.
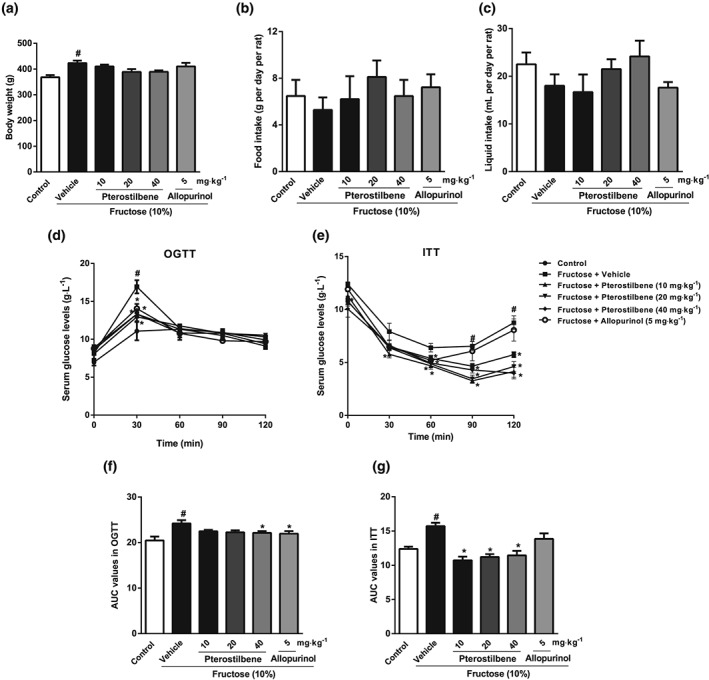
Effects of pterostilbene on body weight, food intake, liquid intake, and insulin resistance in fructose‐fed rats. Rats were fed with 10% fructose solution for a total of 16 weeks and treated with pterostilbene (10, 20, or 40 mg·kg−1) or allopurinol (5 mg·kg−1) from the 7th week. (a–c) data of body weight, food intake, and liquid intake (n = 10 rats per group). (d, e) Serum glucose levels in oral glucose tolerance test (OGTT) and insulin tolerance test (ITT) (n = 8 rats per group), with (f, g) the corresponding AUC values (n = 8 rats per group). Data shown are means ± SEM. # P < 0.05, significantly different from control group; *P < 0.05, significantly different from fructose vehicle group
Figure 2.
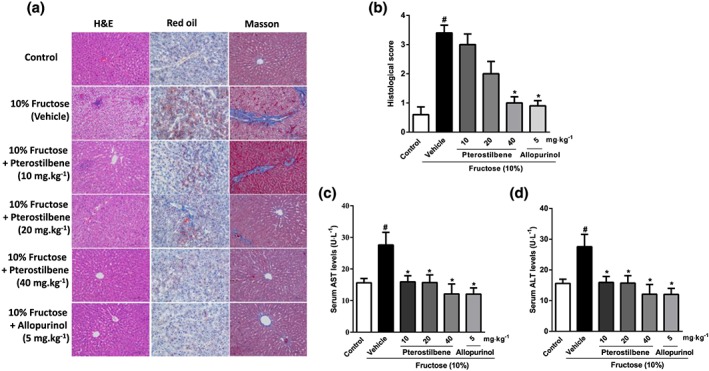
Effects of pterostilbene on fructose‐induced liver injury in rats. Rats were fed with 10% fructose solution for 16 weeks, and treated with pterostilbene (10, 20, or 40 mg·kg−1) or allopurinol (5 mg·kg−1) from the 7th week. (a) Representative H&E, Oil Red O, and Masson's trichrome stained images at 200× magnification. (b) Histological score for hepatic injury using Masson's trichrome staining (n = 10 images from 6 liver sections of three mice per group). (c, d) Serum levels of AST and ALT (n = 8 rats per group). Data shown are means ± SEM. # P < 0.05, significantly different from control group; *P < 0.05, significantly different from fructose vehicle group
3.2. Pterostilbene prevents fructose‐induced hepatocyte EMT in liver fibrosis
Immunofluorescent staining of liver sections showed that the numbers of cells staining positive for α‐SMA and FSP1 were significantly increased, but little colocalization of α‐SMA and FSP1 was observed in fructose‐fed rats (Figure 3a). The results from western blot analysis confirmed the increased protein levels of α‐SMA and FSP1, as well as collagen 1, but the protein levels of E‐cadherin were lower in this animal model (Figure 3b). Pterostilbene and allopurinol significantly reduced liver FSP1 and α‐SMA expression in fructose‐fed rats (Figure 3a). In addition, they down‐regulated FSP1, collagen 1, and α‐SMA protein levels and up‐regulated E‐cadherin protein levels in livers of fructose‐fed rats (Figure 3b).
Figure 3.
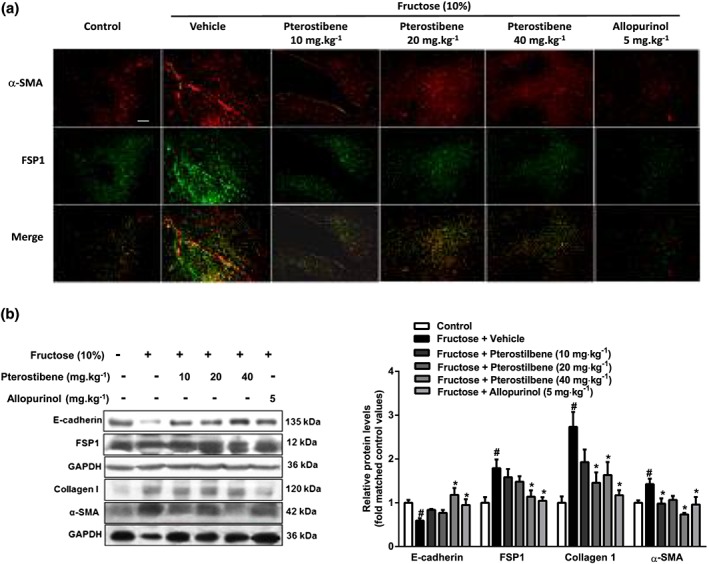
Effects of pterostilbene on hepatocyte EMT in fructose‐induced liver fibrosis. Rats were fed with 10% fructose solution for 16 weeks, and treated with pterostilbene (10, 20, or 40 mg·kg−1) or allopurinol (5 mg·kg−1) from the 7th week. (a) Representative images of immunofluorescence staining for α‐SMA (red) and FSP1 (green) in liver section (scale bar 75 μm). (b) Protein levels of E‐cadherin, FSP1, collagen 1, and α‐SMA in liver tissue. Data shown are means ± SEM from 6 independent experiments. Data for all bar graphs are expressed as fold change in gene or protein band values matched control values. # P < 0.05, significantly different from control group and *P < 0.05, significantly different from fructose vehicle group
Our preliminary experiments had shown that 5 mM fructose caused hepatocyte EMT after 48 and 72 h exposure (Supplemental Figure S‐2a and b). Here, collagen 1 and α‐SMA in BRL‐3A cells were significantly increased after 72hr incubation with 5mM fructose (Figure 4a,b). Moreover, FSP‐1 and vimentin protein levels were increased by incubating with 5 mM fructose; but E‐cadherin protein levels were decreased (Figure 4c–e). Pterostilbene suppressed collagen 1 and α‐SMA, decreased FSP‐1 and vimentin protein levels, and rescued E‐cadherin in fructose‐exposed BRL‐3A cells (Figure 4a–e). Allopurinol showed similar effects on the changes in collagen 1, α‐SMA, FSP‐1, vimentin, and E‐cadherin protein levels in this cell model (Figure 4a–e). Immunofluorescent staining also confirmed that E‐cadherin was markedly decreased, whereas FSP‐1 was significantly increased in BRL‐3A cells after 72 hr‐fructose exposure (Figure 4f), which were reversed by pterostilbene or allopurinol (Figure 4f).
Figure 4.
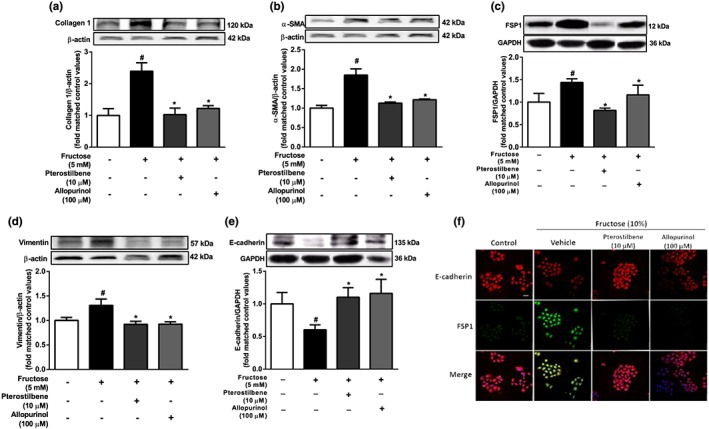
Effects of pterostilbene on hepatocyte EMT induced by fructose in BRL‐3A cells. The cells were cultured without or with 5 mM fructose for 72 hr. (a–e) Protein levels of collagen 1, α‐SMA, FSP1, vimentin, and E‐cadherin after 72 hr‐treatment with different doses of pterostilbene or allopurinol. (f) Representative images of immunofluorescence staining for E‐cadherin (red) and FSP1 (green) after 72 hr‐treatment with 10 μM pterostilbene or 100 μM allopurinol (scale bar 50 μm). Data shown are means ± SEM from 6 independent experiments. Data for all bar graphs are expressed as fold change in gene or protein band values matched control values # P < 0.05, significantly different from control group and *P < 0.05, significantly different from fructose vehicle group
3.3. Fructose induces hepatocyte EMT mediated by the activation of miR‐34a/Sirt1/p53 and TGF‐β1/Smads signalling
To investigate whether fructose induced hepatocyte EMT through the miR‐34a/Sirt1/p53 signalling pathway, we transfected miR‐34a inhibitor, miR‐34a mimic, or p53 siRNA into BRL‐3A cells. As our preliminary study showed that miR‐34a expression was increased after 12hr‐incubation with 5 mM fructose, along with decreased levels of Sirt1 and increased levels of ac‐p53 (Figure S2c‐e), our subsequent experiments used the same conditions. The fructose induced miR‐34a overexpression, decreased Sirt1 and increased ac‐p53 were attenuated following transfection with miR‐34a inhibitor in BRL‐3A cells (Figure 5a,b). Fructose also activated TGF‐β1/Smads signalling in BRL3A cells, as shown by increasing protein levels of TGF‐β1, p‐Smad2, p‐Smad3, and Smad4. These changes were suppressed by transfection with miR‐34a inhibitor (Figure 5c). Transfection of BRL‐3A cells with the miR‐34a mimic also down‐regulated Sirt1, up‐regulated p53 and ac‐p53, and activated TGF‐β1/Smads signalling, but there were no added effects following exposure to fructose (Figure 6a–e). Although p53 siRNA did not affect fructose‐induced changes in miR‐34a and Sirt1 expression, it effectively decreased protein levels of TGF‐β1, p‐Smad2, p‐Smad3, and Smad4, showing block of the TGF‐β1/Smads signalling pathway in fructose‐exposed BRL‐3A cells (Figure 7a–c).
Figure 5.
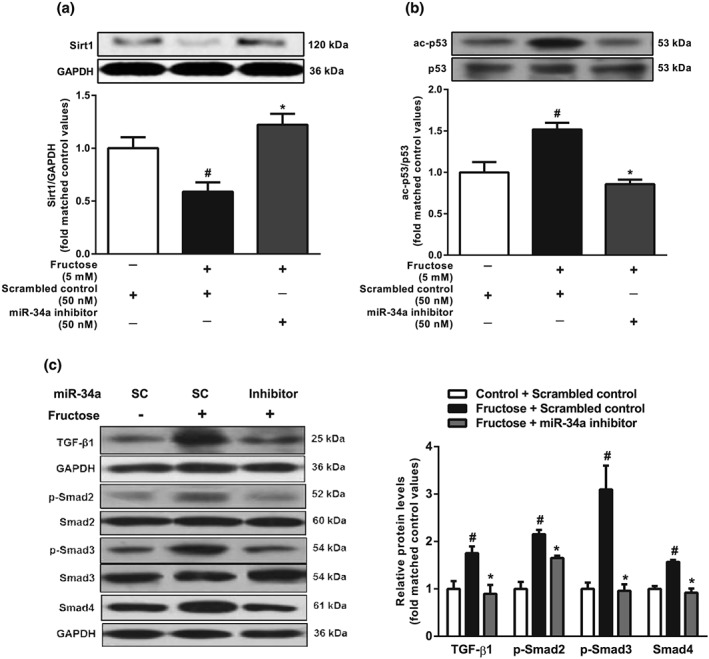
Effects of miR‐34a inhibitor on miR‐34a/Sirt1/p53 and TGF‐β1/Smads signalling in fructose‐exposed hepatocytes. BRL‐3A cells were transfected with scrambled control or miR‐34a inhibitor and then cultured with or without 5 mM fructose for 12 hr. (a, b) Expression levels of Sirt1 and p53/ac‐p53. (c) Protein levels of TGF‐β1, p‐Smad2/Smad2, p‐Smad3/Smad3, and Smad4. Data shown are means ± SEM from 6 independent experiments. Data for all bar graphs are expressed as fold change in gene or protein band values matched control values # P < 0.05, significantly different from scrambled control; *P < 0.05, significantly different from scrambled control with fructose induction
Figure 6.
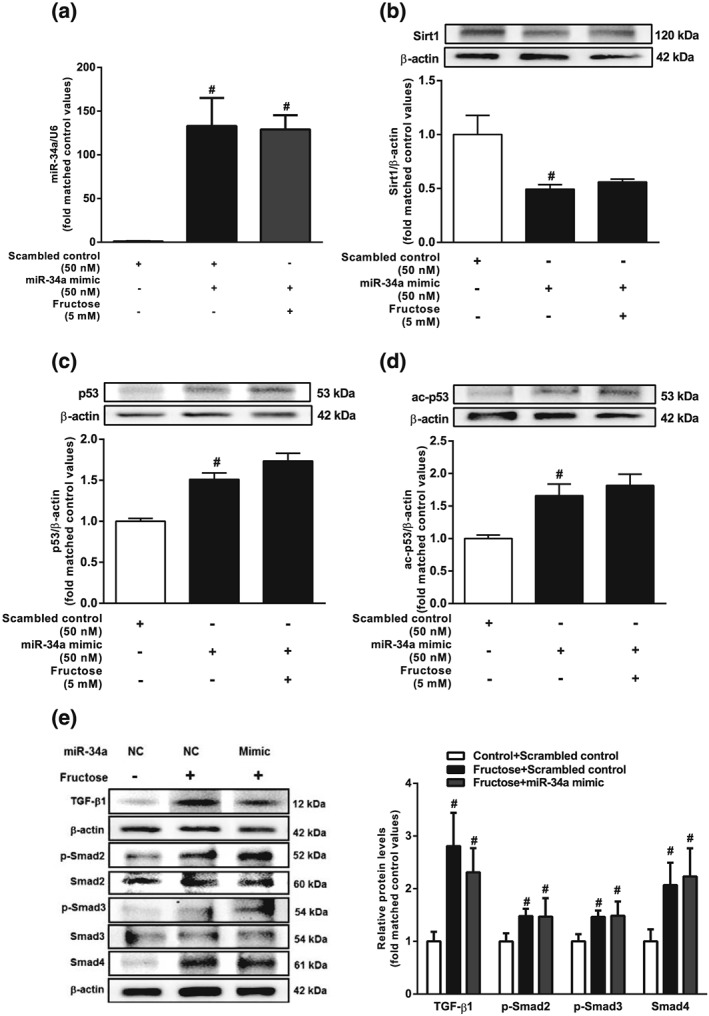
Effects of miR‐34a mimic on miR‐34a/Sirt1/p53 and TGF‐β1/Smads signalling in fructose‐exposed hepatocytes. BRL‐3A cells were transfected with scrambled control or miR‐34a mimic, and then cultured with or without 5 mM fructose for 12 hr. (a–d) Expression levels of miR‐34a, Sirt1, p53, and ac‐p53. (e) Protein levels of TGF‐β1, p‐Smad2/Smad2, p‐Smad3/Smad3, and Smad4. Data shown are means ± SEM from 6 independent experiments. Data for all bar graphs are expressed as fold change in gene or protein band values matched control values # P < 0.05, significantly different from scrambled control; *P < 0.05, significantly different from scrambled control with fructose induction
Figure 7.
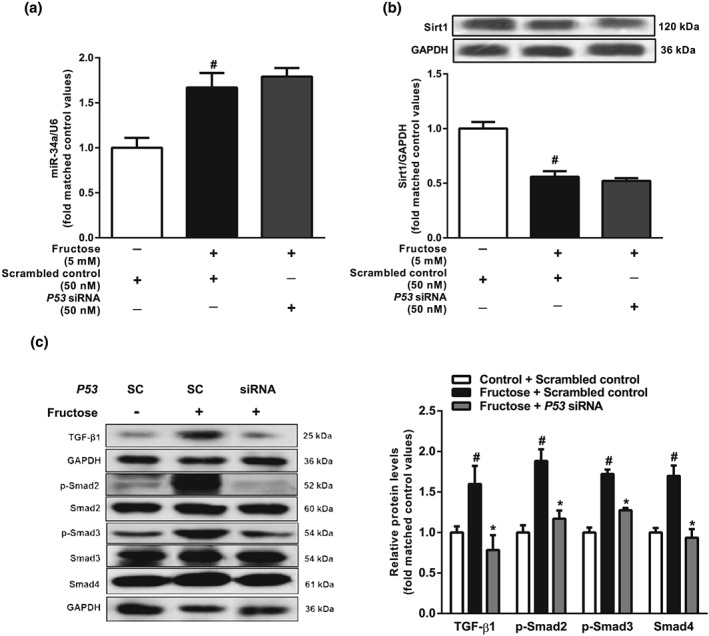
Effects of p53 siRNA on miR‐34a/Sirt1/p53 and TGF‐β1/Smads signalling in fructose‐exposed hepatocytes. BRL‐3A cells were transfected with scrambled control or p53 siRNA and then cultured with or without 5 mM fructose for 12 hr. (a, b) Expression levels of miR‐34a and Sirt1. (c) Protein levels of TGF‐β1, p‐Smad2/Smad2, p‐Smad3/Smad3, and Smad4. Data shown are means ± SEM from 6 independent experiments. Data for all bar graphs are expressed as fold change in gene or protein band values matched control values # P < 0.05, significantly different from scrambled control group; *P < 0.05, significantly different from scrambled control with fructose induction
Moreover, transfection with miR‐34a inhibitor or p53 siRNA significantly prevented fructose‐induced hepatocyte EMT by decreasing FSP‐1 and vimentin protein levels, reversing the loss of E‐cadherin protein (Figure 8a–f) and suppressing collagen 1 and α‐SMA (Figure S4A–D) in BRL‐3A cells.
Figure 8.
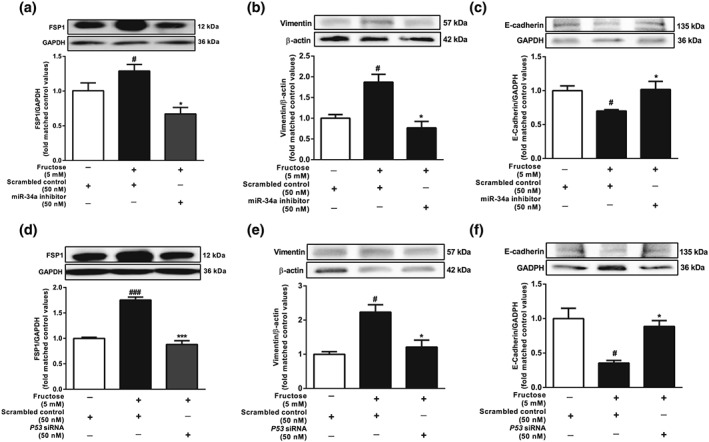
Effects of miR‐34a inhibitor and p53 siRNA on hepatocyte EMT induced by fructose. BRL‐3A cells were transfected with scrambled control, miR‐34a inhibitor, or p53 siRNA and then cultured with or without 5 mM fructose for 72 hr. (a–f) Protein levels of FSP1, vimentin, and E‐cadherin. Data shown are means ± SEM from 6 independent experiments. Data for all bar graphs are expressed as fold change in gene or protein band values matched control values # P < 0.05, significantly different from control group and *P < 0.05, significantly different from fructose vehicle group
3.4. Pterostilbene suppresses TGF‐β1/Smads signalling activation possibly via regulating the miR‐34a/Sirt1/p53 signalling pathway in fructose‐exposed hepatocytes
Preliminary experiments had shown that pterostilbene (10 μM) or allopurinol (100 μM) significantly inhibited hepatocyte EMT induced by fructose (Figure S4A and B). In further work, pterostilbene and allopurinol, used at the same concentrations, down‐regulated miR‐34a expression, up‐regulated Sirt1, and decreased p53 and ac‐p53 in fructose‐exposed BRL‐3A cells (Figure 9a–d). In livers of fructose‐fed rats, miR‐34a expression, p53, and ac‐p53 protein levels were increased, whereas Sirt1 protein levels were decreased, changes reversed by pterostilbene or allopurinol (Figure 9e–h). Pterostilbene and allopurinol also inhibited TGF‐β1/Smads signalling activation by down‐regulating TGF‐β1, p‐Smad2, p‐Smad3, and Smad4 protein levels in fructose‐exposed BRL3A cells and fructose‐fed rat livers (Figure 10a,b).
Figure 9.
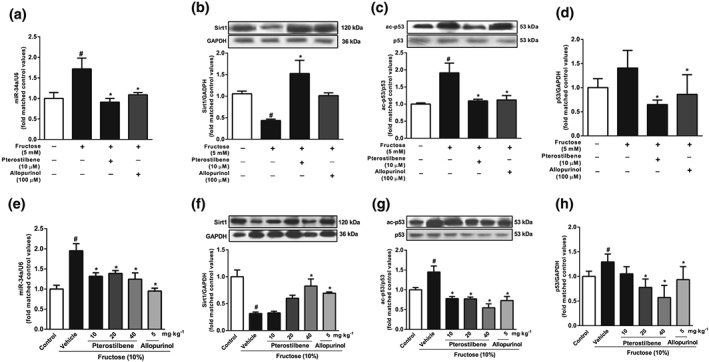
Effects of pterostilbene on miR‐34a/Sirt1/p53 signalling in fructose‐exposed hepatocytes and livers from fructose‐fed rats. BRL‐3A cells were cultured with 5 mM fructose and treated with 10 μM pterostilbene or 100 μM allopurinol. (a–d) Expression levels of miR‐34a, Sirt1, ac‐p53, and p53 in BRL‐3A cells. Bar represents the mean ± SEM (n = 5–6) from three independent experiments. Rats were fed with 10% fructose solution for 16 weeks and treated with pterostilbene (10, 20, or 40 mg·kg−1) or allopurinol (5 mg·kg−1) from the 7th week. (e–h) Expression levels of miR‐34a, Sirt1, ac‐p53, and p53 in rat livers. Data shown are means ± SEM from5 or 6 rats per group. Data for all bar graphs are expressed as fold change in gene or protein band values matched control values # P < 0.05, significantly different from control group and *P < 0.05, significantly different from fructose vehicle group
Figure 10.
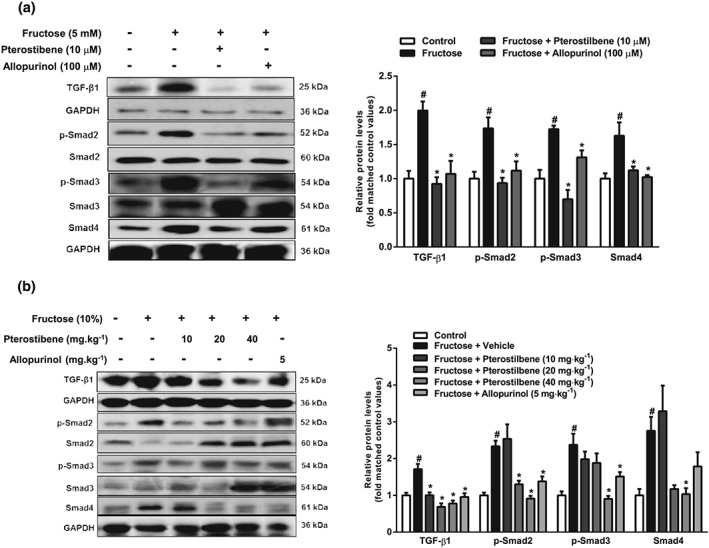
Effects of pterostilbene on TGF‐β1/Smads singling in fructose‐exposed hepatocytes and livers from fructose‐fed rats. BRL‐3A cells were cultured with 5 mM fructose and treated with 10 μM pterostilbene or 100 μM allopurinol. (a) Protein levels of TGF‐β1, p‐Smad2/Smad2, p‐Smad3/Smad3, and Smad4 in BRL‐3A cells. Data shown are means ± SEM from 6 independent experiments. Data for all bar graphs are expressed as fold change in gene or protein band values matched control values # P < 0.05, significantly different from control group and *P < 0.05, significantly different from fructose vehicle group. Rats were fed with 10% fructose solution for 16 weeks and treated with pterostilbene (10, 20, or 40 mg·kg−1) or allopurinol (5 mg·kg−1) from the 7th week. (b) Protein levels of TGF‐β1, p‐Smad2/Smad2, p‐Smad3/Smad3, and Smad4 in rat livers. Data shown are means ± SEM from 5‐6 rats per group. Data for all bar graphs are expressed as fold change in gene or protein band values matched control values # P < 0.05, significantly different from control group and *P < 0.05, significantly different from fructose vehicle group
Of note, pterostilbene and allopurinol produced no further inhibitory effects on TGF‐β1, p‐Smad2, p‐Smad3, and Smad4 protein levels in miR‐34a inhibitor‐transfected BRL3A cells, in which the activated TGF‐β1/Smads signalling pathway induced by fructose had been suppressed (Figure S5A–G).
4. DISCUSSION
In this study, our data on histopathological change, ECM accumulation, and microvesicular steatosis confirmed that fructose induced liver fibrosis in rats, consistent with other reports (Cydylo et al., 2017; Lirio et al., 2016; McCommis et al., 2017). TGF‐β1, a powerful signalling mediator, primarily activates hepatic stellate cells, Kupffer, and peri‐sinusoidal cells, all of which have been implicated in the process of hepatic fibrosis (Williams & Iredale, 2000; Zhou, Zhong, Wang, Miao, & Xu, 2010). Of note, increasing evidence suggests that TGF‐β signalling in hepatocytes also contributed to the progression of liver fibrosis via inducing the EMT (Kaimori et al., 2007; Kojima et al., 2008; Tian et al., 2016; Tu et al., 2014). Hepatocytes isolated from rats with carbon tetrachloride‐induced liver fibrosis show mesenchymal markers (Nitta, Kim, Mohuczy, & Behrns, 2008). Furthermore, TGF‐β1‐driven EMT is accompanied with the up‐regulation of E‐cadherin transcription repressors in both primary murine hepatocytes and cultured murine hepatocyte cells (Kaimori et al., 2007; Kim et al., 2017; Kojima et al., 2008; Zeisberg et al., 2007). In this study, fructose caused hepatocytes to undergo the EMT, and then to lose E‐cadherin, but gain FSP1 and vimentin. In parallel experiments, fructose activated the TGF‐β1/Smads signalling pathway in rat livers and hepatocytes. Taken together, these data provide evidence that, in hepatocytes, EMT as a critical factor may contribute to the progression of fructose‐induced liver fibrosis associated with TGF‐β1 signalling activation. TGF‐β1 expression is regulated by elevated expression of MMPs, contributing to the EMT and promoting invasion and metastasis of hepatocellular carcinoma cell lines (Qin et al., 2016). A fructose‐rich diet is reported to up‐regulate MMP‐9 expression in rat hearts (Bundalo et al., 2015). Thus, fructose‐increased TGF‐β1 expression in hepatocytes might interfere with MMPs by a yet unidentified mechanism in liver fibrosis.
MiR‐34a is transcriptionally regulated by p53 and modulates a wide range of target proteins related to the cell cycle, apoptosis, differentiation, and cellular development (Piegari et al., 2016; Shetty et al., 2017). The activation of miR‐34a/Sirt1/p53 signalling in hepatocytes causes apoptosis and thus activates hepatic stellate cells, which are promoters of liver fibrosis (Tian et al., 2016). More interesting, high fructose also causes Sirt1 down‐regulation in hepatocytes and mouse livers, with hepatic steatosis and fibrosis (Sodhi et al., 2015). Here, our results showed that fructose also induced miR‐34a overexpression in hepatocytes, along with down‐regulated Sirt1, increased p53 and ac‐p53, and activated TGF‐β1/Smads signalling, whereas these disturbances were suppressed by the miR‐34a inhibitor. The miR‐34a mimic down‐regulated Sirt1, up‐regulated total p53 and ac‐p53, and activated TGF‐β1/Smads signalling, but there were no additive effects on fructose induction. Interestingly, p53 siRNA could inhibit fructose‐activated TGF‐β1/Smads signalling, preventing hepatocyte EMT. Collectively, these results strongly support that activated miR‐34a/Sirt1/p53 signalling is required for fructose‐induced hepatocyte EMT, mediated by activation of TGF‐β1/Smads signalling.
A widely used Sirt1 activator, resveratrol, alleviated liver fibrosis in animal models (Chavez et al., 2008; Hong et al., 2010). As noted previously (Lee et al., 2013), pterostilbene alleviated liver fibrosis by reducing hepatic collagen 1 and α‐SMA in fructose‐fed rats. In vitro, pterostilbene restored the reduction of Sirt1 by suppressing overexpression of miR‐34a and activation of p53, contributing to its attenuation of fructose‐induced hepatocyte EMT. It also suppressed the activation of miR‐34a/Sirt1/p53 and TGF‐β1/Smads signalling in fructose‐stimulated hepatocytes and rat livers. However, pterostilbene further suppressed FSP1 expression but showed no additive effect on miR‐34a/Sirt1/p53 signalling in hepatocytes transfected with miR‐34a inhibitor, suggesting that the prevention of hepatocyte EMT was only partly dependent on miR‐34a/Sirt1/p53 signalling. Although the precise mechanism is unclear, the suppression of p53 and TGF‐β1 by pterostilbene is most likely to contribute to the inhibition of miR‐34a, on challenge with fructose. Allopurinol also showed beneficial effects on liver steatosis, inflammation, and fibrosis in fructose‐fed rats by inhibiting miR‐34a/Sirt1/p53 and TGF‐β1/Smads signalling activation, providing more evidence for a new clinical use of this drug.
In summary, we have found that activation of the miR‐34a/Sirt1/p53 signalling pathway was necessary for fructose‐induced hepatocyte EMT driven by TGF‐β1/Smads signalling and contributing to liver fibrosis in rats. Pterostilbene exhibited protective effects against fructose‐induced hepatocyte EMT and liver fibrosis, partly through suppressing miR‐34a/Sirt1/p53 signalling. More importantly, pterostilbene may have greater potential application in clinical use, because its oral bioavailability is higher than that of resveratrol (Kapetanovic, Muzzio, Huang, Thompson, & McCormick, 2011). Further studies are needed to confirm these effects.
COMPETING INTERESTS
The authors declare no conflicts of interest.
CONTRIBUTORS
L.‐D.K., and J.‐M.L. conceived and designed the experiments. L.S., T.‐Y.C., and X.‐J.Z. contributed significantly to the experiments. L.S., L.‐D.K., T.‐Y.C. and J.‐M.L. performed the data analyses. Q.X. and R.‐Q.J. helped perform the analysis with constructive discussions. J.‐M.L., L.‐D.K., and L.S. wrote and edited the manuscript.
DECLARATION OF TRANSPARENCY AND SCIENTIFIC RIGOUR
This Declaration acknowledges that this paper adheres to the principles for transparent reporting and scientific rigour of preclinical research as stated in the BJP guidelines for Design & Analysis, Immunoblotting and Immunochemistry, and Animal Experimentation, and as recommended by funding agencies, publishers and other organisations engaged with supporting research
Supporting information
Figure S1. Time‐course effects of fructose on EMT and miR‐34a/Sirt1/p53 signaling in hepatocytes. BRL‐3A cells were cultured with 5 mM fructose within 72 h. (A, B) Expression levels of FSP1 and E‐cadherin were determined at the indicated time points. (C‐E) Expression levels of miR‐34a, Sirt1 and p53/ac‐p53 were determined at the indicated time points. Bar represents the mean ± S.E.M. (n=5‐6) of three independent experiments. The data are expressed as fold change of protein expression relative to the basal level in control group. Significance # P < 0.05 vs. scrambled control and * P < 0.05 vs. scrambled control with fructose induction.
Figure S2. Effects of pterostilbene on hepatocyte EMT induced by fructose. BRL‐3A cells were cultured with 5 mM fructose for 72 h and treated by different doses of pterostilbene or allopurinol. (A, B) Protein levels of FSP1 and E‐cadherin after 72 h‐treatment. Bar represents the mean ± S.E.M. (n=5‐6) from three independent experiments. The data are expressed as fold change of gene or protein expression relative to the basal level in control group. Significance # P < 0.05 vs. control group and * P < 0.05 vs. fructose vehicle group.
Figure S3. Effects of pterostilbene on fructose‐induced liver lipid accumulation and inflammation in rats. (A, B) Liver contents of TG and TC (n=8). (C‐E) Liver levels of IL‐1β, IL‐6 and TNF‐α (n=6). Bar represents the mean ± S.E.M.. Significance # P < 0.05 vs. control group and * P < 0.05 vs. fructose vehicle group.
Figure S4. Effects of miR‐34a inhibitor and p53 siRNA on collagen 1 and α‐SMA in hepatocytes exposed by fructose. BRL‐3A cells were transfected with scrambled control, miR‐34a inhibitor or p53 siRNA, and then cultured with or without 5 mM fructose for 72 h. (A‐D) Protein levels of collagen 1 and α‐SMA were detected by Western blot. Bar represents the mean ± S.E.M. (n=5‐6) from three independent experiments. The data are expressed as fold change of protein expression relative to the basal level in control group. Significance # P < 0.05 vs. control group and * P < 0.05 vs. fructose vehicle group.
Figure S5. Effects of miR‐34a inhibitor in pterostilbene protection against fructose‐induced hepatocyte EMT. BRL‐3A cells were transfected with scrambled control or miR‐34a inhibitor, and then treated with pterostilbene or allopurinol in the present 5 mM fructose for 12 h or 72 h. (A) Expression levels of FSP1 in BRL‐3A cells. (B‐C) Expression levels of Sirt1, p53 and ac‐p53 in BRL‐3A cells. (D‐G)Expression levels of TGF‐β1, p‐Smad2/Smad2, p‐Smad3/Smad3 and Smad4 in BRL‐3A cells. Bar represents the mean ± S.E.M. (n=5‐6) from three independent experiments. The data are expressed as fold change of protein expression relative to the basal level in control group. Significance # P < 0.05 vs. control group and * P < 0.05 vs. fructose vehicle group.
ACKNOWLEDGEMENTS
This work was supported by National Natural Science Foundation of China (NSFC 81730105), and partly by State Key Laboratory Cultivation Base for TCM Quality and Efficacy.
Song L, Chen T‐Y, Zhao X‐J, et al. Pterostilbene prevents hepatocyte epithelial‐mesenchymal transition in fructose‐induced liver fibrosis through suppressing miR‐34a/Sirt1/p53 and TGF‐β1/Smads signalling. Br J Pharmacol. 2019;176:1619–1634. 10.1111/bph.14573
Contributor Information
Jian‐Mei Li, Email: lijm@nju.edu.cn.
Ling‐Dong Kong, Email: kongld@nju.edu.cn.
REFERENCES
- Aldaba‐Muruato, L. R. , Moreno, M. G. , Shibayama, M. , Tsutsumi, V. , & Muriel, P. (2012). Protective effects of allopurinol against acute liver damage and cirrhosis induced by carbon tetrachloride: Modulation of NF‐κB, cytokine production and oxidative stress. Biochimica et Biophysica Acta, 1820, 65–75. 10.1016/j.bbagen.2011.09.018 [DOI] [PubMed] [Google Scholar]
- Aldaba‐Muruato, L. R. , Moreno, M. G. , Shibayama, M. , Tsutsumi, V. , & Muriel, P. (2013). Allopurinol reverses liver damage induced by chronic carbon tetrachloride treatment by decreasing oxidative stress, TGF‐β production and NF‐κB nuclear translocation. Pharmacology, 92, 138–149. 10.1159/000339078 [DOI] [PubMed] [Google Scholar]
- Alexander, S. P. , Fabbro, D. , Kelly, E. , Marrion, N. V. , Peters, J. A. , Faccenda, E. , … CGTP Collaborators (2017). The Concise Guide to PHARMACOLOGY 2017/18: Enzymes. Br J Pharmacol, 174(Suppl 1), S272–S359. 10.1111/bph.13877 [DOI] [PMC free article] [PubMed] [Google Scholar]
- Bhakkiyalakshmi, E. , Sireesh, D. , Sakthivadivel, M. , Sivasubramanian, S. , Gunasekaran, P. , & Ramkumar, K. M. (2016). Anti‐hyperlipidemic and anti‐peroxidative role of pterostilbene via Nrf2 signaling in experimental diabetes. European Journal of Pharmacology, 777, 9–16. 10.1016/j.ejphar.2016.02.054 [DOI] [PubMed] [Google Scholar]
- Bundalo, M. , Zivkovic, M. , Culafic, T. , Stojiljkovic, M. , Koricanac, G. , & Stankovic, A. (2015). Oestradiol treatment counteracts the effect of fructose‐rich diet on matrix metalloproteinase 9 expression and NFκB activation. Folia Biologica (Praha), 61, 233–240. [PubMed] [Google Scholar]
- Cermelli, S. , Ruggieri, A. , Marrero, J. A. , Ioannou, G. N. , & Beretta, L. (2011). Circulating microRNAs in patients with chronic hepatitis C and non‐alcoholic fatty liver disease. PLoS One, 6, e23937 10.1371/journal.pone.0023937 [DOI] [PMC free article] [PubMed] [Google Scholar]
- Chavez, E. , Reyes‐Gordillo, K. , Segovia, J. , Shibayama, M. , Tsutsumi, V. , Vergara, P. , … Muriel, P. (2008). Resveratrol prevents fibrosis, NF‐κB activation and TGF‐β increases induced by chronic CCl4 treatment in rats. Journal of Applied Toxicology, 28, 35–43. 10.1002/jat.1249 [DOI] [PubMed] [Google Scholar]
- Chevallier, M. , Guerret, S. , Chossegros, P. , Gerard, F. , & Grimaud, J. A. (1994). A histological semiquantitative scoring system for evaluation of hepatic fibrosis in needle liver biopsy specimens: Comparison with morphometric studies. Hepatology, 20, 349–355. 10.1002/hep.1840200213 [DOI] [PubMed] [Google Scholar]
- Chiou, Y. S. , Tsai, M. L. , Wang, Y. J. , Cheng, A. C. , Lai, W. M. , Badmaev, V. , … Pan, M. H. (2010). Pterostilbene inhibits colorectal aberrant crypt foci (ACF) and colon carcinogenesis via suppression of multiple signal transduction pathways in azoxymethane‐treated mice. Journal of Agricultural and Food Chemistry, 58, 8833–8841. 10.1021/jf101571z [DOI] [PubMed] [Google Scholar]
- Cui, H. , Ge, J. , Xie, N. , Banerjee, S. , Zhou, Y. , Antony, V. B. , … Liu, G. (2017a). miR‐34a inhibits lung fibrosis by inducing lung fibroblast senescence. American Journal of Respiratory Cell and Molecular Biology, 56, 168–178. 10.1165/rcmb.2016-0163OC [DOI] [PMC free article] [PubMed] [Google Scholar]
- Cui, H. , Ge, J. , Xie, N. , Banerjee, S. , Zhou, Y. , Liu, R. M. , … Liu, G. (2017b). miR‐34a promotes fibrosis in aged lungs by inducing alveolarepithelial dysfunctions. American Journal of Physiology. Lung Cellular and Molecular Physiology, 312, L415–L424. 10.1152/ajplung.00335.2016 [DOI] [PMC free article] [PubMed] [Google Scholar]
- Curtis, M. J. , Bond, R. A. , Spina, D. , Ahluwalia, A. , Alexander, S. P. , Giembycz, M. A. , … McGrath, J. C. (2015). Experimental design and analysis and their reporting: New guidance for publication in BJP. British Journal of Pharmacology, 172, 3461–3471. 10.1111/bph.12856 [DOI] [PMC free article] [PubMed] [Google Scholar]
- Cydylo, M. A. , Davis, A. T. , & Kavanagh, K. (2017). Fatty liver promotes fibrosis in monkeys consuming high fructose. Obesity (Silver Spring), 25, 290–293. 10.1002/oby.21720 [DOI] [PMC free article] [PubMed] [Google Scholar]
- Du, R. , Sun, W. , Xia, L. , Zhao, A. , Yu, Y. , Zhao, L. , … Sun, S. (2012). Hypoxia‐induced down‐regulation of microRNA‐34a promotes EMT by targeting the Notch signaling pathway in tubular epithelial cells. PLoS One, 7, e30771 10.1371/journal.pone.0030771 [DOI] [PMC free article] [PubMed] [Google Scholar]
- Gomez‐Zorita, S. , Fernandez‐Quintela, A. , Lasa, A. , Aguirre, L. , Rimando, A. M. , & Portillo, M. P. (2014). Pterostilbene, a dimethyl ether derivative of resveratrol, reduces fat accumulation in rats fed an obesogenic diet. Journal of Agricultural and Food Chemistry, 62, 8371–8378. [DOI] [PubMed] [Google Scholar]
- Harding, S. D. , Sharman, J. L. , Faccenda, E. , Southan, C. , Pawson, A. J. , Ireland, S. , … NC‐IUPHAR (2018). The IUPHAR/BPS guide to pharmacology in 2018: Updates and expansion to encompass the new guide to immunopharmacology. Nucleic Acids Research, 46, D1091–D1106. 10.1093/nar/gkx1121 [DOI] [PMC free article] [PubMed] [Google Scholar]
- Hong, S. W. , Jung, K. H. , Zheng, H. M. , Lee, H. S. , Suh, J. K. , Park, I. S. , … Hong, S. S. (2010). The protective effect of resveratrol on dimethylnitrosamine‐induced liver fibrosis in rats. Archives of Pharmacal Research, 33, 601–609. 10.1007/s12272-010-0415-y [DOI] [PubMed] [Google Scholar]
- Huang, Y. , Qi, Y. , Du, J. Q. , & Zhang, D. F. (2014). MicroRNA‐34a regulates cardiac fibrosis after myocardial infarction by targeting Smad4. Expert Opinion on Therapeutic Targets, 18, 1355–1365. 10.1517/14728222.2014.961424 [DOI] [PubMed] [Google Scholar]
- Kaimori, A. , Potter, J. , Kaimori, J. Y. , Wang, C. , Mezey, E. , & Koteish, A. (2007). Transforming growth factor‐β1 induces an epithelial‐to‐mesenchymal transition state in mouse hepatocytes in vitro. The Journal of Biological Chemistry, 282, 22089–22101. 10.1074/jbc.M700998200 [DOI] [PubMed] [Google Scholar]
- Kapetanovic, I. M. , Muzzio, M. , Huang, Z. , Thompson, T. N. , & McCormick, D. L. (2011). Pharmacokinetics, oral bioavailability, and metabolic profile of resveratrol and its dimethylether analog, pterostilbene, in rats. Cancer Chemotherapy and Pharmacology, 68, 593–601. 10.1007/s00280-010-1525-4 [DOI] [PMC free article] [PubMed] [Google Scholar]
- Kilkenny, C. , Browne, W. , Cuthill, I. C. , Emerson, M. , & Altman, D. G. (2010). Animal research: Reporting in vivo experiments: The ARRIVE guidelines. British Journal of Pharmacology, 160, 1577–1579. [DOI] [PMC free article] [PubMed] [Google Scholar]
- Kim, S. M. , Choi, J. E. , Hur, W. , Kim, J. H. , Hong, S. W. , Lee, E. B. , … Yoon, S. K. (2017). RAR‐related orphan receptor γ (ROR‐γ) mediates epithelial‐mesenchymal transition of hepatocytes during hepatic fibrosis. Journal of Cellular Biochemistry, 118, 2026–2036. 10.1002/jcb.25776 [DOI] [PMC free article] [PubMed] [Google Scholar]
- Kojima, T. , Takano, K. , Yamamoto, T. , Murata, M. , Son, S. , Imamura, M. , … Sawada, N. (2008). Transforming growth factor‐beta induces epithelial to mesenchymal transition by down‐regulation of claudin‐1 expression and the fence function in adult rat hepatocytes. Liver International, 28, 534–545. 10.1111/j.1478-3231.2007.01631.x [DOI] [PubMed] [Google Scholar]
- Kong, D. , Zhang, F. , Shao, J. , Wu, L. , Zhang, X. , Chen, L. , … Zheng, S. (2015). Curcumin inhibits cobalt chloride‐induced epithelial‐to‐mesenchymal transition associated with interference with TGF‐β/Smad signaling in hepatocytes. Laboratory Investigation, 95, 1234–1245. 10.1038/labinvest.2015.107 [DOI] [PubMed] [Google Scholar]
- Lee, M. F. , Liu, M. L. , Cheng, A. C. , Tsai, M. L. , Ho, C. T. , Liou, W. S. , & Pan, M. H. (2013). Pterostilbene inhibits dimethylnitrosamine‐induced liver fibrosis in rats. Food Chemistry, 138, 802–807. 10.1016/j.foodchem.2012.11.094 [DOI] [PubMed] [Google Scholar]
- Li, J. M. , Li, Y. C. , Kong, L. D. , & Hu, Q. H. (2010). Curcumin inhibits hepatic protein‐tyrosine phosphatase 1B and prevents hypertriglyceridemia and hepatic steatosis in fructose‐fed rats. Hepatology, 51, 1555–1566. 10.1002/hep.23524 [DOI] [PubMed] [Google Scholar]
- Lirio, L. M. , Forechi, L. , Zanardo, T. C. , Batista, H. M. , Meira, E. F. , Nogueira, B. V. , … Baldo, M. P. (2016). Chronic fructose intake accelerates non‐alcoholic fatty liver disease in the presence of essential hypertension. Journal of Diabetes and its Complications, 30, 85–92. 10.1016/j.jdiacomp.2015.10.008 [DOI] [PubMed] [Google Scholar]
- Liu, X. , Yang, X. , Han, L. , Ye, F. , Liu, M. , Fan, W. , … Lin, S. (2017). Pterostilbene alleviates polymicrobial sepsis‐induced liver injury: Possible role of SIRT1 signaling. International Immunopharmacology, 49, 50–59. 10.1016/j.intimp.2017.05.022 [DOI] [PubMed] [Google Scholar]
- Lou, G. , Liu, Y. , Wu, S. , Xue, J. , Yang, F. , Fu, H. , … Chen, Z. (2015). The p53/miR‐34a/SIRT1 positive feedback loop in quercetin‐induced apoptosis. Cellular Physiology and Biochemistry, 35, 2192–2202. 10.1159/000374024 [DOI] [PubMed] [Google Scholar]
- McCommis, K. S. , Hodges, W. T. , Brunt, E. M. , Nalbantoglu, I. , McDonald, W. G. , Holley, C. , … Finck, B. N. (2017). Targeting the mitochondrial pyruvate carrier attenuates fibrosis in a mouse model of nonalcoholic steatohepatitis. Hepatology, 65, 1543–1556. 10.1002/hep.29025 [DOI] [PMC free article] [PubMed] [Google Scholar]
- McGrath, J. C. , & Lilley, E. (2015). Implementing guidelines on reporting research using animals (ARRIVE etc.): New requirements for publication in BJP. British Journal of Pharmacology, 172, 3189–3193. [DOI] [PMC free article] [PubMed] [Google Scholar]
- Mule, G. , Calcaterra, I. , Nardi, E. , Cerasola, G. , & Cottone, S. (2014). Metabolic syndrome in hypertensive patients: An unholy alliance. World Journal of Cardiology, 6, 890–907. 10.4330/wjc.v6.i9.890 [DOI] [PMC free article] [PubMed] [Google Scholar]
- Nitta, T. , Kim, J. S. , Mohuczy, D. , & Behrns, K. E. (2008). Murine cirrhosis induces hepatocyte epithelial mesenchymal transition and alterations in survival signaling pathways. Hepatology, 48, 909–919. 10.1002/hep.22397 [DOI] [PMC free article] [PubMed] [Google Scholar]
- Piccolo, S. (2008). p53 regulation orchestrates the TGF‐β response. Cell, 133, 767–769. 10.1016/j.cell.2008.05.013 [DOI] [PubMed] [Google Scholar]
- Piegari, E. , Russo, R. , Cappetta, D. , Esposito, G. , Urbanek, K. , Dell'Aversana, C. , … de Angelis, A. (2016). MicroRNA‐34a regulates doxorubicin‐induced cardiotoxicity in rat. Oncotarget, 7, 62312–62326. 10.18632/oncotarget.11468 [DOI] [PMC free article] [PubMed] [Google Scholar]
- Qin, G. , Luo, M. , Chen, J. , Dang, Y. , Chen, G. , Li, L. , … Yang, J. (2016). Reciprocal activation between MMP‐8 and TGF‐β1 stimulates EMT and malignant progression of hepatocellular carcinoma. Cancer Letters, 374, 85–95. 10.1016/j.canlet.2016.02.001 [DOI] [PubMed] [Google Scholar]
- Rimando, A. M. , Nagmani, R. , Feller, D. R. , & Yokoyama, W. (2005). Pterostilbene, a new agonist for the peroxisome proliferator‐activated receptor α‐isoform, lowers plasma lipoproteins and cholesterol in hypercholesterolemic hamsters. Journal of Agricultural and Food Chemistry, 53, 3403–3407. 10.1021/jf0580364 [DOI] [PubMed] [Google Scholar]
- Rowe, R. G. , Lin, Y. , Shimizu‐Hirota, R. , Hanada, S. , Neilson, E. G. , Greenson, J. K. , & Weiss, S. J. (2011). Hepatocyte‐derived Snail1 propagates liver fibrosis progression. Molecular and Cellular Biology, 31, 2392–2403. 10.1128/MCB.01218-10 [DOI] [PMC free article] [PubMed] [Google Scholar]
- Salvoza, N. C. , Klinzing, D. C. , Gopez‐Cervantes, J. , & Baclig, M. O. (2016). Association of circulating serum miR‐34a and miR‐122 with dyslipidemia among patients with non‐alcoholic fatty liver disease. PLoS One, 11, e0153497 10.1371/journal.pone.0153497 [DOI] [PMC free article] [PubMed] [Google Scholar]
- Shetty, S. K. , Tiwari, N. , Marudamuthu, A. S. , Puthusseri, B. , Bhandary, Y. P. , Fu, J. , … Shetty, S. (2017). p53 and miR‐34a feedback promotes lung epithelial injury and pulmonary fibrosis. The American Journal of Pathology, 187, 1016–1034. 10.1016/j.ajpath.2016.12.020 [DOI] [PMC free article] [PubMed] [Google Scholar]
- Sodhi, K. , Puri, N. , Favero, G. , Stevens, S. , Meadows, C. , Abraham, N. G. , … Shapiro, J. I. (2015). Fructose mediated non‐alcoholic fatty liver is attenuated by HO‐1‐SIRT1 module in murine hepatocytes and mice fed a high fructose diet. PLoS One, 10, e0128648 10.1371/journal.pone.0128648 [DOI] [PMC free article] [PubMed] [Google Scholar] [Retracted]
- Takano, M. , Nekomoto, C. , Kawami, M. , & Yumoto, R. (2017). Role of miR‐34a in TGF‐β1‐ and drug‐induced epithelial‐mesenchymal transition in alveolar type II epithelial cells. Journal of Pharmaceutical Sciences, 106, 2868–2872. 10.1016/j.xphs.2017.04.002 [DOI] [PubMed] [Google Scholar]
- Termen, S. , Tan, E. J. , Heldin, C. H. , & Moustakas, A. (2013). p53 regulates epithelial‐mesenchymal transition induced by transforming growth factor β. Journal of Cellular Physiology, 228, 801–813. 10.1002/jcp.24229 [DOI] [PubMed] [Google Scholar]
- Tian, X. F. , Ji, F. J. , Zang, H. L. , & Cao, H. (2016). Activation of the miR‐34a/SIRT1/p53 signaling pathway contributes to the progress of liver fibrosis via inducing apoptosis in hepatocytes but not in HSCs. PLoS One, 11, e0158657 10.1371/journal.pone.0158657 [DOI] [PMC free article] [PubMed] [Google Scholar]
- Tu, X. , Zhang, H. , Zhang, J. , Zhao, S. , Zheng, X. , Zhang, Z. , … Zhang, J. (2014). MicroRNA‐101 suppresses liver fibrosis by targeting the TGFβ signalling pathway. The Journal of Pathology, 234, 46–59. 10.1002/path.4373 [DOI] [PubMed] [Google Scholar]
- Wang, W. , Ding, X. Q. , Gu, T. T. , Song, L. , Li, J. M. , Xue, Q. C. , & Kong, L. D. (2015). Pterostilbene and allopurinol reduce fructose‐induced podocyte oxidative stress and inflammation via microRNA‐377. Free Radical Biology & Medicine, 83, 214–226. 10.1016/j.freeradbiomed.2015.02.029 [DOI] [PubMed] [Google Scholar]
- Williams, E. , & Iredale, J. (2000). Hepatic regeneration and TGF‐β: Growing to a prosperous perfection. Gut, 46, 593–594. 10.1136/gut.46.5.593 [DOI] [PMC free article] [PubMed] [Google Scholar]
- Xiong, H. , Pang, J. , Yang, H. , Dai, M. , Liu, Y. , Ou, Y. , … Zheng, Y. (2015). Activation of miR‐34a/SIRT1/p53 signaling contributes to cochlear hair cell apoptosis: Implications for age‐related hearing loss. Neurobiology of Aging, 36, 1692–1701. 10.1016/j.neurobiolaging.2014.12.034 [DOI] [PubMed] [Google Scholar]
- Ye, Z. , Fang, J. , Dai, S. , Wang, Y. , Fu, Z. , Feng, W. , … Huang, P. (2016). MicroRNA‐34a induces a senescence‐like change via the down‐regulation of SIRT1 and up‐regulation of p53 protein in human esophageal squamous cancer cells with a wild‐type p53 gene background. Cancer Letters, 370, 216–221. 10.1016/j.canlet.2015.10.023 [DOI] [PubMed] [Google Scholar]
- Zeisberg, M. , Yang, C. , Martino, M. , Duncan, M. B. , Rieder, F. , Tanjore, H. , & Kalluri, R. (2007). Fibroblasts derive from hepatocytes in liver fibrosis via epithelial to mesenchymal transition. The Journal of Biological Chemistry, 282, 23337–23347. 10.1074/jbc.M700194200 [DOI] [PubMed] [Google Scholar]
- Zhang, L. L. , Huang, S. , Ma, X. X. , Zhang, W. Y. , Wang, D. , Jin, S. Y. , … Li, X. (2016). Angiotensin(1‐7) attenuated angiotensin II‐induced hepatocyte EMT by inhibiting NOX‐derived H2O2‐activated NLRP3 inflammasome/IL‐1β/Smad circuit. Free Radical Biology & Medicine, 97, 531–543. 10.1016/j.freeradbiomed.2016.07.014 [DOI] [PubMed] [Google Scholar]
- Zhao, X. J. , Yang, Y. Z. , Zheng, Y. J. , Wang, S. C. , Gu, H. M. , Pan, Y. , … Kong, L. D. (2017). Magnesium isoglycyrrhizinate blocks fructose‐induced hepatic NF‐κB/NLRP3 inflammasome activation and lipid metabolism disorder. European Journal of Pharmacology, 809, 141–150. 10.1016/j.ejphar.2017.05.032 [DOI] [PubMed] [Google Scholar]
- Zhou, J. , Zhong, D. W. , Wang, Q. W. , Miao, X. Y. , & Xu, X. D. (2010). Paclitaxel ameliorates fibrosis in hepatic stellate cells via inhibition of TGF‐β/Smad activity. World Journal of Gastroenterology, 16, 3330–3334. 10.3748/wjg.v16.i26.3330 [DOI] [PMC free article] [PubMed] [Google Scholar]
Associated Data
This section collects any data citations, data availability statements, or supplementary materials included in this article.
Supplementary Materials
Figure S1. Time‐course effects of fructose on EMT and miR‐34a/Sirt1/p53 signaling in hepatocytes. BRL‐3A cells were cultured with 5 mM fructose within 72 h. (A, B) Expression levels of FSP1 and E‐cadherin were determined at the indicated time points. (C‐E) Expression levels of miR‐34a, Sirt1 and p53/ac‐p53 were determined at the indicated time points. Bar represents the mean ± S.E.M. (n=5‐6) of three independent experiments. The data are expressed as fold change of protein expression relative to the basal level in control group. Significance # P < 0.05 vs. scrambled control and * P < 0.05 vs. scrambled control with fructose induction.
Figure S2. Effects of pterostilbene on hepatocyte EMT induced by fructose. BRL‐3A cells were cultured with 5 mM fructose for 72 h and treated by different doses of pterostilbene or allopurinol. (A, B) Protein levels of FSP1 and E‐cadherin after 72 h‐treatment. Bar represents the mean ± S.E.M. (n=5‐6) from three independent experiments. The data are expressed as fold change of gene or protein expression relative to the basal level in control group. Significance # P < 0.05 vs. control group and * P < 0.05 vs. fructose vehicle group.
Figure S3. Effects of pterostilbene on fructose‐induced liver lipid accumulation and inflammation in rats. (A, B) Liver contents of TG and TC (n=8). (C‐E) Liver levels of IL‐1β, IL‐6 and TNF‐α (n=6). Bar represents the mean ± S.E.M.. Significance # P < 0.05 vs. control group and * P < 0.05 vs. fructose vehicle group.
Figure S4. Effects of miR‐34a inhibitor and p53 siRNA on collagen 1 and α‐SMA in hepatocytes exposed by fructose. BRL‐3A cells were transfected with scrambled control, miR‐34a inhibitor or p53 siRNA, and then cultured with or without 5 mM fructose for 72 h. (A‐D) Protein levels of collagen 1 and α‐SMA were detected by Western blot. Bar represents the mean ± S.E.M. (n=5‐6) from three independent experiments. The data are expressed as fold change of protein expression relative to the basal level in control group. Significance # P < 0.05 vs. control group and * P < 0.05 vs. fructose vehicle group.
Figure S5. Effects of miR‐34a inhibitor in pterostilbene protection against fructose‐induced hepatocyte EMT. BRL‐3A cells were transfected with scrambled control or miR‐34a inhibitor, and then treated with pterostilbene or allopurinol in the present 5 mM fructose for 12 h or 72 h. (A) Expression levels of FSP1 in BRL‐3A cells. (B‐C) Expression levels of Sirt1, p53 and ac‐p53 in BRL‐3A cells. (D‐G)Expression levels of TGF‐β1, p‐Smad2/Smad2, p‐Smad3/Smad3 and Smad4 in BRL‐3A cells. Bar represents the mean ± S.E.M. (n=5‐6) from three independent experiments. The data are expressed as fold change of protein expression relative to the basal level in control group. Significance # P < 0.05 vs. control group and * P < 0.05 vs. fructose vehicle group.


