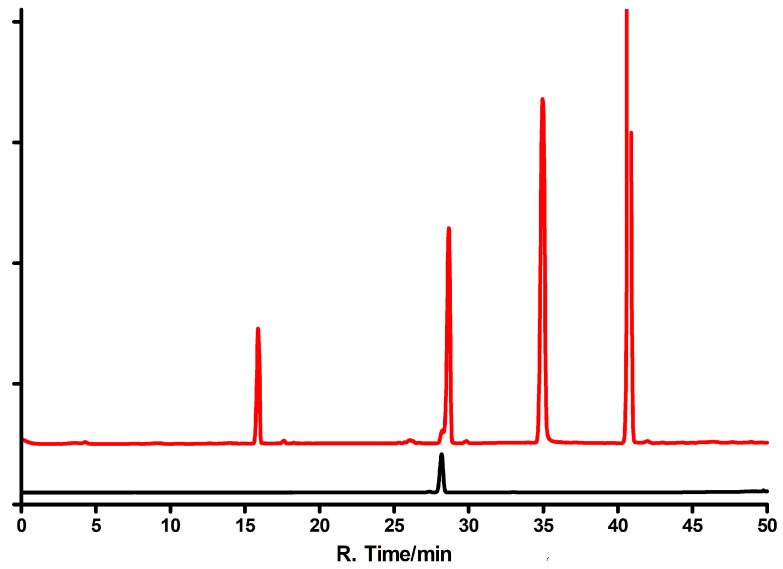
Figure 11.
HPLC elution profiles of the reaction mixtures resulting from enzymatic syntheses of the ribosides of 1,N6-ethenoisogusanine (4). Upper curve: The reaction catalyzed by the E. coli PNP; lower curve: The reaction catalyzed by calf PNP. The peak with the retention time of 15 min is isoguanine; 28 min indicates either N9-riboside (5, upper curve) or N6-riboside (7, lower curve); ~35 min indicates substrate (4), and ~44 min is the N7 riboside (6). Elution program: 0–15 min water, 15–45 min methanol gradient 10–30%.

