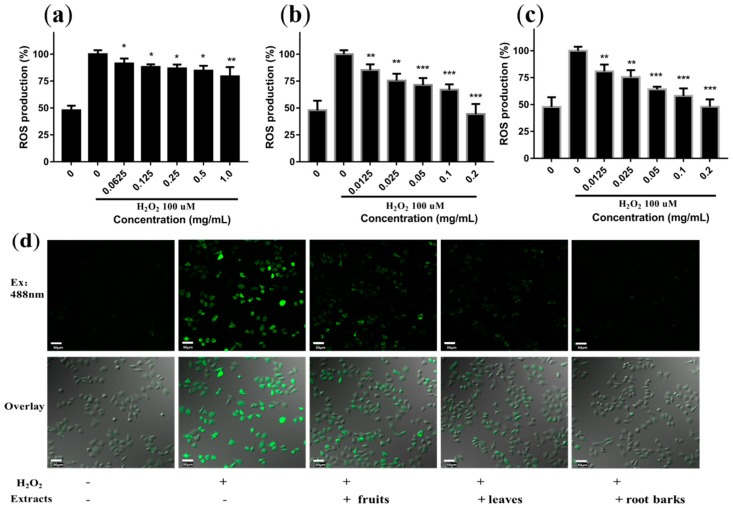
Figure 4.
Protection effect of different concentrations of extracts from fruits (a), leaves (b) and root barks (c) on 100 µM H2O2-induced intracellular ROS production in L02 cells. Results were expressed as means ± SD, n = 3. * p < 0.05, ** p < 0.01, *** p < 0.001, vs. the H2O2 treated group. (d) Confocal imaging of intracellular ROS levels after H2O2 stimulation in the presence of extracts of fruits (1 mg/mL), leaves and root barks (0.2 mg/mL) (scale bar, 50 μm).

