

Abstract
Purpose
To identify the role of radiomics texture features both within and outside the nodule in predicting (a) time to progression (TTP) and overall survival (OS) as well as (b) response to chemotherapy in patients with non–small cell lung cancer (NSCLC).
Materials and Methods
Data in a total of 125 patients who had been treated with pemetrexed-based platinum doublet chemotherapy at Cleveland Clinic were retrospectively analyzed. The patients were divided randomly into two sets with the constraint that there were an equal number of responders and nonresponders in the training set. The training set comprised 53 patients with NSCLC, and the validation set comprised 72 patients. A machine learning classifier trained with radiomic texture features extracted from intra- and peritumoral regions of non–contrast-enhanced CT images was used to predict response to chemotherapy. The radiomic risk-score signature was generated by using least absolute shrinkage and selection operator with the Cox regression model; association of the radiomic signature with TTP and OS was also evaluated.
Results
A combination of radiomic features in conjunction with a quadratic discriminant analysis classifier yielded a mean maximum area under the receiver operating characteristic curve (AUC) of 0.82 ± 0.09 (standard deviation) in the training set and a corresponding AUC of 0.77 in the independent testing set. The radiomics signature was also significantly associated with TTP (hazard ratio [HR], 2.8; 95% confidence interval [CI]: 1.95, 4.00; P < .0001) and OS (HR, 2.35; 95% CI: 1.41, 3.94; P = .0011). Additionally, decision curve analysis demonstrated that in terms of clinical usefulness, the radiomics signature had a higher overall net benefit in prediction of high-risk patients to receive treatment than the clinicopathologic measurements.
Conclusion
This study suggests that radiomic texture features extracted from within and around the nodule on baseline CT scans are (a) predictive of response to chemotherapy and (b) associated with TTP and OS for patients with NSCLC.
© RSNA, 2019
Summary
Quantitative imaging features from a baseline non–contrast-enhanced CT study derived from within the tumor and its associated tumor microenvironment were shown to be able to distinguish patients with non–small cell lung cancer who did from those who did not respond to pemetrexed-based chemotherapy.
Key Points
■ Radiomic features extracted from baseline CT images in patients with non–small cell lung cancer can predict response to pemetrexed chemotherapy noninvasively.
■ Peritumoral texture features may reflect the microenvironment of tumor classes.
Introduction
Platinum-based chemotherapy is the standard of care for first-line treatment of advanced-stage non–small cell lung cancer (NSCLC) in patients with no actionable mutations. However, objective response rate to this therapeutic regimen as initial treatment is only around 24%–31% (1–4). Previous studies have explored the role of biomarkers in predicting response to platinum-based chemotherapy regimens, but the results have been inconclusive. Friboulet et al (5) studied the excision repair cross-complementation group 1 (ERCC1) protein as a biomarker for predicting response to platinum-based chemotherapy. However, the study could not validate ERCC1 as a biomarker in predicting response to lung cancer chemotherapy. Similarly, the role of thymidylate synthase (TMYS) expression was evaluated and found to be correlated with poor response to pemetrexed-based chemotherapy regimens (6). However, the predictive power of TMYS still needs to be validated in prospective studies. Consequently, currently no clinically validated biomarkers exist to identify patients with NSCLC who would most benefit from platinum doublet chemotherapy regimens.
CT studies represent a routinely used clinical diagnostic tool for tumor staging and monitoring treatment response. Radiomic textural analysis is the high-throughput extraction of quantitative imaging data and has been variously studied in its role to predict response to chemotherapy in patients with breast cancer and patients with NSCLC (7–12).
Recently, there has been an increasing interest in radiomic interrogation of the peritumoral region—the area immediately surrounding the tumor mass—the rationale being that the tumor microenvironment and habitat might harbor valuable disease-specific prognostic cues. A study by Zhang et al (13) showed that peritumoral lymphatic microvessel density was correlated with poor prognosis in NSCLC. Another study by Parra et al (14) revealed that NSCLC histologic specimens had higher numbers of tumor-associated inflammatory cells (TAICs) in the peritumoral compartment than in the intratumoral region, while a higher number of TAICs was associated with improved recurrence-free survival. Another recent investigation by Braman et al (15) showed that peritumoral radiomic features extracted from baseline MRI studies in patients with breast cancer were predictive of pathologic complete response to neoadjuvant chemotherapy.
These findings, alongside the biologic evidence of the peritumoral region, brings up the question of whether the interrogation of the peri- and intratumoral compartments of the tumor could help identify which patients with metastatic NSCLC are likely to respond to platinum-based chemotherapy. In this study, we sought to evaluate whether radiomic features pertaining to peritumoral and intratumoral texture and the shape of the nodule on pretreatment CT images were predictive of response to platinum doublet chemotherapy.
Materials and Methods
Patient Selection
This Health Insurance Portability and Accountability Act–compliant study protocol was approved by the Cleveland Clinic Institutional Review Board (IRB), and the requirement to obtain written informed consent was waived. Imaging examinations were subsequently performed according to an IRB-approved protocol (IRB #14-562). A total of 243 patients with lung adenocarcinoma (TNM stage IIIb or IV) who were treated with front-line platinum-based chemotherapy between January 1, 1998, and December 21, 2010, were retrospectively identified. Of these 243 patients, 53 were excluded either because their corresponding CT images (obtained < 30 days before initiation of chemotherapy) could not be located or did not show evaluable thoracic lesions. A further 65 patients in whom response data after four cycles of chemotherapy were not available or who did not meet the inclusion criteria for clinical responders or nonresponders were excluded as well. Figure 1 shows patient selection and the overall experimental design of our study. For this study, clinical responders were defined as patients who experienced objective response (partial response or complete response) according to Response Evaluation Criteria in Solid Tumors (RECIST) 1 or patients who had stable disease for more than 12 cycles of chemotherapy. Patients who did not receive chemotherapy for more than four cycles because of progression of disease were classified as nonresponders. The entire cohort of 125 patients was divided into a training set, comprising 53 patients (26 responders and 27 nonresponders) and a validation set, comprising 72 patients (38 responders and 34 nonresponders).
Figure 1:

Flowchart shows strategy for patient selection and overall experimental design for this study.
Clinical End Points
The primary end point of our study was primary response, defined according to RECIST. The secondary end point was time to progression (TTP). TTP was defined as the date of the start of treatment until the detection of progressive disease or death, whichever occurred earlier, and was censored at the date of last follow-up for those alive without progression. Overall survival (OS) was analyzed as a tertiary end point and was measured from the date of diagnosis to the date of death and was censored at the date of last follow-up for survivors.
Clinical Variables
Eastern Cooperative Oncology Group performance status and TNM stage according to the American Joint Committee on Cancer staging system were used in this study. Clinical staging (eg, stage I, II, III [A or B], and IV) according to the Union for International Cancer Control 7th classification and tumor histologic typing (adenocarcinoma or squamous cell carcinoma) were performed.
CT Segmentation
The index lesion was independently annotated by three board-certified attending radiologists (K.B., R.T., and P.R.) with 10, 21, and 28 years of experience, respectively, in cardiothoracic imaging. The readers were blinded to the true histopathologic diagnosis of the tumor as well as to the associated outcome. The peritumoral compartment around the nodule was defined by means of quantitative morphologic operations (dilation) as a region extending radially from the nodule boundary up to roughly 15 mm. The choice of peritumoral compartment size was determined on the basis of the findings in the study of Mohiuddin et al (16), in which a resection margin for lung nodules of more than 15 mm was found not to confer additional benefit in terms of disease recurrence.
Radiomic Feature Extraction and Feature Reduction
For all the two-dimensional sections (annotated by a radiologist [R.T.] with 21 years of experience) that included the volume of the nodule, features were extracted on a section-by-section basis. The first-order statistics of each of the features were then computed over all the pixels and sections containing the nodule. All features were extracted from within the intra- and peritumoral compartments of the tumor (17). A detailed summary description of the radiomic features is given in Table E1 (supplement).
To construct generalizable classifiers, we needed to identify features that were predictive, stable, and reproducible. To do this, we evaluated features in the context of the test-retest Reference Image Database to Evaluate Response, or RIDER, lung CT dataset (18). For each radiomic feature, the intraclass correlation coefficient (ICC) was calculated to quantify reproducibility between the test-retest scans. In this study, on the basis of previous reports (11), we considered an ICC of 0.8 or greater as the threshold for a feature being reproducible. Among all features identified as being reproducible, those that were identified as unstable between contoured lesions by the three radiologists (K.B., R.T., and P.R.) (based on an ICC < 0.8) were filtered out.
Statistical Analysis
A quadratic discriminant analysis (QDA) was used to evaluate the ability of the radiomic features to predict response. The QDA classifier generates nonlinear class boundaries (ie, quadratic patterns) while assuming that the covariance of each class is not identical. The minimum redundancy maximum relevance feature selection approach (19) was used to identify the most discriminating of the set of stable and reproducible features identified from the training set; the features were rank ordered in terms of discriminability across 100 iterations of threefold cross validation. Features were ranked by frequency of selection, and the bottom 90% of features were eliminated. According to the Harrell guideline (20), the number of events should exceed the number of features by an order of 10, and so the number of selected features was restricted to seven. The performance of the classifier was evaluated by using the area under the receiver operating characteristic curve (AUC). The trained classifier was subsequently evaluated on the independent testing set. A consensus clustering approach was also used to determine the number and affiliation of possible clusters within the patient studies in the training group. Differences between clinical categories were assessed by using the Fisher exact test and a two-sided Wilcoxon test for categorical and continuous variables, respectively. With CT studies having a wide range of section thicknesses (1–5 mm), the impact of section thickness on the performance of the classifier was also evaluated.
To build the multivariate radiomic signature for TTP and OS, the least absolute shrinkage and selection operator (LASSO) Cox regression model, which is suitable for the regression of high-dimensional data (21), was used to identify the most prognostic features from the set of stable and reproducible features identified in the training set. The LASSO method places a constraint on the sum of the absolute values of the model parameters (coefficients) so that it is less than a tuning parameter λ. This involves penalizing the coefficients of the regression variables, reducing some of them to zero. During the feature selection process, the variables that still have nonzero coefficients after the shrinkage will be included as part of the model. The λ selection strategy was based on a 100-fold cross-validation approach involving minimum criteria (by using glmnet package in R, version 3.1.3). The imaging features with nonzero coefficients were then combined into a radiomics signature. A risk score was computed for each patient according to a linear combination of selected features with corresponding coefficients from the LASSO Cox model in the training set. The radiomics risk score was first evaluated in the training set and then subsequently validated in the testing set by using Kaplan-Meier survival analysis (by using survfit and coxph functions, respectively, in R, version 3.1.3). The patients were stratified into high-risk or low-risk groups on the basis of the risk score, while the threshold for risk score was selected in a way that maximized the χ2 score between the two groups of patients in the training set (by using X-tile [22]). A decision curve analysis was used to determine the clinical usefulness of the radiomics signature in predicting TTP by evaluating the net benefit of high-risk patients receiving treatment at different threshold probabilities (23). Net benefit was defined as the summation of benefits minus loss results (false-positive findings) weighted by a factor related to the relative harm of not identifying a high-risk patient who might go on to have disease progression versus the relative harm of subjecting a lower-risk patient to more aggressive therapy when the more intense therapy was not needed.
Evaluation of the multifeature-based radiomics signature as an independent biomarker was performed by integrating the following clinical-pathologic risk factors into the multivariable Cox proportional hazards model: TNM stage (I, II, III, or IV), histologic grade (adenocarcinoma or squamous), sex (female or male), age, and smoking status (former or never).
Finally, the Cox proportional hazards model was used to calculate hazard ratios (HRs) for the radiomic risk score in multivariate analysis. In addition, 95% confidence intervals (CIs) and relative HRs were calculated by using the Wald test and the G-ρ rank test, respectively.
Segmentation Performance Comparison against Readers
The performance of the classifier on the basis of the lesion annotations of the three radiologist readers was compared to assess the effect of contour variability on subsequent feature analysis and response prediction. The Dice coefficient was calculated for comparing the lesion segmentations from the three radiologists. Additionally, over– and under–lesion segmentation errors were also calculated.
Results
Demographic and Clinical Characteristics
Demographic and clinical characteristics of the 125 patients are given in Table 1.
Table 1:
Demographic and Clinical Characteristics of the 125 Patients, Categorized according to Responders and Nonresponders
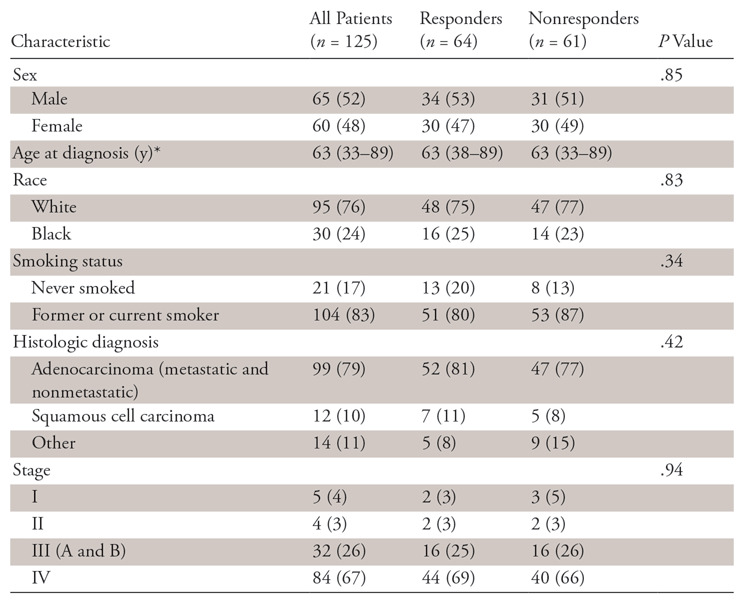
Note.—Unless otherwise specified, data are numbers of patients, with percentages in parentheses.
*Data are medians, with ranges in parentheses.
Feature Analysis
A total of 1542 features were extracted from each CT scan, with 1172 (76%) identified as being highly reproducible on the basis of the ICC of greater than 0.8 threshold. From among these 1172 reproducible features, we considered 404 (34%) to be stable among all three readers on the basis of an ICC of greater than 0.8.
Machine-based Clustering and Classification
The top seven radiomic features identified during feature discovery within the training set included three intratumoral texture features (Gabor, Laws level-ripple, Laws wave-ripple), two peritumoral texture features (Gabor, Laws spot-wave), and one shape (compactness) feature. The average and the variance of ICC for the selected features was 0.87 ± 0.017. Figure 2, A shows a heat map and dendrogram of the top seven discriminating features for responders and nonresponders in the training set.
Figure 2:
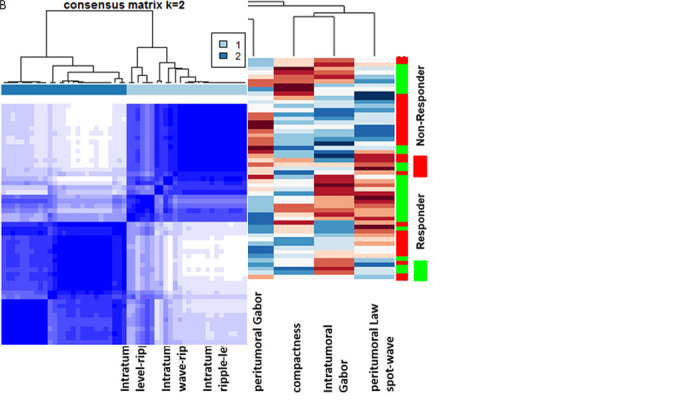
A, Heat map and dendrogram of the top seven discriminating features for responders and nonresponders in the training set. X axis = features selected by the feature selection method. Y axis = the training set of patients (n = 53). Colors represent feature values normalized between [0,1]. A number of identified features showed significant differential expression between the responders and nonresponders for the patients in the training set. B, Matrix shows consensus clustering achieved through a combination of the top seven selected features. A total of 77% of the patients in cluster 1 were responders, and 23% were nonresponders. On the other hand, 78% of the patients in cluster 2 were nonresponders, with 22% of the patients being responders.
Figure 2, B shows the clustering response obtained with a combination of features. The two clusters corresponded to groups with a plurality of responders (77%) and nonresponders (78%), respectively.
The combination of the top seven discriminating features with a QDA classifier yielded a maximum AUC of 0.82 ± 0.09 in the training set. The trained QDA classifier was then evaluated in an independent validation set and resulted in an AUC of 0.77, an accuracy of 0.77, and a precision of 0.90 (P = .0001).
Table 2 also shows the performance of the model in terms of AUC mapped out as a function of section thickness in the test set.
Table 2:
Performance of Model in AUCs Mapped out as a Function of Section Thickness in the Test Set
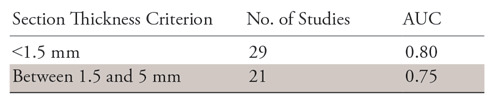
Note.—As can be observed, the areas under the receiver operating characteristic curves (AUCs) for the radiomic features decrease slightly with increasing section thickness.
The distribution statistics of the Laws and Gabor features, as captured by kurtosis and skewness, were found to be different between lesions that did and lesions that did not respond to chemotherapy. Figure 3 suggests the presence of a higher textural pattern disorder or heterogeneity within and around lesions on CT images in nonresponders as compared with lesions in responders.
Figure 3:
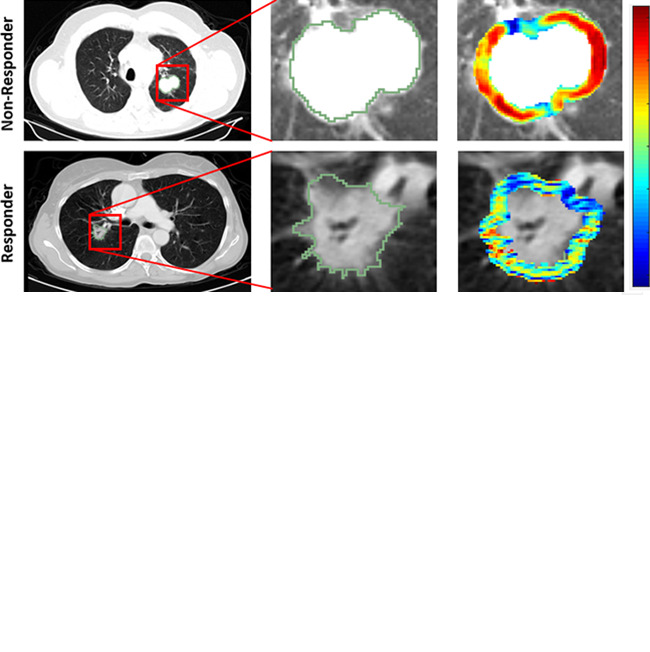
Radiomic feature maps show differences between lesions in responders and lesions in nonresponders at pretreatment CT. There appears to be overexpression of radiomic features (A, peritumoral Gabor and, B, intratumoral Laws features) in the nonresponder lesion compared with the responder lesion. The distribution of the features shows significant differences between the two lesion categories; these differences are captured by the skewness and kurtosis statistics of the feature distribution.
TTP Analysis
The progression rate after surgery was 24%, the mean duration of progression after the first-line treatment was 11.15 months, and the median TTP was 2 months. There was no significant difference in TTP between the training and validation sets (P =.99). Figure E1 (supplement) shows the Kaplan-Meier curves related to TTP rate for five clinical-pathologic parameters. Sex (male vs female) was the only clinical characteristic found to be significantly associated with TTP; TTP values were significantly lower in male patients than in female patients (P = .028). No significant association was found for race (P = .71), smoking status (P =.09), histologic findings (P = .055), or stage of cancer at time of diagnosis (P = .11).
All those features with a nonzero coefficient in the LASSO Cox regression model were used in constructing the radiomics risk-score signature. The radiomic risk score was calculated by a linear combination of the top eight selected features with corresponding coefficients. This signature comprised the intratumoral Laws E5 × L5 features, the intratumoral Laws E5 × E5 features, the intratumoral Laws S5 × R5 features, the intratumoral Laws W5 × L5 features, the peritumoral Laws S5 × W5 features, and the peritumoral Laws S5 × S5 features. The combination of these features yielded a concordance index (C-index) of 0.86 and a Wald P < .0001 in the training set.
The optimum cutoff value for the radiomic risk-score signature was found to be 0.1, and patients were stratified into high- and a low-risk groups on the basis of this value. The radiomics signature was found to be significantly associated with TTP in the training dataset (HR, 2.8; 95% CI: 1.95, 4.00; P <.0001). The radiomics signature was also significantly associated with TTP in the validation dataset (HR, 2.17; 95% CI: 1.41, 5.18; P <.0001). Figure 4 shows Kaplan-Meier analyses according to the radiomics signature for patients in the training set (Fig 4, A) and validation dataset (Fig 4, B).
Figure 4:
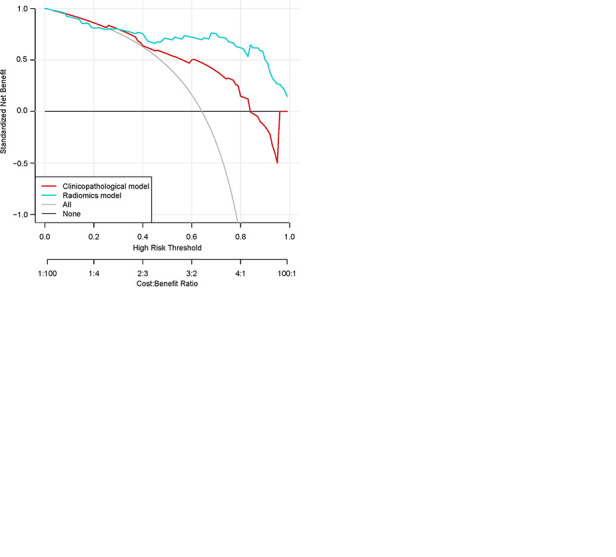
Kaplan-Meier survival analyses according to the radiomics signature risk-score for patients in, A, the training dataset and, B, the test set. A significant association of the radiomics signature with the time-to-progression (TTP) rate was shown in the training dataset (P < .0001), which was then confirmed in the validation dataset (P < .0001). C, Decision curve analysis for each model. The radiomics model had the highest net benefit in predicting which high-risk patients should receive treatment, as compared with a clinicopathologic model and simple strategies such as follow-up of all patients or no patients. This analysis was performed across the full range of threshold probabilities at which a patient would be selected to undergo follow-up imaging.
A multivariate Cox regression analysis identified the radiomics signature as an independent risk factor in TTP (radiomics signature risk score: HR, 2.65, 95% CI: 1.66, 4.24, P <.0001; clinical stage: HR, 1.72, 95% CI: 0.7532, 3.948, P =.19; histologic grade: HR, 1.14, 95% CI: 0.48, 2.749, P =.75; sex: HR, 0.6, 95% CI: 0.31, 1.16, P =.133; and age: HR, 1.00, 95% CI: 0.96, 1.04, P =.82).
Additionally, a decision curve analysis showed that the radiomics risk-score signature had a higher overall net benefit in predicting high-risk patients for receiving treatment than the clinical-pathologic measurements across a number of threshold probability values (Fig 4, C).
OS Analysis
The median follow-up for all 125 patients was 24 months (1–120). Figure E2 (supplement) shows the OS Kaplan-Meier curves for five clinical-pathologic parameters and the results of survival analysis. Smoking status (smoker vs never smoker; P =.0025), stage of cancer at time of diagnosis (stage III vs stage IV; P =.0038), and race (white vs black; P =.044) were three independent clinical characteristics that were found to be significantly associated with OS; no other difference was found for either sex (P =.18) or histologic findings (P =.056).
Again, the radiomic risk score associated with OS was calculated by means of a linear combination of the top four LASSO-selected features. This signature comprised the intratumoral Haralick correlation, Haralick diff_entropy, and intratumoral Collage diff_entropy features. The combination of these features yielded a C-index of 0.71 and Wald P =.0011 in the training set.
Patients were divided into those with high risk and those with low risk on the basis of an optimum cutoff risk score. The radiomics signature was associated with OS in the training dataset (HR, 2.35; 95% CI: 1.41, 3.94; P =.0011). Figure 5 shows OS Kaplan-Meier analyses according to the radiomics signature risk score for patients in the training set (Fig 5, A; P = .0004) and patients in the validation dataset (Fig 5, B; P =.0041).
Figure 5:
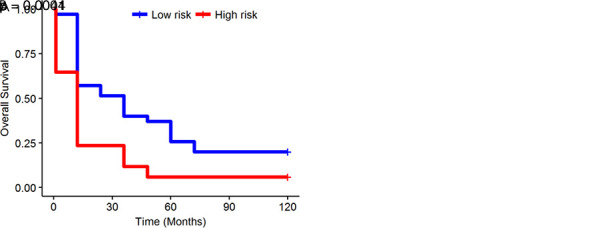
Kaplan-Meier survival analyses according to the radiomics signature for patients in, A, the training dataset and, B, the validation dataset. A significant association of the radiomics signature with overall survival was observed in the training dataset (P = .0004) and was then confirmed in the validation dataset (P = .0041).
A multivariate Cox regression analysis identified the radiomics signature and smoking status (former smoker vs never smoker) as independent risk factors for OS (radiomics signature risk score: HR, 2.36, 95% CI: 1.32, 4.21, P =.0035; smoking status: HR, 0.26, 95% CI: 0.075, 0.916, P =.036). The combination of the radiomic risk score and smoking status increased the C-index from 0.71 to 0.77 in the training dataset. A multivariate Cox regression analysis in the validation set yielded a C-index of 0.72 and identified the radiomics signature risk score as an independent risk factor for OS (HR, 1.89; 95% CI: 1.11, 5.16; P =.0078).
Comparison of Segmentation Performance among Readers
The results of interreader agreement in terms of Dice similarity coefficients and over- and under-segmentation errors ( ,
,  ) are summarized in Table 3. Figure 6 shows interreader-specific Dice values for 20 studies. Note that the Dice values between two readers are averaged and then plotted in Figure 6. The performance of the QDA classifier was also evaluated on three sets of annotated CT scans by the three radiologists.
Table 3:
Interreader Agreement in Dice Similarity Coefficients and Over- and Under-Segmentation Errors for All 125 Patients
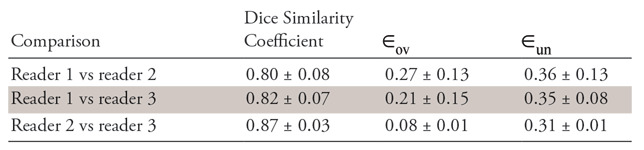
Note.—Data are means ± standard deviations.  = over-segmentation error,
  = under-segmentation error.
Figure 6:
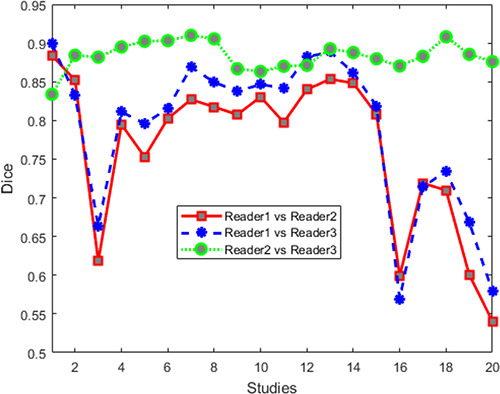
Dice values for human readers for 20 cases. Note that segmentation agreement values between each set of two readers are averaged from those sections identified as containing a lesion by the two readers.
For CT studies annotated by reader 1 (R.T.), the classifier yielded an AUC of 0.82 for the training set and 0.77 for the independent validation set. For CT studies annotated by reader 2 (K.B.), the AUC for the training set was 0.82, while the AUC was 0.76 for the validation set. Finally, for CT studies annotated by reader 3 (P.R.), the corresponding training and validation set AUCs were 0.82 and 0.78, respectively.
Discussion
Despite recent advances in treatment options for patients with metastatic NSCLC, the reported outcomes and survival are decidedly modest (24–27). Platinum-based doublet chemotherapy is the current clinical standard treatment for patients with metastatic NSCLC without actionable genomic alterations or high PD-L1 expression. However, only 25% of patients benefit from chemotherapy. Unfortunately, there are currently no clinically validated biomarkers that enable identification of patients who can benefit from chemotherapy.
Our aim in this study was to determine whether an early prediction of response to chemotherapy is possible by using computer-extracted measurements of heterogeneity patterns within and outside the lung nodule, along with the shape of the nodule, on baseline noncontrast CT scans.
A number of recent studies have explored the role of radiomic features for distinguishing responders to chemotherapy from nonresponders and for predicting response to radiation therapy on the basis of CT images, with most of these studies focusing on NSCLC. For instance, Coroller et al (28) showed that radiomic measurements extracted from pretreatment baseline CT images of the primary tumor and lymph nodes in NSCLC were predictive of pathologic complete response (pCR) after neoadjuvant chemotherapy and radiation therapy and before surgery with an AUC of 0.67 in a cohort of 85 patients. In another study by Coroller et al (11), the authors showed that high-frequency wavelet texture features extracted from the primary tumor were significantly predictive of pCR (AUC, 0.63) for 127 patients with stage II or III NSCLC treated with radiation and chemotherapy. Fave and colleagues (12) evaluated the role of radiomic texture features between baseline and weekly posttreatment four-dimensional CT scans in predicting OS compared with a model that used only clinical- and pretreatment-based radiomic features. Most of the studies in this space were limited by the lack of an independent holdout set to validate the radiomic measurements.
Despite the large number of studies in the CT-radiomics space, the immediate surrounding tumor area, or the peritumoral region, has remained relatively unexplored. One of the primary objectives of this study was to use radiomic-based interrogation of peritumoral patterns on noncontrast CT images for stratifying responders to platinum-based chemotherapy from nonresponders. Additionally, we also showed that a combination of texture radiomic features extracted from immediately within and outside the nodule on noncontrast CT images were significantly associated with OS and TTP. It has been shown that the heterogeneity of the tumor is a predictor of survival in patients with NSCLC (29,30). Although the reason is yet unclear, tumor heterogeneity, which in turn breeds tumor evolution, might be reflective of clonal dominance or genomic heterogeneity within the tumors (31). Intratumoral genetic heterogeneity also has been shown to be a leading contributor to therapeutic failure (32).
Our study revealed that the TTP values in tumoral region with higher peritumoral Laws texture features that capture peritumoral vascular invasion and neovascularization were significantly lower than those with lower peritumoral Laws feature (P < .0001). Previous studies have shown that the existence of extratumoral vascular invasion is a potential factor associated with distant metastasis and shorter recurrence-free survival time in NSCLC (33,34).
Our study showed that our radiomic signature, which may be capturing tumor heterogeneity, can also potentially help identify those patients who are at elevated risk for recurrence and who might benefit from more intensive observation and follow-up.
Our results showed clear evidence of the role of peritumoral texture patterns in predicting response and TTP after pemetrexed chemotherapy. Even though we did not explicitly probe the morphologic or molecular basis for the identified peritumoral radiomic features, we can hypothesize on the basis of preexisting evidence that these patterns appear to reflect increased fibrotic content in chemotherapy-compliant tumors (35).
Another reason could also be that the radiomic features might be reflective of patterns relating to hypoxic tumors that are known to be chemotherapy resistant (36). Tumor hypoxia is one of the most important contributing factors in the evolution of chemotherapy resistance. Hypoxia-inducible factor 1 is produced in response to a hypoxic microenvironment that promotes neoangiogenesis and increases the metastatic potential of tumors and decreases responses to chemotherapy regimens (37). Hypoxic tumors, which suffer from oxygen deprivation, have been shown to be identified through texture analysis of the nodules on CT scans (38).
Tumor-infiltrating lymphocytes and tumor-associated macrophages, which are abundant in the tumor microenvironment, drive responses to immune therapies and have been found to be crucially involved in lung cancer pathogenesis and progression, might also be captured by peritumoral textural features (39–42). Additionally, endothelial progenitor cells (EPCs), which may play a role in tumor angiogenesis and tumor neovascularization, may be reflected in the increasing radiomic feature intensity in the peritumoral region in nonresponders. This seems to align with the fact that the level of EPCs is significantly increased in NSCLC, reducing a tumor’s accessibility to chemotherapeutic drugs and thereby diminishing the efficacy of chemotherapy (43,44).
Our study had limitations. The cohort sample sizes were small, which limited our ability to perform extensive stratified analyses, such as looking at the correlation and association of molecular and mutational status of the tumors. In addition, standardization of imaging protocols, especially across different institutions, remains a challenge in imaging biomarker development. Variability in the timing of image acquisition is an inherent issue in most retrospective imaging studies. We believe that this may not have substantially affected our current study. However, the single-institution design of our study generates the obvious question of the generalizability of the classifier. In addition, there is a dependency of the radiomic features on the manual annotation of the nodule, which we tried to address in part by using three readers and comparing their segmentation accuracy as a variable in the radiomic analysis.
The other limitation of this study was that the included patients with lung cancer had no actionable mutation and no PD-1/PD-L1 interaction scores. This raises a critical question in that beyond chemotherapy, there is no other viable clinical option to treat these patients. However, recent data from the KEYNOTE-189 trial in NSCLC demonstrated the benefit of chemotherapy and immunotherapy over chemotherapy alone. In light of these findings, there is an opportunity to refine subgroups of patients with NSCLC who may benefit from such an approach. Additionally, studies have rigorously and quantitatively investigated the influence of acquisition parameters on radiomic features for characterization of CT lung nodules (45). Although our result is consistent with previous findings that radiomic features derived from thin-section CT scans have better diagnostic performance than those derived from thick-section CT scans, we did not explicitly consider the influence of other parameters. We hope to address these limitations in future work.
In conclusion, quantitative imaging features from a baseline noncontrast CT scan derived from within the tumor and its associated tumor microenvironment were shown to be able to distinguish patients with NSCLC who did respond to pemetrexed-based chemotherapy from those who did not. We also showed that baseline CT-derived tumor heterogeneity is associated with overall survival and time to progression in patients with NSCLC. Additional large-scale multisite validation needs to be performed before this radiomic model would be fit for clinical deployment.
SUPPLEMENTAL TABLES
SUPPLEMENTAL FIGURES
Supported by the U.S. Department of Defense, the National Cancer Institute, the National Institute of Diabetes and Digestive and Kidney Diseases, the National Center for Research Resources, the Ohio Third Frontier Technology Validation Fund, the Wallace H. Coulter Foundation Program in the Department of Biomedical Engineering, and the Clinical and Translational Science Award Program at Case Western Reserve University.
The content is solely the responsibility of the authors and does not necessarily represent the official views of the National Institutes of Health.
M. Khorrami and M. Khunger contributed equally to this work.
Disclosures of Conflicts of Interest: M. Khorrami disclosed no relevant relationships. M. Khunger disclosed no relevant relationships. A.Z. disclosed no relevant relationships. P.P. disclosed no relevant relationships. R.T. disclosed no relevant relationships. K.B. disclosed no relevant relationships. P.R. disclosed no relevant relationships. P.F. disclosed no relevant relationships. V.V. Activities related to the present article: disclosed no relevant relationships. Activities not related to the present article: is a consultant for BMS, Genentech, Astrazeneca, Celgene, Foundation Medicine, Taekeda, Merck, Alkermes, and Nektar Therapeutics; institution has grants or grants pending with Astrazeneca, Merck, BMS, Genentech, and Alkermes; is on the speakers bureaus of Novartis, BMS, Celgene, and Foundation Medicine; has received payment for the development of educational presentations from BMS and Foundation Medicine. Other relationships: disclosed no relevant relationships. A.M. Activities related to the present article: disclosed no relevant relationships. Activities not related to the present article: is on the board of and is a consultant to Inspirata; institution has three NCI RO1 grants with Inspirata and one ongoing U24 with PathCore; Elucid Bioimaging and Inspirata has licensed some of institutions’ patents (both Case Western Reserve University and Rutgers University); receives royalties from Elucid Bioimaging and Inspirata; holds stock equity in Elucid Bioimaging and Inspirata. Other relationships: disclosed no relevant relationships.
Abbreviations:
- AUC
- area under the receiver operating characteristic curve
- CI
- confidence interval
- HR
- hazard ratio
- ICC
- intraclass correlation coefficient
- LASSO
- least absolute shrinkage and selection operator
- NSCLC
- non–small cell lung cancer
- OS
- overall survival
- QDA
- quadratic discriminant analysis
- RECIST
- Response Evaluation Criteria in Solid Tumors
- TTP
- time to progression
References
- 1.Siegel RL, Miller KD, Jemal A. Cancer statistics, 2016. CA Cancer J Clin 2016;66(1):7–30. [DOI] [PubMed] [Google Scholar]
- 2.Dela Cruz CS, Tanoue LT, Matthay RA. Lung cancer: epidemiology, etiology, and prevention. Clin Chest Med 2011;32(4):605–644. [DOI] [PMC free article] [PubMed] [Google Scholar]
- 3.Patel JD, Socinski MA, Garon EB, et al. PointBreak: a randomized phase III study of pemetrexed plus carboplatin and bevacizumab followed by maintenance pemetrexed and bevacizumab versus paclitaxel plus carboplatin and bevacizumab followed by maintenance bevacizumab in patients with stage IIIB or IV nonsquamous non-small-cell lung cancer. J Clin Oncol 2013;31(34):4349–4357. [DOI] [PMC free article] [PubMed] [Google Scholar]
- 4.Zukin M, Barrios CH, Pereira JR, et al. Randomized phase III trial of single-agent pemetrexed versus carboplatin and pemetrexed in patients with advanced non-small-cell lung cancer and Eastern Cooperative Oncology Group performance status of 2. J Clin Oncol 2013;31(23):2849–2853. [DOI] [PubMed] [Google Scholar]
- 5.Friboulet L, Olaussen KA, Pignon JP, et al. ERCC1 isoform expression and DNA repair in non-small-cell lung cancer. N Engl J Med 2013;368(12):1101–1110. [DOI] [PMC free article] [PubMed] [Google Scholar]
- 6.Bukhari AA, Goudar RK. Thymidylate synthase as a predictive biomarker for pemetrexed response in NSCLC. Lung Cancer Int 2013;2013:436409. [DOI] [PMC free article] [PubMed] [Google Scholar]
- 7.Tixier F, Le Rest CC, Hatt M, et al. Intratumor heterogeneity characterized by textural features on baseline 18F-FDG PET images predicts response to concomitant radiochemotherapy in esophageal cancer. J Nucl Med 2011;52(3):369–378. [DOI] [PMC free article] [PubMed] [Google Scholar]
- 8.Ahmed A, Gibbs P, Pickles M, Turnbull L. Texture analysis in assessment and prediction of chemotherapy response in breast cancer. J Magn Reson Imaging 2013;38(1):89–101. [DOI] [PubMed] [Google Scholar]
- 9.Wu J, Cao G, Sun X, et al. Intratumoral spatial heterogeneity at perfusion MR imaging predicts recurrence-free survival in locally advanced breast cancer treated with neoadjuvant chemotherapy. Radiology 2018;288(1):26–35. [DOI] [PMC free article] [PubMed] [Google Scholar]
- 10.Ravanelli M, Farina D, Morassi M, et al. Texture analysis of advanced non-small cell lung cancer (NSCLC) on contrast-enhanced computed tomography: prediction of the response to the first-line chemotherapy. Eur Radiol 2013;23(12):3450–3455. [DOI] [PubMed] [Google Scholar]
- 11.Coroller TP, Agrawal V, Narayan V, et al. Radiomic phenotype features predict pathological response in non-small cell lung cancer. Radiother Oncol 2016;119(3):480–486. [DOI] [PMC free article] [PubMed] [Google Scholar]
- 12.Fave X, Zhang L, Yang J, et al. Delta-radiomics features for the prediction of patient outcomes in non-small cell lung cancer. Sci Rep 2017;7(1):588. [DOI] [PMC free article] [PubMed] [Google Scholar]
- 13.Zhang BC, Guan S, Zhang YF, et al. Peritumoral lymphatic microvessel density is related to poor prognosis in lung adenocarcinoma: a retrospective study of 65 cases. Exp Ther Med 2012;3(4):636–640. [DOI] [PMC free article] [PubMed] [Google Scholar]
- 14.Parra ER, Behrens C, Rodriguez-Canales J, et al. Image analysis-based assessment of PD-L1 and tumor-associated immune cells density supports distinct intratumoral microenvironment groups in non-small cell lung carcinoma patients. Clin Cancer Res 2016;22(24):6278–6289. [DOI] [PMC free article] [PubMed] [Google Scholar]
- 15.Braman NM, Etesami M, Prasanna P, et al. Intratumoral and peritumoral radiomics for the pretreatment prediction of pathological complete response to neoadjuvant chemotherapy based on breast DCE-MRI. Breast Cancer Res 2017;19(1):57 [Published correction appears in Breast Cancer Res 2017;19(1):80.] 10.1186/s13058-017-0846-1. [DOI] [PMC free article] [PubMed] [Google Scholar]
- 16.Mohiuddin K, Haneuse S, Sofer T, et al. Relationship between margin distance and local recurrence among patients undergoing wedge resection for small (£2 cm) non-small cell lung cancer. J Thorac Cardiovasc Surg 2014;147(4):1169–1175; discussion 1175–1177. [DOI] [PubMed] [Google Scholar]
- 17.Orooji M, Alilou M, Rakshit S, et al. Combination of computer extracted shape and texture features enables discrimination of granulomas from adenocarcinoma on chest computed tomography. J Med Imaging (Bellingham) 2018;5(2):024501. [DOI] [PMC free article] [PubMed] [Google Scholar]
- 18.Armato SG 3rd, Meyer CR, Mcnitt-Gray MF, et al. The Reference Image Database to Evaluate Response to therapy in lung cancer (RIDER) project: a resource for the development of change-analysis software. Clin Pharmacol Ther 2008;84(4):448–456. [DOI] [PMC free article] [PubMed] [Google Scholar]
- 19.Ding C, Peng H. Minimum redundancy feature selection from microarray gene expression data. J Bioinform Comput Biol 2005;3(2):185–205. [DOI] [PubMed] [Google Scholar]
- 20.Harrell FE Jr. Regression modeling strategies with applications to linear models, logistic and ordinal regression, and survival analysis. New York, NY: Springer-Verlag, 2015. [Google Scholar]
- 21.Tibshirani R. The lasso method for variable selection in the Cox model. Stat Med 1997;16(4):385–395. [DOI] [PubMed] [Google Scholar]
- 22.Camp RL, Dolled-Filhart M, Rimm DL. X-tile: a new bio-informatics tool for biomarker assessment and outcome-based cut-point optimization. Clin Cancer Res 2004;10(21):7252–7259. [DOI] [PubMed] [Google Scholar]
- 23.Vickers AJ, Elkin EB. Decision curve analysis: a novel method for evaluating prediction models. Med Decis Making 2006;26(6):565–574. [DOI] [PMC free article] [PubMed] [Google Scholar]
- 24.Sulpher JA, Owen SP, Hon H, et al. Factors influencing a specific pathologic diagnosis of non-small-cell lung carcinoma. Clin Lung Cancer 2013;14(3):238–244. [DOI] [PubMed] [Google Scholar]
- 25.Massarelli E, Andre F, Liu DD, et al. A retrospective analysis of the outcome of patients who have received two prior chemotherapy regimens including platinum and docetaxel for recurrent non-small-cell lung cancer. Lung Cancer 2013;39(1):55–61. [DOI] [PubMed] [Google Scholar]
- 26.Leighl NB. Treatment paradigms for patients with metastatic non-small-cell lung cancer: first-, second-, and third-line. Curr Oncol 2012;19(Suppl 1):S52–S58. [DOI] [PMC free article] [PubMed] [Google Scholar]
- 27.Onn A, Tsuboi M, Thatcher N. Treatment of non-small-cell lung cancer: a perspective on the recent advances and the experience with gefitinib. Br J Cancer 2004;91(Suppl 2):S11–S17. [DOI] [PMC free article] [PubMed] [Google Scholar]
- 28.Coroller TP, Agrawal V, Huynh E, et al. Radiomic-based pathological response prediction from primary tumors and lymph nodes in NSCLC. J Thorac Oncol 2017;12(3):467–476. [DOI] [PMC free article] [PubMed] [Google Scholar]
- 29.Oikonomou A, Khalvati F, Tyrrell PN, et al. Radiomics analysis at PET/CT contributes to prognosis of recurrence and survival in lung cancer treated with stereotactic body radiotherapy. Sci Rep 2018;8(1):4003. [DOI] [PMC free article] [PubMed] [Google Scholar]
- 30.Win T, Miles KA, Janes SM, et al. Tumor heterogeneity and permeability as measured on the CT component of PET/CT predict survival in patients with non-small cell lung cancer. Clin Cancer Res 2013;19(13):3591–3599. [DOI] [PubMed] [Google Scholar]
- 31.Gerlinger M, Rowan AJ, Horswell S, et al. Intratumor heterogeneity and branched evolution revealed by multiregion sequencing. N Engl J Med 2012;366(10):883–892. [DOI] [PMC free article] [PubMed] [Google Scholar]
- 32.Burrell RA, Swanton C. Tumour heterogeneity and the evolution of polyclonal drug resistance. Mol Oncol 2014;8(6):1095–1111. [DOI] [PMC free article] [PubMed] [Google Scholar]
- 33.Saijo T, Ishii G, Ochiai A, et al. Evaluation of extratumoral lymphatic permeation in non-small cell lung cancer as a means of predicting outcome. Lung Cancer 2007;55(1):61–66. [DOI] [PubMed] [Google Scholar]
- 34.Shimada Y, Ishii G, Hishida T, Yoshida J, Nishimura M, Nagai K. Extratumoral vascular invasion is a significant prognostic indicator and a predicting factor of distant metastasis in non-small cell lung cancer. J Thorac Oncol 2010;5(7):970–975. [DOI] [PubMed] [Google Scholar]
- 35.Liu-Jarin X, Stoopler MB, Raftopoulos H, Ginsburg M, Gorenstein L, Borczuk AC. Histologic assessment of non-small cell lung carcinoma after neoadjuvant therapy. Mod Pathol 2003;16(11):1102–1108. [DOI] [PubMed] [Google Scholar]
- 36.Semenza GL. HIF-1 and tumor progression: pathophysiology and therapeutics. Trends Mol Med 2002;8(4 Suppl):S62–S67. [DOI] [PubMed] [Google Scholar]
- 37.Song X, Liu X, Chi W, et al. Hypoxia-induced resistance to cisplatin and doxorubicin in non-small cell lung cancer is inhibited by silencing of HIF-1α gene. Cancer Chemother Pharmacol 2006;58(6):776–784. [DOI] [PubMed] [Google Scholar]
- 38.Ganeshan B, Goh V, Mandeville HC, Ng QS, Hoskin PJ, Miles KA. Non-small cell lung cancer: histopathologic correlates for texture parameters at CT. Radiology 2013;266(1):326–336. [DOI] [PubMed] [Google Scholar]
- 39.Maeda R, Yoshida J, Ishii G, Hishida T, Nishimura M, Nagai K. Prognostic impact of intratumoral vascular invasion in non-small cell lung cancer patients. Thorax 2010;65(12):1092–1098. [DOI] [PubMed] [Google Scholar]
- 40.Geng Y, Shao Y, He W, et al. Prognostic role of tumor-infiltrating lymphocytes in lung cancer: a meta-analysis. Cell Physiol Biochem 2015;37(4):1560–1571. [DOI] [PubMed] [Google Scholar]
- 41.Ogawa J, Tsurumi T, Yamada S, Koide S, Shohtsu A. Blood vessel invasion and expression of sialyl Lewisx and proliferating cell nuclear antigen in stage I non-small cell lung cancer: relation to postoperative recurrence. Cancer 1994;73(4):1177–1183. [DOI] [PubMed] [Google Scholar]
- 42.Gabor S, Renner H, Popper H, et al. Invasion of blood vessels as significant prognostic factor in radically resected T1-3N0M0 non-small-cell lung cancer. Eur J Cardiothorac Surg 2004;25(3):439–442. [DOI] [PubMed] [Google Scholar]
- 43.Hilbe W, Dirnhofer S, Oberwasserlechner F, et al. CD133 positive endothelial progenitor cells contribute to the tumour vasculature in non-small cell lung cancer. J Clin Pathol 2004;57(9):965–969. [DOI] [PMC free article] [PubMed] [Google Scholar]
- 44.Morita R, Sato K, Nakano M, et al. Endothelial progenitor cells are associated with response to chemotherapy in human non-small-cell lung cancer. J Cancer Res Clin Oncol 2011;137(12):1849–1857. [DOI] [PubMed] [Google Scholar]
- 45.He L, Huang Y, Ma Z, Liang C, Liang C, Liu Z. Effects of contrast-enhancement, reconstruction slice thickness and convolution kernel on the diagnostic performance of radiomics signature in solitary pulmonary nodule. Sci Rep 2016;6(1):34921. [DOI] [PMC free article] [PubMed] [Google Scholar]
Associated Data
This section collects any data citations, data availability statements, or supplementary materials included in this article.