

Abstract
Genetically encoded voltage indicators (GEVIs) are emerging optical tools for acquiring brain-wide cell-type-specific functional data at unparalleled temporal resolution. To broaden the application of GEVIs in high-speed multispectral imaging, we used a high-throughput strategy to develop voltage-activated red neuronal activity monitor (VARNAM), a fusion of the fast Acetabularia opsin and the bright red fluorophore mRuby3. Imageable under the modest illumination intensities required by bright green probes (<50 mW mm−2), VARNAM is readily usable in vivo. VARNAM can be combined with blue-shifted optical tools to enable cell-type-specific all-optical electrophysiology and dual-color spike imaging in acute brain slices and live Drosophila. With enhanced sensitivity to subthreshold voltages, VARNAM resolves postsynaptic potentials in slices and cortical and hippocampal rhythms in freely behaving mice. Together, VARNAM lends a new hue to the optical toolbox, opening the door to high-speed in vivo multispectral functional imaging.
Optical approaches to monitor and control neuronal activity provide live snapshots of activity patterns in individual neurons within large ensembles. When combined with the genetic delivery of indicator and actuator proteins, they can generate functional maps of precisely identified synaptic partners.
GEVIs are proteins that exhibit fluorescence intensity changes in response to transmembrane voltage transients1,2. Their direct voltage-sensing capability and fast kinetics make GEVIs ideal candidates for functional neural imaging. The large voltage sensitivity of ArcLight, a prototypical GEVI consisting of the Ciona phosphatase voltage-sensing domain (CiVSD) and a pH-sensitive green fluorescent protein (GFP), permits visualization of synaptic potentials, hyperpolarization and population voltages in vitro and in vivo3–6. The fast kinetics of ASAPs (τ ≈ 3 ms), another family of VSD-based GFP GEVIs, enables imaging of single action potentials (APs) in fast AP trains in cultures and subcellular voltage dynamics in flies7–9. The exceptional spike detection fidelity of Ace-mNeon, a fluorescence resonance energy transfer (FRET)-opsin indicator that integrates the submillisecond kinetics of Acetabularia opsin (Ace) with the superior brightness of mNeonGreen, allows near error-free spike-timing estimations in awake animals10.
Despite a surge in faster and more sensitive probes6,7,9–13, contemporary GEVIs offer limited spectral diversity. In paired recordings, green fluorescent indicators cannot be effectively coupled with red-shifted channelrhodopsins, which experience substantial cross-activation under blue light14–16. Single-color GEVIs are also constraining for multispectral studies, such as functional mapping of distinct cell types, where it becomes necessary to combine spectrally non-overlapping voltage indicators with each other, with calcium indicators or neurotransmitter indicators2.
Existing red-shifted GEVIs provide better spectral separation for coupling with blue-shifted optical tools17,18. However, they are less optimized for in vivo applications. For instance, GEVIs consisting of stand-alone Archaerhodopsin (Arch) mutants exhibit impressive kinetics for spike detection, but, despite recent efforts to engineer brighter variants, require intense illumination (1–12 W mm−2 versus <50 mW mm−2 for GFP-based probes) to enable voltage recordings with high signal-to-noise ratios (SNRs)18–20. The CiVSD-mApple fusion protein FlicR1 is brighter, yet requires ~100 mW mm−2 in cultures and exhibits moderate sensitivity and kinetics, inadequate for spike recordings in vivo17.
Here, we developed a red GEVI, voltage-activated red neuronal activity monitor (VARNAM, which means ‘hue’ in Sanskrit) using a high-throughput voltage-screening approach. We identified VARNAM, an ultrafast FRET-opsin indicator based on Ace and the bright red FP mRuby3, in a voltage screen comprising ~1,056 sequence variants transfected across ~2 × 10⁶ mammalian cells. Readily imageable under moderate intensities of 15 mW mm−2 in cultures, acute slices and live Drosophila, VARNAM reports APs with sensitivity and kinetics comparable to Ace-mNeon. VARNAM captures postsynaptic potentials in slices as well as cell-type-specific transmembrane voltage dynamics in freely behaving mice. Lastly, VARNAM enables dual-color spike imaging and all-optical electrophysiology with minimal spectral crosstalk.
Results
High-throughput screening of voltage indicators.
To develop red voltage indicators, our voltage screening workflow encompasses site-directed saturation mutagenesis of the indicator sequence followed by high-throughput voltage screening13 (Fig. 1a). Our semi-automated imaging platform utilizes a single field stimulation electrode to deliver current pulses one well after another, while fluorescence time-series images are recorded using a sCMOS camera (Fig. 1b, Supplementary Fig. 1 and Supplementary Note 1).
Fig. 1. engineering VARNAM on high-throughput platform.
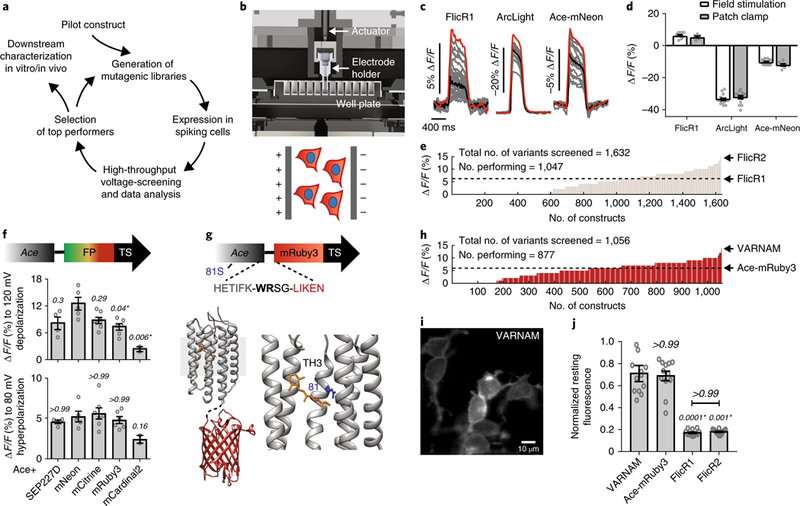
a, Voltage screening workflow. b, Top, computer-aided design of 96-well voltage-imaging platform. Bottom, cartoon of cells expressing red GEVI and blue nuclear marker under an electric field. c, Fluorescence responses (gray) from individual cells expressing FlicR1, ArcLight or Ace-mNeon (n = 24 wells/condition). Black and red traces represent mean and maximum responses, respectively. d, Comparisons of maximum fluorescence responses on the platform to mean response from patch-clamp recordings for FlicR1, ArcLight and Ace-mNeon. n = 10 and 6 cells, 15 cells each, and 16 and 7 cells, respectively. P > 0.99, P = 0.54 and P = 0.4 between the two groups (field stimulation vs. patch clamp recordings) in the three conditions, respectively (two-way ANOVA with Bonferroni’s multiple comparisons test). e, Distribution of voltage sensitivities of FlicR variants screened on the platform. f, Fluorescence responses to 120 mV depolarization and 80 mV hyperpolarization in HEK cells expressing Ace fusions with indicated FPs. n = 4 cells (Ace-SEP227D), 5 cells (Ace-mNeon), 7 cells (Ace-mCitrine), 6 cells (Ace-mRuby3), 2 cells (Ace-mCardinal2). Statistical comparisons were made to Ace-mNeon. P values are italicized. Asterisks denote statistical significance (Kruskal-Wallis test with Dunn’s multiple comparisons correction). g, Top, VARNAM schematic showing amino acid sequence at Ace-FP junction, and 81 S. Bottom, crystal structures of Ace (PDB 3AM6) and mRuby (PDB 3U0N) in fusion configuration. Lower right, magnified view of Ace with chromophore retinal (yellow) and residue 81 (blue). TH3, third transmembrane helix. h, Distribution of voltage sensitivities of screened Ace-mRuby3 variants. i, Epifluorescence image of HEK cells expressing VARNAM (n = 24 wells, 6 cultures). j, Resting fluorescence of VARNAM, Ace-mRuby3, FlicR1 and FlicR2 in HEK cells normalized to average resting intensity of Ace-mNeon. P values are italicized. Statistical comparisons were made to VARNAM. Asterisks denote significance (Kruskal−Wallis test with Dunn’s multiple comparisons correction), n = 12 wells/condition, ~500 cells/well. In d,f,j, values represent mean ± s.e.m.
In pilot studies, we determined that the maximum fluorescence change to baseline fluorescence (∆F/F) obtained on the platform for preexisting GEVIs6,10,17 matched their optical responses to 120 mV depolarization in simultaneous whole-cell patch-clamp and fluorescence imaging in HEK cells (Fig. 1c,d). Field stimulation versus patch-clamp ∆F/F for FlicR1, ArcLight and Ace-mNeon were 6.1 ± 0.5% (mean ± s.e.m.) versus 5.2 ± 0.6%, −33.2 ± 0.8% versus −32 ± 0.9%, and −10.3 ± 0.4% versus −12.1 ± 0.7%, respectively (n = 10 and 6 cells (FlicR1), 15 cells each (ArcLight) and 16 and 7 cells (Ace-mNeon)).
Using this approach, we identified a FlicR1 variant, FlicR2, with twice the sensitivity (Fig. 1e, Supplementary Fig. 2 and Supplementary Note 2). However, FlicR2 continued to exhibit dim fluorescence and impaired localization in intact tissue, not unlike its predecessor17.
VARNAM, a red FRET-opsin indicator.
Ace rhodopsin variants exhibit exceptional spike detection fidelity in fusion constructs with the bright green fluorophore mNeonGreen10. For high-fidelity red voltage imaging, we envisioned an indicator based on Ace and a bright red fluorophore. However, in Ace-mNeon, the voltage-dependent absorption of the chromophore retinal (FRET-acceptor) is natively blue-shifted, allowing optimal quenching of the fluorescence of mNeonGreen during depolarization. We surmised that replacing mNeonGreen with a red fluorophore might not retain the FRET efficiency nor voltage sensitivity of the parental indicator. Indeed, we found that voltage sensitivities of Ace fusion constructs with bright FPs peaked in the green and yellow wavelengths, corresponding to Ace-mNeon and Ace-mCitrine, but tapered off in the far red (Fig. 1f and Supplementary Fig. 3a).
Ace-mRuby3 exhibited a ∆F/F of −7.9 ± 0.5% (mean ± s.e.m.; SNR = 22) and 4.8 ± 0.3% for maximum depolarization and hyperpolarization, respectively (n = 10 cells). The probe showed remarkable membrane expression in HEK cells, was substantially brighter than FlicR1 and FlicR2 and readily imageable at 15 mW mm−2 (565 nm). In concurrent electrical and optical recordings in acute slices, Ace-mRuby3 resolved current-induced and spontaneous APs with −1.2 ± 0.2% (mean ± s.e.m.; SNR = 4; n = 4 neurons) and −0.8 ± 0.01% ∆F/F per spike, respectively (Supplementary Figs. 3b and 4).
To further enhance the sensitivity of Ace-mRuby3, we targeted factors crucial for FRET21: the length (and composition) of the linker between the opsin and FP, and Ace’s absorption spectrum, which is modulated by residues lining the retinal-binding pocket (RBP) in prototypical opsins22–24 (Fig. 1g). In platform-based assays comprising 288 linker variants, the double insertional variant Ace-WR-mRuby3 emerged ~1.4 times more responsive than control (Supplementary Fig. 5). Subsequently, among 768 RBP mutants, we uncovered Ace-WR-mRuby3 N81S, which was about twice as sensitive as Ace-mRuby3 with unaltered resting brightness (Fig. 1h–j and Supplementary Fig. 6). Interestingly, mutation to serine at a homologous residue in Gloeobacter rhodopsin red-shifts its absorption spectrum22.
In HEK cells, Ace-WR-mRuby3 N81S, which we named voltage-activated red neuronal activity monitor (VARNAM), showed excellent membrane expression (Fig. 1i) and exhibited −14.1 ± 0.4% ∆F/F (mean ± s.e.m.; SNR = 49) to 120 mV depolarization and 9.1 ± 0.3% ∆F/F to 80 mV hyperpolarization (n = 14 cells), comparable to those of Ace-mNeon (−13.4 ± 0.5% (SNR = 59) and 6.1 ± 0.5% ∆F/F, respectively, n = 11 cells) (Fig. 2a,b). VARNAM’s fluorescence responses exhibited hysteresis, as noted for opsin indicators10,25. VARNAM was significantly more sensitive to hyperpolarization than FlicR1 or FlicR2 (∆F/F: −2.7 ± 0.2%, n = 4 cells (FlicR1, mean ± s.e.m.) and −4.2 ± 0.5%, n = 6 cells (FlicR2), P = 0.0003 and P = 0.009, respectively, one-way ANOVA with Dunn’s multiple comparisons test) (Fig. 2b and Supplementary Fig. 2). At room temperature, the kinetics were akin to that of Ace-mNeon but substantially faster than FlicR1 or FlicR2 (Fig. 2c and Supplementary Table). The probe followed 10 and 50 Hz voltage steps and 50 Hz simulated APs, retaining 89.9% and 61.5% of its 10 Hz sensitivity in the latter protocols, respectively, whereas Ace-mNeon retained 92.3% and 65%, respectively, and FlicR2 retained 77.3% and 29%, respectively (Fig. 2d).
Fig. 2. VARNAM exhibits improved brightness, sensitivity and kinetics for fast AP detection in cultured cells.
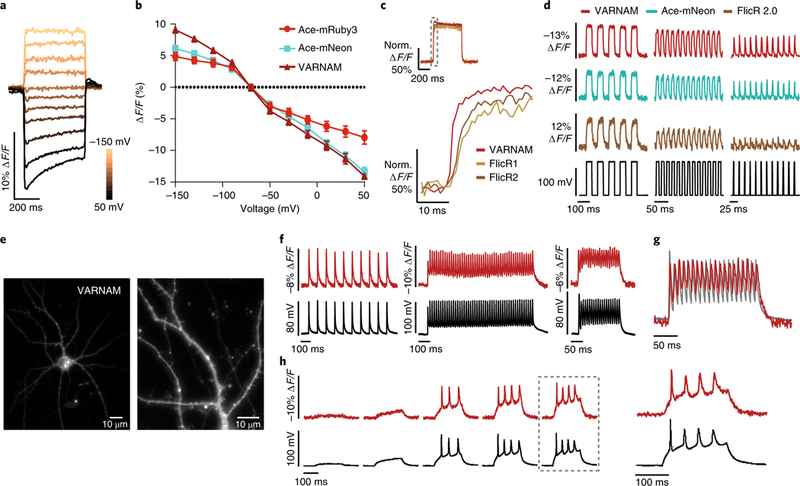
a, Fluorescence responses from a VARNAM-positive HEK cell held at −70 mV to depolarizing and hyperpolarizing voltage steps (∆20 mV). b, ΔF/F versus voltage plots for Ace-mRuby3, VARNAM and Ace-mNeon. n = 10, 14 and 11 cells, respectively. Values represent mean ± s.e.m. c, Normalized fluorescence responses of HEK cells transfected with VARNAM, FlicR1 or FlicR2 during 120 mV depolarization. Dashed gray box represents interval shown below at an expanded time scale below. d, Optical responses of HEK cells expressing VARNAM, Ace-mNeon or FlicR2 to 10 and 50 Hz voltage steps and 50 Hz simulated APs (∆120 mV). The voltage step protocol is shown in black. e, Epifluorescence images of the soma and processes of a cultured cortical neuron expressing VARNAM (n = 12 neurons). f, Single-trial optical (red) and electrical (black) recordings of APs, induced by depolarizing current pulses at 10 Hz (left), 50 Hz (center) and 100 Hz (right), in a VARNAM-positive neuron. g, Overlay of the optical and electrical traces from the 100 Hz protocol in f. h, Simultaneous optical and electrical measurements of spontaneous AP bursts during 200 ms current injections of increasing amplitudes (starting at 30 pA, 5 cycles, ∆50 pA). Dashed box indicates response shown at an expanded time scale to the right.
VARNAM showed superior photostability (time constant = 256 s) compared with Ace-mNeon, ASAP1 and ASAP2, ArcLight and FlicR1 (refs. 8,9,13,17) (Supplementary Fig. 7), likely ascribable to the innate photostability of mRuby3 (ref. 26).
In primary cortical neurons, VARNAM was mostly membrane-localized with some intracellular aggregation (Fig. 2e). Optical responses to current-induced APs had a mean spike amplitude of 8.4 ± 0.3% ∆F/F (mean ± s.e.m.; SNR = 36; n = 8 neurons). VARNAM reported APs at 100 Hz, plateau potentials and spontaneous bursts (Fig. 2f–h), without perturbing AP duration or amplitude (Supplementary Fig. 8).
VARNAM reports APs and postsynaptic potentials in acute slices.
We co-electroporated embryonic day 15 (E15) pups in utero with pan-neuronal expression plasmids encoding VARNAM and eGFP for longitudinal expression in intact tissue (Supplementary Fig. 4a). In fixed postnatal brain slices, VARNAM was brightly expressed at the membrane of superficial pyramidal neurons. Intracellular aggregates were minimal (Fig. 3a and Supplementary Fig. 9a). In acute slices, VARNAM resolved current-induced APs and ~113 Hz spontaneous bursts with a sensitivity comparable to that of Ace-mNeon (∆F/F per spike of −4.8 ± 0.3% (mean ± s.e.m.), SNR = 12, n = 7 neurons and −4.3 ± 0.04%, SNR = 15, n = 6 neurons, respectively) and reported spontaneous APs with −2.0 ± 0.02% ∆F/F per spike (Fig. 3b–e and Supplementary Figs. 4c and 9b,c). Passive properties were unaltered by indicator expression (Supplementary Fig. 8). Further, VARNAM-positive neurons exhibited negligible steady-state photocurrents under 565 nm, as well as 505 or 455 nm light used in multispectral imaging (Supplementary Fig. 10). While wildtype Ace carries a conserved aspartic acid at position 81, which is speculated to partake in proton transfer, substitutions obviate H+-pumping activity22,27.
Fig. 3. VARNAM resolves fast APs and postsynaptic potentials in acute slices.
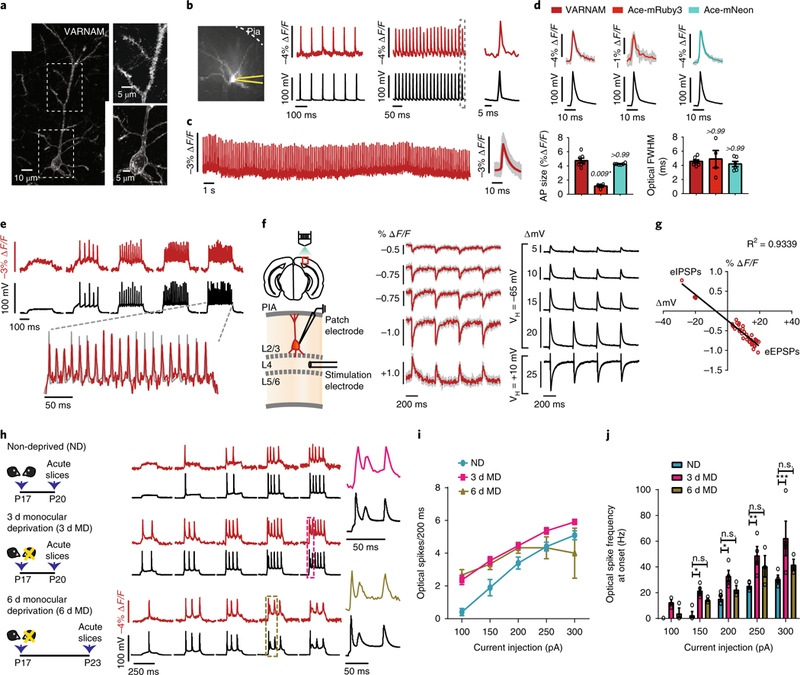
a, Left, confocal image of VARNAM-electroporated pyramidal neuron in fixed slice (n = 27 neurons). Right, magnified views of soma and apical dendrite. b, Left, 80 × 80 pixel image of VARNAM-expressing neuron in acute slice. Recording pipette is in yellow. Right, single-trial optical (red) and electrical (black) APs elicited by 10 and 50 Hz current injections. Dotted box denotes response expanded to the right. c, Left, optical recordings during 30 s spontaneous activity. Right, mean optical waveform (red) (n = 131 spikes). Shading denotes all spikes combined. d, Top, mean optical and electrical AP waveforms from VARNAM (left), Ace-mRuby3 (center) and Ace-mNeon-recordings (right). Shading denotes all spikes combined. Bottom, mean amplitude (left) and FWHM (right) of waveforms shown above. n = 7, 4 and 6 neurons from 4, 3 and 3 mice, respectively. P values are italicized. Statistical comparisons were made to VARNAM. Asterisk denotes significance (Kruskal−Wallis test with Dunn’s correction). e, Fluorescence responses to increasing amplitudes of current injections (starting at 200 pA, 5 cycles, ∆50 pA). Dashed lines correspond to trial shown at an expanded timescale. f, Left, Schematic of ePSP measurements. Right, Optical and electrical recordings of eEPSPs and eIPSPs. Optical traces are 10 trial averages. Shading denotes s.e.m. VH, holding potential; ∆mV, PSP amplitude; L, layer. g, Peak fluorescence responses plotted against PSP amplitude. Red dots represent individual peaks that exhibit a linear fit (n = 36 PSPs, 6 neurons). h, Left, Monocular deprivation protocol; right, fluorescence responses to current injection steps. Color-coded boxes enclose responses expanded to the right. i,j, Optical spike rate (i) and spike frequency at onset (j) as a function of current injection amplitude (n = 4 neurons per condition). *P < 0.05, **P < 0.005, ***P < 0.001; n.s., not significant (two-way ANOVA with Bonferroni’s test). Values in d,i,j, represent mean ± s.e.m.
We next measured fluorescence responses to evoked excitatory and inhibitory postsynaptic potentials (eEPSPs and eIPSPs, respectively) in layer 2/3 VARNAM-positive neurons following electrical stimulation of layer 4 afferents. VARNAM resolved eEPSPs with ∆F/F of −0.38 ± 0.03% (mean ± s.e.m.) for an average voltage deflection of 5.26 mV, −0.55 ± 0.05% for 10.18 mV, −0.79 ± 0.04% for 14.86 mV and −0.83 ± 0.04% for 17.97 mV, and eIPSPs with 0.45 ± 0.1% ∆F/F for 22 mV (n = 6 neurons) (Fig. 3f,g).
We further sought to optically recapitulate changes in neuronal excitability using adolescent monocular deprivation as a model for homeostatic plasticity28–30. In our recordings of excitability from visually deprived mice and controls, the optical traces mirrored the electrical recordings. Consistent with previous studies28,30, 3 d deprivation was associated with a significant increase in spike rate and frequency at onset, whereas 6 d deprivation partially reinstated excitability to control levels (Fig. 3h–j).
All-optical and dual-color imaging in acute slices.
Next, we co-electroporated plasmids encoding VARNAM and the blue-shifted channelrhodopsin CheRiff18 for all-optical electrophysiology. We titrated their concentration for sparse co-expression to minimize wide-field activation of synaptic partners (Fig. 4a). We activated CheRiff-positive neurons, identified by EGFP fluorescence, by brief light pulses from a 455 nm light-emitting diode (LED) (Supplementary Fig. 11a,b). In co-labeled neurons, VARNAM reported light-evoked APs in single trials with −3.9 ± 0.13% ∆F/F (mean ± s.e.m.; n = 3 neurons) per spike. Spike failures were coincidental in the optical and electrical recordings (Fig. 4b,c). Neurons expressing only VARNAM were unresponsive to blue light stimulation. In some instances, we observed a positive blip of ~0.1% ∆F/F in our optical recordings, which coincided with blue light onset and likely arose from tissue autofluorescence31 (Fig. 4c and Supplementary Fig. 11c). Increasing the amplitude and duration of light pulses elicited spontaneous bursts, which were readily discernible optically and, in background-subtracted traces18,31, reliably corresponded to electrical APs (Fig. 4d).
Fig. 4. All-optical electrophysiology in acute slices.
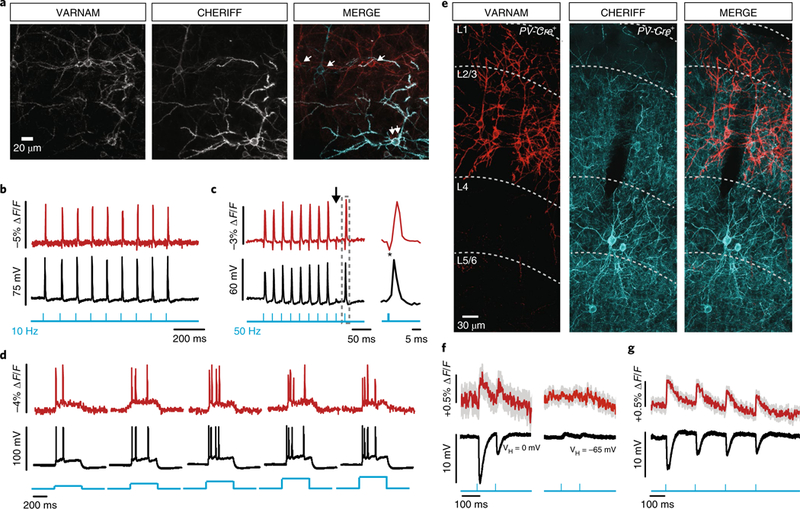
a, Confocal images of a slice co-electroporated with CheRiff and VARNAM (n = 5 fields of view). Single and double arrows in the merged image indicate neurons expressing one or both constructs, respectively. b,c, Optical and electrical spikes induced by 10 Hz (b) and 50 Hz (c) blue-light pulses (vertical blue lines) (0.5 ms, 0.5–1 mW mm−2). Arrow in c indicates spike failure. Gray box indicates interval shown at an expanded time scale. *Blue-light artifact (1 mW mm−2). d, Fluorescence responses to 400 ms blue-light illumination (blue steps) at increasing intensities (0.4–2.4 mW mm−2). e, Confocal images of a fixed slice from PV-Cre+ mouse showing cell-type-specific VARNAM and CheRiff expression (n = 7 fields-of-view). f,g, Mean optical and electrical IPSPs evoked by (f) blue-light pulses (2.5 mW mm−2) at depolarized (left) and resting potentials (right) and (g) longer trains of pulses at depolarized potentials. n = 15 trials, each. Shading denotes s.e.m.
The 561 nm light (15 mW mm−2) itself produced a sustained inward current of 35.21 ± 6.4 pA (mean ± s.e.m.; n = 5 neurons) (6.4 ± 0.9 mV) in CheRiff-positive neurons. This depolarization, however, had little effect on neuronal excitability (Supplementary Fig. 11d–g) and is half of that reported for FlicR1, which is also excited at 561 nm but using 100 mW mm−2 (ref. 17).
We next tested VARNAM in proof-of-concept cell-type-specific all-optical experiments. We electroporated embryos carried by transgenic females, expressing Cre recombinase in parvalbumin interneurons (PV-Cre+/+), with VARNAM plasmid to label superficial pyramidal neurons and postnatally injected the pups with a floxed adeno-associated virus (AAV) encoding CheRiff-EGFP to target layer 4 PV interneurons (Fig. 4e).
In all-optical slice recordings, paired pulses of blue light generated ~10 mV IPSPs in VARNAM-positive neurons held at depolarized membrane potentials and produced ~0.5% ∆F/F. We did not observe IPSPs or optical signals at rest. Longer trains of light pulses reliably evoked electrical and optical IPSPs with closely matched amplitude and waveform (Fig. 4f,g). Presynaptic release and IPSP amplitude were unaffected by the imaging laser (Supplementary Fig. 11h).
Lastly, we co-electroporated VARNAM and Ace-mNeon plasmids and performed sequential imaging in the red and green channels with concurrent electrical recordings. In co-expressed neurons, both indicators resolved APs but with slightly different sensitivities (∆F/F of −3.8 ± 0.4% (VARNAM, mean ± s.e.m.) and −2.6 ± 0.2% (Ace-mNeon) (n = 3 neurons); Supplementary Fig. 12).
VARNAM reports transmembrane voltage dynamics in freely behaving mice.
We evaluated the ability of VARNAM to track cell-type specific oscillatory dynamics in freely behaving mice using the fiber-optic technique TEMPO32 (Supplementary Fig. 13a). Mice injected with AAV2/5-CaMK2a-VARNAM in the somatosensory cortex were anesthetized using ketamine-xylazine (KX), which induces low-frequency oscillations in pyramidal cells33. We performed TEMPO along with EEG and LFP recordings and observed close correspondence between optical and electrical traces. VARNAM recordings exhibited a significantly reduced normalized integrated signal in the hemodynamic frequency band compared with Ace-mNeon (13.5 ± 1% (mean ± s.e.m.) versus 18 ± 0.5%, n = 3 mice per condition, P = 0.034, two-tailed t-test) (Supplementary Fig. 13b). As expected in anesthetized mice, delta band oscillations (0.5 Hz–4 Hz) arose within the cortex (Supplementary Fig. 13c,d). In time-varying cross-correlograms, we uncovered a slow wave synchrony that appeared a few tens of seconds after KX injection and reached steady-state in about five minutes (Supplementary Fig. 13e). The oscillatory waveform in the TEMPO traces had a consistent temporal offset to the LFP and EEG (Supplementary Fig. 13f), conforming with Ace-mNeon imaging32.
We next examined state changes in a freely behaving mouse expressing VARNAM in hippocampal CA1. During locomotion and rest, TEMPO traces closely aligned with hippocampal LFP in the theta (6 Hz–10 Hz) and delta bands (0.5 Hz–4 Hz), respectively (Fig. 5a,b and Supplementary Fig. 14a,b). We observed similar agreement between TEMPO and EEG recordings in the frontal cortex (Supplementary Fig. 14c,d). Cross-correlograms of TEMPO and LFP recordings revealed alternation of high coherence in one band at a time. The temporal offset between optical and electrical traces remained stable between states (Fig. 5c–f). We observed a similar state transition between TEMPO and frontal EEG (Supplementary Fig. 14e–h). Taken together, our results are consistent with reports showing tight correlation between intra- and extracellular theta rhythm in CA1 pyramidal neurons34 and irregular activity in the hippocampus during rest35.
Fig. 5. VARNAM reveals brain-state-dependent voltage dynamics in freely behaving mice.
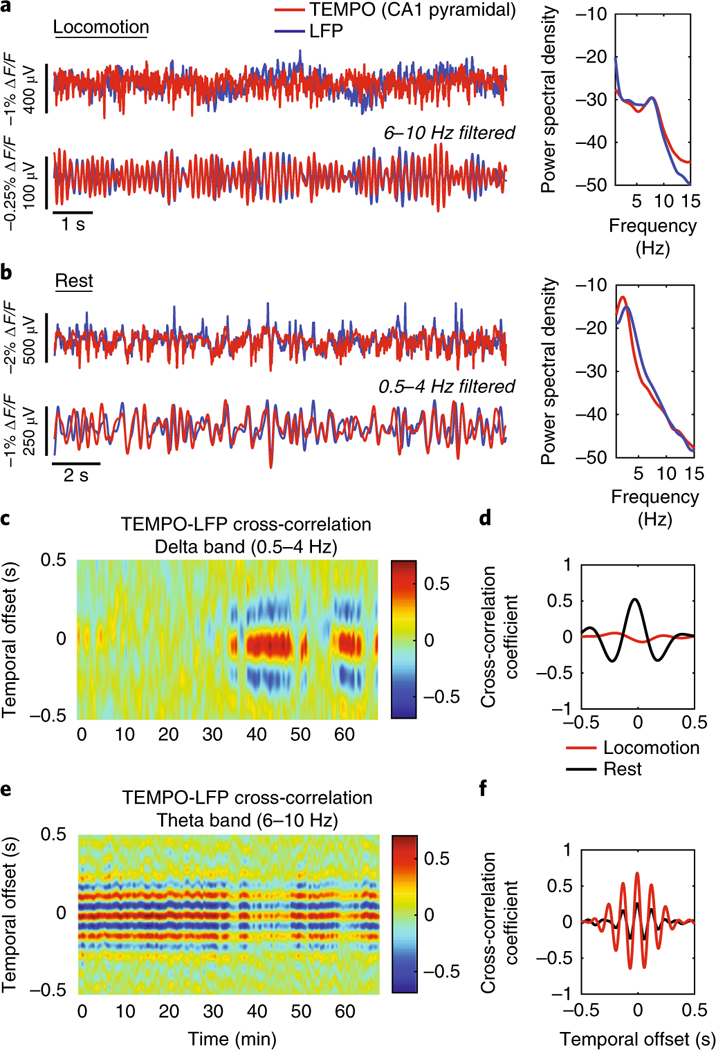
a,b, Left, time traces of TEMPO and LFP during locomotion (a) and rest (b). Traces show closely matched oscillations in both states. Right, normalized power spectral density. Note the prominent theta rhythm (6–10 Hz) during locomotion and delta rhythm (0.5–4 Hz) at rest. c−f, Cross-correlation plots between TEMPO and LFP filtered in the delta band (c) and theta band (e). Two-state behavior is seen with high coherence in the theta band during locomotion (beginning of recording) and delta band at rest (end of recording). d,f, Quantification of the average cross-correlation coefficient in the delta and theta bands, respectively, during locomotion and rest, showing opposite frequency band content.
Odor-evoked and dual-color recordings in Drosophila.
Next, to enable single-neuron labeling in flies, we capitalized on the split-Gal4 system36, to express VARNAM in the dopaminergic PPL1-α′ 2α2 neuron (Fig. 6a,b). We observed spontaneous firing at a spike rate of 6.1 ± 0.3 s−1 (mean ± s.e.m.; n = 6 flies). Spike full width at half maximum (FWHM) and mean amplitude were 3.6 ± 0.1 ms and 0.85 ± 0.05% ΔF/F, respectively (n = 2,213 spikes) (Fig. 6c,d). In the same cell type, Ace-mNeon exhibited a baseline spike rate of 5.2 ± 0.7 s−1, with a spike FWHM of 3.9 ± 0.2 ms and mean amplitude of 1.59 ± 0.06% ΔF/F (n = 1,881 spikes) (Supplementary Fig. 15a,b). Although VARNAM exhibited a lower ΔF/F compared with Ace-mNeon, the spike rates and waveform kinetics were comparable between the indicators. To compute spike detection fidelity d′, we used a signal detection theoretical analysis, previously described for quantitative performance measurements in neural activity imaging10,37. VARNAM exhibited a d′ of ~6.6, which implies a spike detection error rate of ~0.37 s−1 (including false positives and false negatives). The d′ of Ace-mNeon was ~6.9, representing an error rate of ~0.3 s−1.
Fig. 6. odor-evoked and dual-color voltage imaging in live flies.
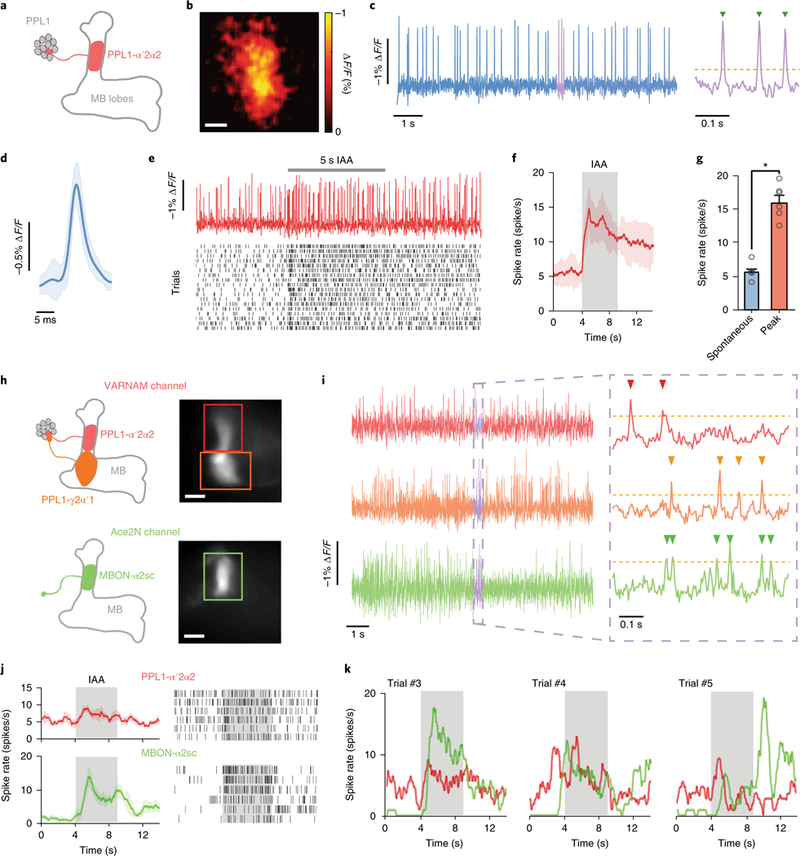
a, Cartoon of PPL1-α′2α2 projection (red) in a MB058B-GAL4>20×UAS-VARNAM fly. The axonal region in the mushroom body (MB) α′2α2 compartment was imaged. b, Spatial map of ΔF/F in the PPL1-α′2α2 axon (n = 6 flies). Scale bar: 10 μm. c, Optical recordings of spontaneous spiking over 10 s (left) and a 0.3 s interval shown at an expanded time scale (right). Yellow dashes indicate spike detection threshold. Green arrowheads denote identified spikes. d, Mean optical waveform of spontaneous spikes (blue trace) in c (n = 188 spikes). Light blue shading denotes s.d. e, Top, example trace of evoked spiking during 5 s presentation of isoamyl-acetate (IAA). Bottom, Raster plots of 18 trials of odor-evoked spiking (n = 6 flies). f, Time-varying mean spike rates in e before and during odor presentation. Red shading denotes s.d. g, Mean spike rates before and during odor presentation (P = 0.03, Wilcoxon two-sided signed-rank test). Error bars represent s.e.m. h, Cartoon depicting projections of PPL1-α′2α2 (red) and PPL1-γ 2α′1 (orange) in the VARNAM channel (upper left) and those of MBON-α2sc neuron (green) in the Ace-mNeon channel (lower left) in the dual-expression line. Right, epifluorescence images in the two channels showing regions-of-interest (boxed), comprising the axonal region of PPL1-α′2α2 (red), PPL1-γ2α′ 1 (orange) and the dendrite of MBON-α2sc (green) (n = 2 flies). Scale bar: 10 μm. i, Simultaneous dual-color recordings of spontaneous spiking in the three neurons over 10 s (left) and a 0.3 s interval shown at expanded time scale (right). Yellow dashes indicate spike detection threshold. Arrowheads denote identified spikes. j, Left, mean spike rates of PPL1-α′2α2 and MBON-α2sc neurons during 5 s IAA presentation. Shading denotes s.e.m. Right, raster plots of 6 trials of odor-evoked spiking from the neurons. k, Time-varying single-trial spike rates in PPL1-α′2α2 and MBON-α2sc neurons in three consecutive trials in j.
During odor presentation, VARNAM reported fast, evoked spike trains in single trial recordings. The peak odor-evoked spike rate was 15.9 ± 1.0 s−1 (mean ± s.e.m.; n = 6 flies), which was significantly greater than the spontaneous rate before odorant delivery (5.5 ± 0.5 s−1, P = 0.03, Wilcoxon two-sided signed-rank test) (Fig. 6e–g and Supplementary Fig. 15c–g).
VARNAM also reported spontaneous activity in PPL1-γ2α′1, MBON-γ1pedc and olfactory local neuron, where we observed spontaneous firing at 8.3 ± 0.4 s−1 (mean ± s.e.m.; n = 6 flies), reminiscent of prior electrophysiological measurements (7.8 ± 2.1 s−1)38 and Ace-mNeon voltage imaging (7.4 ± 2.8 s−1)10 (Supplementary Fig. 15h–m).
Finally, we applied VARNAM in proof-of-concept dual-color in vivo imaging. We expressed VARNAM in dopaminergic PPL1-α′ 2α2 and PPL1-γ2α′1 neurons and Ace-mNeon in a MBON-α2sc neuron. The axon of the PPL1-α′2α2 neuron and the dendrite of the MBON-α2sc neuron innervate the same compartment in mushroom body lobes (Fig. 6h). Simultaneous recordings of spontaneous firing in the three neurons revealed that spike incidence was desynchronized, thus indicating minimal crosstalk between the VARNAM and Ace-mNeon channels (Fig. 6i). We next imaged odor-evoked activity in synaptically connected PPL1-α′2α2 and MBON-α2sc. The mean spike rate of the neurons exhibited a synchronized increase during odor presentation, although spiking remained desynchronized in the single trials (Fig. 6j,k).
As our dual-color setup required a beam-splitter and additional lenses, which affected overall photon efficiency, we observed lower spike detection fidelities in these experiments compared with those in single-color recordings (d′ = 4.8 for VARNAM and 5.4 for Ace-mNeon).
Discussion
Engineering red fluorescent indicators is challenging. Red fluorescent proteins are not only structurally distinct from GFPs, introducing unique problems in structure-guided evolution of fusion proteins, but are also notorious for folding poorly10,17 and exhibit inferior photophysical properties. Prototypical red calcium indicators arrived tardily and performed worse than contemporary GFP-based indicators31,39–43. Likewise, current red-shifted GEVIs are slow and exhibit intracellular aggregates and poor voltage sensitivities17,25,44 or are too dim and require high illumination intensities18–20.
Past hierarchical voltage engineering efforts have focused heavily on brightness-selection followed by low-throughput voltage screening of a fraction of the brightest variants17,19,25. Brightness-selection does not guarantee enhanced voltage performance but may enrich for voltage-insensitive mutations. For instance, Arch variants with large improvements in brightness show decreased voltage sensitivities and vice versa19. Hitherto, platform-based voltage testing has been low content and non-quantitative, warranting patch-clamp validation. Our one-stop screening protocol tests 100% of variants for voltage sensitivity on a semi-automated, high-throughput platform, while still monitoring for brightness and localization. The use of a single electrode, which permits voltage recordings in multiple fields-of-view per well, improves content and consistency of stimulus delivery across samples, yielding voltage responses comparable to those of patch-clamp. The intermediates are iteratively fed into the screening process without additional validation.
Imageable under low light intensities, VARNAM, based on the brightest and highly photostable non-synthetic red fluorescent protein26, enables voltage recordings in a variety of systems, including nontransparent animals. The probe can be combined with optogenetic actuators with minimal crosstalk and GFP-based indicators under routine imaging conditions.
With rapid response kinetics, VARNAM finds applications in spike-timing estimations, studies of fast-spiking cell types and as a diagnostic tool for epilepsy. VARNAM may be useful for investigating temporal aspects of voltage dynamics in neuronal ensembles together with fast green indicators. Further, its increased response to hyperpolarization makes the sensor conducive to studying the role of inhibition in sensory processing downstream of GABAergic neurons45.
It remains unclear, however, whether opsin-based GEVIs are suitable for two-photon microscopy7. While background can be minimized by genetic targeting, TEMPO may represent a useful modality for tracking oscillatory dynamics in identified cell populations. Here, multispectral imaging might be achieved by recruiting near-infrared fluorophores to the reference channel. Nevertheless, with high-throughput approaches, it might be possible to generate photocycle mutants of opsin-GEVIs and select for increased compatibility with multiphoton modalities46.
Methods
Plasmids.
The expression plasmid for HEK cells consisted of modified pCAGGS with a simian CMV IE94 promoter inserted between de novo ApaI and KpnI sites. ArcLight6 (Addgene #36856) and FlicR1 (ref. 17) (Addgene #74142) were cloned between the KpnI site and de novo NheI site, upstream of the rabbit globin poly-A terminator. The Ace-mNeon-TS/ER construct10 was synthesized (GenScript Corporation, NJ), and cloned in between the KpnI and NheI sites. To clone CMV-Ace-mRuby3, the mRuby3 gene26 (Addgene #74252) was inserted in place of the FP in CMV-Ace-mNeon. A NLS-tagged mCherry (ArcLight and Ace-mNeon), BFP (FlicR) or mCerulean (Ace-mRuby3) sequence, to label transfected cells, was introduced at the C terminus, punctuated by a T2A peptide. CMV-Ace-mCitrine, CMV-Ace-SEP227D and CMV-Ace-mCardinal2 were cloned by inserting the fluorophore sequences from mCitrine-N1 (Addgene #54594), ArcLight and pCNS-mCardinal2 (Addgene #52631), respectively. pAAV-hSyn-Ace-mNeon, pAAV-hSyn-Ace-mRuby3 and pAAV-hSyn-VARNAM constructs were cloned by inserting the respective indicator sequences between BamHI and EcoRI sites of pAAV-Syn-EGFP (Addgene #50465). pAAV-Syn-CheRiff-EGFP plasmid was obtained from (Addgene #51697). pAAV-DIO-EF1α-CheRiff-EGFP was cloned by replacing the ChR2-mCherry cassette in pAAV-DIO-EF1α-ChR2 (H134R)-mCherry (Addgene #20297) with CheRiff-EGFP.
Maintenance and transfection of HEK cells.
HEK293 cells (ATCC CRL-1573) were maintained in high-glucose DMEM/10% FBS. Cells were plated on 12 mm coverslips ~24 h before transfection. HEK293 cells served solely as a system for expression and characterization of voltage indicators rather than the subject of investigation.
Cells were transfected with plasmid DNA (0.5 µg/12 mm coverslip) using Lipofectamine (ThermoFisher) and imaged 1–2 d post-transfection.
Primary neuronal cultures.
Animal experiments were performed according to the guidelines of the National Institutes of Health and approved by The John B. Pierce Laboratory Animal Care and Use Committee.
Cortical neurons were isolated at embryonic day 16 (E16) from pregnant CD-1 dams using published procedures47. Neurons were plated at a density of 150,000– 200,000 cells/12 mm coverslip in Neurobasal media supplemented with 10% FBS, 2% B27 and 0.5 mM L-glutamine. 12–24 h post-plating, the plating medium was replaced with serum-free media. Neurons were transfected using Lipofectamine at 3 d in vitro (DIV 3) and imaged between DIV 7 and DIV 10.
In utero electroporation.
An E15 timed-pregnancy C57BL/6, CD-1 or PV-Cre+ dam was anesthetized using 5% isoflurane/2 L/min oxygen for 3 min and maintained under 2% isoflurane/0.6 L/min oxygen. The uterus containing the embryos was exposed and warmed periodically with sterile saline. 1 µl of DNA mixture, containing ~1.5 µg plasmid DNA (GEVI + reference fluorophore) and 0.005% Fast Green FCF dye, was injected into the lateral ventricle of each embryo using a ~30-µm-diameter pipette. To target the primary visual cortex (V1), the positive electrode was placed posterior to the injected hemisphere, and the negative electrode was placed near the snout. Brief electrical pulses (5 × 50 ms/45– 50 V) were delivered using a BTX-Harvard Apparatus ECM 830 Square Wave electroporator. After electroporation, the uterus was returned to the abdomen, and the abdominal wall and skin were sutured shut.
Intracranial injections in electroporated PV-Cre mice.
We generated a recombinant AAV encoding floxed CheRiff-EGFP (AAV/DJ-DIO-EF1α-CheRiff-EGFP) using the AAV-DJ Helper Free Packaging System (Cell Biolabs, Inc), following pre-established procedures48. Mice were used without regard to sex. Intracranial injections were performed aseptically at P16−17 to a depth of ~400–450 µm. Injected mice were sacrificed between postnatal day (P) P28 and P32 for slice physiology.
Histology and confocal imaging.
Electroporated mice were transcardially perfused with ice-cold PBS then 4% paraformaldehyde. The brains were post-fixed for up to 3 h at 4 °C. 40–60 µm cortical slices were prepared on a vibratome (Leica) and mounted on glass microscope slides using ProlongGold (Invitrogen). Confocal images were obtained using Zeiss LSM 710 under 63× oil immersion objective.
Monocular deprivation.
Electroporated mice were visually deprived in the contralateral eye at P17 and maintained until P20 (3 d) or P23 (6 d), as described previously29.
Acute brain slice preparation.
Under isoflurane anesthesia, electroporated mice (P18–P30) were transcardially perfused with ice-cold choline-artificial cerebrospinal fluid (choline-ACSF) containing 110 mM choline, 25 mM NaHCO3, 1.25 mM NaH2PO4, 2.5 mM KCl, 7 mM MgCl2, 0.5 mM CaCl2, 20 mM glucose, 11.6 mM sodium ascorbate, 3.1 mM sodium pyruvate. The mice were decapitated, and acute visual cortical slices (300 μm) were prepared using a vibratome (Leica) and transferred to ACSF containing 127 mM NaCl, 25 mM NaHCO3, 1.25 mM NaH2PO4, 2.5 mM KCl, 1 mM MgCl2, 2 mM CaCl2, and 20 mM glucose, bubbled with 95% O2 and 5% CO2. Slices were incubated for 1 h at 32 °C, and then maintained at room temperature.
Electrophysiology in HEK cells and primary neurons.
Whole-cell patch-clamp recordings were performed between 22 and 25 °C. The bath solution contained 125 mM NaCl, 2 mM KCl, 10 mM HEPES, 30 mM glucose, 3 mM CaCl2 and 1 mM MgCl2 (~310 mOsm L−1, pH 7.3). The intracellular solution for HEK cells consisted of 125 mM K-gluconate, 8 mM NaCl, 0.6 mM MgCl2, 0.1 mM CaCl2, 1 mM EGTA, 4 mM Mg2-ATP, 0.4 mM Na-GTP and 10 mM HEPES. The intracellular solution for primary neurons contained 129 mM K-gluconate, 10 mM KCl, 10 mM HEPES and 4 mM Na2-ATP (290 mOsm L−1, pH 7.2). Patch pipettes had tip resistances of 4–5 MΩ, yielding series resistances of < 20 MΩ.
Electrical recordings were performed using a MultiClamp amplifier controlled by pClamp10 software. In the voltage clamp mode (HEK cells), voltage steps in increments of 20 mV/ 0.5 s were applied to depolarize or hyperpolarize the membrane potential from resting (−70 mV). In the current clamp mode (neurons), current pulses (0.5–1 nA/ 2 ms or 100–250 pA/ 200 ms) were applied to elicit APs.
Electrophysiology in acute brain slices.
Electroporated neurons were identified based on EGFP expression, and healthy neurons were patch-clamped for whole-cell recordings under continuous superfusion with carbogenated ACSF. Pulled borosilicate patch pipettes (2–4 MΩ tip resistance) were filled with internal solution containing: 129 mM K-gluconate, 10 mM KCl, 10 mM HEPES, 4 mM Na2-ATP (290 mOsm L−1, pH 7.2). Series resistances were 10–25 MΩ. Current pulses (0.5–1 nA/2 ms or 100–250 pA/ 200 ms) were applied to elicit APs. For measurements of spontaneous activity (Fig. 3c), modified ACSF containing 3.5 mM KCl, 0.5 mM MgCl2 and 1 mM CaCl2 was used49. In Fig. 3f–g, subthreshold synaptic responses were obtained by extracellular stimulation in layer 4 using a bipolar tungsten electrode (Warner Instruments). A train of pulses (0.1–3 mA/ 0.5–2 ms) was applied using an A385 stimulus isolator (World Precision Instruments) to evoke monosynaptic responses. The interstimulus and intertrial intervals were 400 ms and 30 s, respectively. The ACSF composition for electrical and optical stimulation experiments was adjusted to 2 mM CaCl2 and 2 mM MgCl2. A depolarizing current was applied via Multiclamp to hold the cells at + 10 mV for inhibitory responses. Synaptic blockers (10 µM CPP, 10 µM NBQX, 20 µM gabazine) were added to measurements of intrinsic excitability (Fig. 3h–j and Supplementary Fig. 8f and 11g).
Fluorescence recordings in cultured cells and acute brain slices.
Optical recordings were obtained using an Olympus upright microscope. Cells were visualized under a 0.8 NA 40× or 1.0 NA 60× water-immersion objective lens using differential interference contrast or epifluorescence. For ArcLight and Ace-SEP227D, we used a 488 nm laser (CrystaLaser) and a GFP filter set (472/30 nm excitation filter, 495 nm dichroic mirror and 520/35 nm emission filter) (Semrock). Ace-mNeon and Ace-mCitrine were illuminated using a 505 nm light emitting diode (LED) (Thorlabs) and a filter set comprising 509/22 nm excitation filter, 526 nm dichroic mirror and 544/24 nm emission filter (Semrock). The light source for Ace-mRuby3 and VARNAM was a 561 nm laser (CrystaLaser) or a 565 nm LED (Thorlabs). FlicR1 and FlicR2 were imaged using the 561 nm laser. Both red probes required a TRITC filter set (560/40 nm excitation filter, 585 nm dichroic mirror and 630/75 nm emission filter) (Semrock). Ace-mCardinal2 was illuminated using a 638 nm laser (CrystaLaser) and a filter set consisting of 620/60 nm excitation filter, 650 nm dichroic mirror and 700/75 nm emission filter (Semrock). The illumination intensity at the sample plane was 15–20 mW mm−2, except for FlicR1 and FlicR2 (50 mW mm−2) and Ace-mCardinal2 (40 mW mm−2). For VARNAM imaging using the 561 nm laser, we introduced a round variable neutral density filter (Thorlabs) to reduce the power to ~15 mW mm−2.
Fluorescence time series images (400 Hz–5 kHz) were acquired using a NeuroCCD camera, controlled using the NeuroPlex software (RedShirtImaging, GA) or an ORCA Flash4.0 sCMOS camera (Fig. 3c), controlled using a custom-written software in LabView.
All-optical electrophysiology.
In Fig. 4, blue light pulses from a 455 nm LED were combined with continuous illumination from a 561 nm laser using a 485 LP dichroic mirror to simultaneously activate and record from neurons expressing both VARNAM and CheRiff-EGFP. 0.5–2 ms blue light pulses (up to 2 mW mm−2) evoked APs. Individual trials were ~15 s apart. Longer pulses (400 ms) of increasing light intensity (0.4–2.4 mW mm−2) evoked AP bursts (Fig. 4d). Inhibitory potentials in Fig. 4f,g were isolated by injecting depolarizing current via the patch pipette.
Image analysis and statistics.
Data analyses were performed in MATLAB. For ∆F/F computations, we extracted the fluorescence response traces from the time-series images and ranked each pixel by its SNR, where the noise was determined as the root mean square of baseline fluorescence fluctuation. The mean ∆F/F of pixels with the top 25% SNRs was computed to derive the average time-dependent fluorescence response for a given cell. For extracting fluorescence responses from subcellular compartments, we derived the ∆F/F from all pixels within a select ROI, representing the soma or process, without pixel ranking. All fluorescence response traces were baseline-corrected by fitting a double exponential function to account for photobleaching.
AP peaks were identified using the findpeaks function in MATLAB and then applying a threshold of three times the s.d. (3 s.d.) of baseline fluorescence. The identified peaks were used as a reference to temporally align the waveforms and averaged to obtain the mean fluorescence response and mean AP waveform. Traces acquired from cultures and acute slices are unfiltered, single-trial recordings. Multiple trials were averaged for subthreshold responses in Figs. 3f and 4f,g.
To determine probe kinetics, we fitted the first 50 ms of depolarizing and repolarizing step responses, acquired from HEK cells in voltage clamp, with a double exponential equation as described previously6.
Data were plotted using GraphPad Prism v7.01 and statistical analysis were performed using built-in tests. Nonparametric tests were performed throughout except for the monocular deprivation experiment, where data were expected to be normally distributed. We performed a two-tailed Mann−Whitney U test for comparisons between two groups and a Kruskal−Wallis test followed by Dunn’s multiple comparisons correction for multiple groups. For monocular deprivation, statistical comparisons were made using two-way ANOVA and Bonferroni’s multiple comparisons test. Probabilities of the null hypothesis P < 0.05 were deemed statistically significant.
Fly stocks.
The FlyLight Project Team at Janelia Research Campus kindly provided MB058B-GAL4, MB296B-GAL4 and MB080C-GAL4 split-GAL4 stocks. We obtained R55D11-GAL4 and R82C10-LexA flies from the Bloomington Stock Center.
We raised flies on standard cornmeal agar media under a 12 h light/dark cycle at 25 °C and 50% humidity.
To create 20 × UAS-VARNAM flies, the mCD8::GFP cassette in the plasmid pJFRC7–20XUAS-IVS-mCD8::GFP (Addgene #26220) was replaced with the VARNAM sequence. After verifying the sequence of pJFRC7–20XUAS-IVS-VARNAM plasmid, we inserted it at the phiC31 docking site attP2 or su(Hw)attP5 using a commercial transformation service (BestGene Inc). To create 13 × LexAop-VARNAM flies, we replaced the myr::GFP sequence with the VARNAM gene in pJFRC19–13 × LexAop2-IVS-myr::GFP (Addgene #26224). We then introduced the sequence at the phiC31 docking site attP40 or VK00027.
For dual-color imaging, we combined R82C10-LexA and 13 × LexAop-VARNAM flies to generate the R82C10-LexA13;13 × LexAop-VARNAM line, and MB080C-GAL4 and 20 × UAS-Ace2N-mNeon flies to generate the 20 × UAS-Ace2N-mNeon;MB080C-GAL4 line. We then crossed the fly lines to generate R82C10-LexA/20 × UAS-Ace2N-mNeon;MB080C-GAL4/13 × LexAop-VARNAM flies.
We collected adult female flies (2 d old) after eclosion and raised them on 400 µM all-trans retinal for 6–8 d before surgery. We chose female flies because of their larger brain size, which makes surgery more feasible. No randomization was performed, and sample sizes were chosen based on published empirical measurements to gauge effect magnitudes.
Dissection of live flies.
Flies were mounted on a 0.8 mm × 1.4 mm hole on a plastic holder glued onto an aluminum chamber. The hole’s perimeter was sealed by UV-activated glue (NOA 81, Norland Products Inc). The flies’ antennae were kept underneath the holder for sensing odorants. Fly brain dissection was performed using laser microsurgery50, and voltage imaging was performed in artificial hemolymph containing: 3 mM KCl, 10 mM glucose, 110 mM NaCl, 1 mM NaH2PO4, 1 mM MgCl2 and 2 mM CaCl2.
Odor delivery and voltage-imaging in flies.
A custom-built olfactometer delivered constant airflow (200 ml min−1) to either the control path (mineral oil) or the odor path (odorant dissolved in mineral oil). Three trials of 5% isoamyl-acetate (IAA) were presented through a glass capillary (0.35 mm inner diameter), ~1 mm in front of the fly’s antenna. Odor delivery trials lasted 5 s.
Voltage dynamics were imaged using a custom-built epifluorescence microscope under a 20 × 1.0 NA water-immersion objective (XLUMPlanFL, Olympus). We used a 559/25 nm excitation filter (Semrock), a 580 nm dichroic (Chroma) and a 630/50 nm emission filter (Semrock). The specimen was illuminated using the 550 nm wavelength module of a solid-state light source (Spectra X, Lumencor) at an intensity of 5–7 mW at the specimen plane. Images were acquired at 500 Hz using a scientific-grade camera with 2 × 2 pixel binning.
For dual-color imaging, the microscope was equipped with a dual emission image splitter (TwinCam, CAIRN) to split the two channels onto two scientific-grade CMOS cameras. In the image splitter, we used a 550 nm dichroic mirror (Chroma), a 520/30 nm emission filter (Semrock) and a 641/75 nm emission filter (Semrock). We illuminated the sample using the 480 nm and 550 nm wavelength modules of a solid-state light source (Spectra X, Lumencor) delivering 10–15 mW optical power at the specimen plane.
To analyze the voltage traces, raw videos were corrected for any brain movement using the Turboreg algorithm for image registration (http://bigwww.epfl.ch/thevenaz/turboreg/). Pixels with top 10% mean fluorescence intensity were selected, and their union was defined as the region-of-interest (ROI) over which we computed spatially averaged, time-dependent changes in relative fluorescence intensity ΔF(t)/F0, where F0 was the mean fluorescence in the ROI averaged over the entire video. Responses were corrected for photobleaching by fitting a double exponential function to the mean fluorescence trace F0 and then normalizing F0 by the fitted double exponential trace. To identify individual spikes, the ΔF(t)/F0 trace was high-pass filtered by subtracting a median-filtered (80 ms window) version of the trace. Spikes were identified as local peaks with amplitudes >3 s.d. of the mean baseline fluorescence. The approximate firing rate was determined by sliding a rectangular window along the spike train with Δt = 100 ms. We used matched-filtering to enhance the SNR of the fluorescence traces in Fig. 6c,e,i. Here, we used an average spike template for each neuron’s voltage trace by extracting the voltage signal over a window of ten frames centered around the peaks and averaging across them. We obtained the matched filter outputs by taking the convolution of the original traces with their respective time-reversed spike templates (Supplementary Fig. 15). To analyze spike waveforms, we determined the mean waveform by averaging across all spikes within each trial. We then performed a spline interpolation (10 μs intervals) of the mean waveform, and from that, determined the spike amplitude and FWHM.
To compute spike detection fidelity d′, we used a signal detection framework10,37 that takes into account both the duration and intensity of fluorescence waveforms in optical recordings of action potentials. We estimated the photon shot noise in the optical voltage signal as the s.d. of the fluctuation in baseline fluorescence. We then computed d′ using empirically determined, mean optical spike waveforms (see equations S1–S4 in ref. 37).
Intracranial injections and optical fiber implantation for TEMPO.
All animal procedures were approved by Stanford University APLAC. Thy1-YFP transgenic mice were obtained from Jackson Laboratories. Male mice were used for consistency. Mice were housed under normal light cycle conditions and genotyped using tail clips. We packaged and determined the concentrations of AAV2/5-CaMK2a-VARNAM (6 × 10¹² GC ml−1).
9- to 12-week-old mice underwent two surgical procedures under isoflurane anesthesia (1.5–2% in O2): intracranial injection of the virus and fiber-optic and electrical probe implantation. We followed standard procedures for viral injections (500 nl/animal), craniotomies and optical probe implantation51. The coordinates used for injections and recording were (from Bregma): Somatosensory cortex: –1 mm anterioposterior (AP), +1.5 mm mediolateral (ML), –0.7–0.9 mm dorsoventral (DV); hippocampus: −1.9 mm AP, −1.5 mm ML, −1.2 mm DV.
2–4 weeks after viral injection, mice were implanted with a multimode optical fiber cannula (CFM14L02, Thorlabs; 0.39 NA, 400 μm diameter core). For hippocampal implant, the overlying cortex was aspirated to prevent tissue compression and the fiber was placed ~100 μm dorsal to the viral injection site. The fiber-optic implants were secured to the skull using dental cement (C&B-Metabond, Parkell) and dental acrylic (Hygenic, Coltene). Recordings were obtained ~1–2 weeks after implantation of the optical fiber.
For EEG recordings, we inserted a low impedance thread screw electrode, SS lead wire, Teflon-coated (Neurotek #000–120), into the cranium, above frontal (+1 mm AP, +2–2.5 mm ML, 0 mm DV), parietal (−3 mm AP, +2 mm ML, 0 mm DV) and cerebellar cortices (–6 mm, 0 mm ML, 0 mm DV).
TEMPO instrumentation.
The optical system had two continuous wave laser light sources (488 nm and 561 nm wavelengths; 488–15LS-FP and 561–50LS OBIS Lasers, Coherent). The light from the 561 nm laser was coupled into a single mode fiber (460HP, Thorlabs) using a five-axis translation stage (561D, Newport). The 488 nm laser had its own fiber-optic pigtail provided by the manufacturer. The light exiting each single mode fiber was collimated using an aspheric lens (PAF-X-7-A, Thorlabs). We used 50/50 beamsplitters (CM1-BS013, Thorlabs) to direct 50% of the light from each laser beam to a photodiode (PDA100, Thorlabs) for continuous monitoring of laser power. The other half of the light from the two beams was combined using a dichroic mirror (FF511-Di01, Semrock). The resulting collinear laser beams were reflected off a dual-edge dichroic mirror (FF498/581-Di01, Semrock) and focused onto a multimode fiber-optic patch cord (2 m long, 400 μm diameter core, 0.39 NA; FT400EMT, Thorlabs). Using a ceramic mating sleeve (CFM14L05 and ADAF1, Thorlabs), we connected this patch cord to a fiber optic ferrule, which was implanted in the mouse brain. The total power delivered to the brain was 25–200 μW to maximize the emission signal from the voltage sensor and the reference channel. Fluorescence emissions from the brain passed through a dual-edge dichroic mirror and were split into red and green components using a single-edge dichroic mirror (FF493/574-Di01, FF564-Di01, Semrock). The emissions of each color channel (FF01–537/26, FF01–630/92, Semrock) were filtered and focused onto two variable gain photoreceivers (OE-200-SI, Femto). To gain in sensitivity, we used lock-in amplification techniques. We amplitude-modulated the 488 nm laser at 2.1 kHz (SR810, Stanford Research Systems) and the 561 nm laser at 6.3 kHz (SR850 Stanford Research Systems). This approach removed any crosstalk between the emission bands of the two FPs. Reference signal and voltage signal were demodulated with their respective lock-in. 561 nm laser fluctuation was demodulated using a third lock-in amplifier (SR830, Stanford Research Systems). To read out laser and fluorescence intensities, the three lockins were set up as follows: low-pass filter for demodulation, 3 ms time constant, 24 dB/Octave roll-off. These filter settings limit the measurement bandwidth to ~30 Hz. Because voltage signals fluctuation is weak, the DC-corrected signals were expanded tenfold to benefit from the dynamic range of the lock-in and therefore gain in bit-depth. After lock-in amplification, all signals were digitized at 16-bit resolution and sampled at 2 kHz using a National Instruments card (NI PCIe-6320), well above the Nyquist rate of the experiment.
In vivo electrophysiological recordings using TEMPO.
EEG signals were recorded from a low-impedance thread screw electrode, SS lead wire, Teflon-coated (Neurotek #000–120), implanted in the mouse cranium. LFPs were recorded using a 50 μm diameter tungsten wire coated with polyimide insulation (California Fine Wire). To sample electrophysiological signals at a depth corresponding to the zone of TEMPO’s greatest sensitivity, the LFP wires were positioned 50–150 μm from the tip of the fiber optic ferrule in tissue, the fiber and wires were enclosed inside a 24-gauge (0.559 mm) polyimide tube and secured in place using cyanoacrylate. The EEG and LFP electrodes were grounded to the skull screw over the cerebellar cortex. The signal-bearing wires were soldered to a connector board (EIB8, Neuralynx) using manufacturer gold pin and the signals pre-amplified using a head stage (HS-8, Neuralynx). The electrophysiological signals were amplified using an acquisition board (ERP-27, Neuralynx) and an eight channels analog amplifier (Lynx-8, Neuralynx). We applied a digital bandpass filter to the data using a second-order Butterworth filter; the filter’s high-frequency 3 dB cutoff frequency was 50 Hz and the low-frequency 3 dB cutoff, 0.1–1 Hz.
Recording sessions and analysis of TEMPO recordings.
All optical recordings were performed during the mouse’s light cycle. KX anesthesia was dissolved in PBS (10 mg/ml ketamine; 1 mg/ml xylazine) and injected peritoneally at 100 mg/kg and 10 mg/kg, respectively. Recordings began just after anesthesia administration to optically track the appearance of the up- and down-state activity in the EEG recordings. The experiments involving rest and locomotion were performed in a circular arena (31 cm diameter, 31 cm height) with clear acrylic walls and a stainless-steel floor. Video recordings were used to distinguish between behavioral states of locomotion and rest. The spectrograms and one-sided power spectral densities of optical and electrophysiological data were calculated using Welch’s method to reduce windowing artifacts. Coherence and cross-correlation were assessed using built-in MATLAB functions. Filtering and data analysis were performed using custom software written in MATLAB. All traces were filtered using a zero-phase sixth-order bandpass Butterworth filter (delta rhythm: 1–5 Hz; theta rhythm: 5–10 Hz). The voltage trace, laser fluctuations and hemodynamic artifacts were unmixed using linear regression. To quantify hemodynamic artifact, we injected three mice each with an identical volume of VARNAM or Ace-mNeon AAV in the cortex. The recordings were performed under identical conditions. The integrated signal was computed in a 1–50 Hz filtered trace and normalized to 100%. The fraction of normalized integrated signal was assessed in delta (1–4 Hz), theta (6–10 Hz), hemo (11–14 Hz), gamma (25–50 Hz) bands.
Reporting Summary.
Further information on research design is available in the Nature Research Reporting Summary linked to this article.
Supplementary Material
Acknowledgements
The authors thank J. Cardin (Yale University) for the PV-Cre mouse line. We thank X. Liu and D. Berman from the Pieribone laboratory for technical assistance with molecular biology, P. O’Brien for assistance with optical instrumentation for in vitro imaging and all other members for extended support during the study. We thank T. Kim from the Schnitzer laboratory for help with two-photon imaging of fly brains. We are grateful to M. Higley for valuable comments during the preparation of the manuscript. We thank the John B. Pierce Laboratory machine shop for technical support during development of the voltage screening platform. This study was supported by NIH grants U01 NS103517 and U01 NS090565 awarded to V.A.P.
Footnotes
Online content
Any methods, additional references, Nature Research reporting summaries, source data, statements of data availability and associated accession codes are available at https://doi.org/10.1038/s41592-018-0188-7.
Competing interests
The authors declare no competing interests.
Publisher’s note: Springer Nature remains neutral with regard to jurisdictional claims in published maps and institutional affiliations.
Code availability. Custom software written in LabView for high-throughput data acquisition can be obtained from the authors upon request. Custom-written software for high-throughput data analysis can be found at https://www.dropbox.com/sh/ain2bjn9whtp5bz/AACvcTAaE-ivaUAHF9YFXTyaa?dl=0.
Data availability
The DNA sequence for VARNAM is available in GenBank under submission number MH763646. CMV-VARNAM (#115552) and pAAV-Syn-VARNAM (#115554) will be available from Addgene once the paper is published. Fly stocks and viruses will be provided by the authors upon reasonable request.
Supplementary information is available for this paper at https://doi.org/10.1038/s41592-018-0188-7.
References
- 1.Yang HH & St-Pierre F Genetically encoded voltage indicators: opportunities and challenges. J. Neurosci 36, 9977–9989 (2016). [DOI] [PMC free article] [PubMed] [Google Scholar]
- 2.Lin MZ & Schnitzer MJ Genetically encoded indicators of neuronal activity. Nat. Neurosci 19, 1142–1153 (2016). [DOI] [PMC free article] [PubMed] [Google Scholar]
- 3.Kwon T, Sakamoto M, Peterka DS & Yuste R Attenuation of synaptic potentials in dendritic spines. Cell Rep 20, 1100–1110 (2017). [DOI] [PMC free article] [PubMed] [Google Scholar]
- 4.Storace DA, Braubach OR, Jin L, Cohen LB & Sung U Monitoring brain activity with protein voltage and calcium sensors. Sci. Rep 5, 10212 (2015). [DOI] [PMC free article] [PubMed] [Google Scholar]
- 5.Cao G et al. Genetically targeted optical electrophysiology in intact neural circuits. Cell 154, 904–913 (2013). [DOI] [PMC free article] [PubMed] [Google Scholar]
- 6.Jin L et al. Single action potentials and subthreshold electrical events imaged in neurons with a fluorescent protein voltage probe. Neuron 75, 779–785 (2012). [DOI] [PMC free article] [PubMed] [Google Scholar]
- 7.Chamberland S et al. Fast two-photon imaging of subcellular voltage dynamics in neuronal tissue with genetically encoded indicators. eLife 6, e25690 (2017). [DOI] [PMC free article] [PubMed] [Google Scholar]
- 8.Yang HH et al. Subcellular imaging of voltage and calcium signals reveals neural processing in vivo. Cell 166, 245–257 (2016). [DOI] [PMC free article] [PubMed] [Google Scholar]
- 9.St-Pierre F et al. High-fidelity optical reporting of neuronal electrical activity with an ultrafast fluorescent voltage sensor. Nat. Neurosci 17, 884–889 (2014). [DOI] [PMC free article] [PubMed] [Google Scholar]
- 10.Gong Y et al. High-speed recording of neural spikes in awake mice and flies with a fluorescent voltage sensor. Science 350, 1361–1366 (2015). [DOI] [PMC free article] [PubMed] [Google Scholar]
- 11.Akemann W et al. Imaging neural circuit dynamics with a voltage-sensitive fluorescent protein. J. Neurophysiol 108, 2323–2337 (2012). [DOI] [PubMed] [Google Scholar]
- 12.Piao HH, Rajakumar D, Kang BE, Kim EH & Baker BJ Combinatorial mutagenesis of the voltage-sensing domain enables the optical resolution of action potentials firing at 60 Hz by a genetically encoded fluorescent sensor of membrane potential. J. Neurosci 35, 372–385 (2015). [DOI] [PMC free article] [PubMed] [Google Scholar]
- 13.Platisa J, Vasan G, Yang A & Pieribone VA Directed evolution of key residues in fluorescent protein inverses the polarity of voltage sensitivity in the genetically encoded indicator ArcLight. ACS Chem. Neurosci 8, 513–523 (2017). [DOI] [PMC free article] [PubMed] [Google Scholar]
- 14.Forli A et al. Two-photon bidirectional control and imaging of neuronal excitability with high spatial resolution in vivo. Cell Rep 22, 3087–3098 (2018). [DOI] [PMC free article] [PubMed] [Google Scholar]
- 15.Klapoetke NC et al. Independent optical excitation of distinct neural populations. Nat. Methods 11, 338–346 (2014). [DOI] [PMC free article] [PubMed] [Google Scholar]
- 16.Venkatachalam V & Cohen AE Imaging GFP-based reporters in neurons with multiwavelength optogenetic control. Biophys. J 107, 1554–1563 (2014). [DOI] [PMC free article] [PubMed] [Google Scholar]
- 17.Abdelfattah AS et al. A bright and fast red fluorescent protein voltage indicator that reports neuronal activity in organotypic brain slices. J. Neurosci 36, 2458–2472 (2016). [DOI] [PMC free article] [PubMed] [Google Scholar]
- 18.Hochbaum DR et al. All-optical electrophysiology in mammalian neurons using engineered microbial rhodopsins. Nat. Methods 11, 825–833 (2014). [DOI] [PMC free article] [PubMed] [Google Scholar]
- 19.Piatkevich KD et al. A robotic multidimensional directed evolution approach applied to fluorescent voltage reporters. Nat. Chem. Biol 14, 352–360 (2018). [DOI] [PMC free article] [PubMed] [Google Scholar]
- 20.Flytzanis NC et al. Archaerhodopsin variants with enhanced voltage-sensitive fluorescence in mammalian and Caenorhabditis elegans neurons. Nat. Commun 5, 4894 (2014). [DOI] [PMC free article] [PubMed] [Google Scholar]
- 21.Waters JC Accuracy and precision in quantitative fluorescence microscopy. J. Cell. Biol 185, 1135–1148 (2009). [DOI] [PMC free article] [PubMed] [Google Scholar]
- 22.Engqvist MK et al. Directed evolution of Gloeobacter violaceus rhodopsin spectral properties. J. Mol. Biol 427, 205–220 (2015). [DOI] [PubMed] [Google Scholar]
- 23.Greenhalgh DA, Farrens DL, Subramaniam S & Khorana HG Hydrophobic amino acids in the retinal-binding pocket of bacteriorhodopsin. J. Biol. Chem 268, 20305–20311 (1993). [PubMed] [Google Scholar]
- 24.Russell TS, Coleman M, Rath P, Nilsson A & Rothschild KJ Threonine-89 participates in the active site of bacteriorhodopsin: evidence for a role in color regulation and Schiff base proton transfer. Biochemistry 36, 7490–7497 (1997). [DOI] [PubMed] [Google Scholar]
- 25.Zou P et al. Bright and fast multicoloured voltage reporters via electrochromic FRET. Nat. Commun 5, 4625 (2014). [DOI] [PMC free article] [PubMed] [Google Scholar]
- 26.Bajar BT et al. Improving brightness and photostability of green and red fluorescent proteins for live cell imaging and FRET reporting. Sci. Rep 6, 20889 (2016). [DOI] [PMC free article] [PubMed] [Google Scholar]
- 27.Wada T et al. Crystal structure of the eukaryotic light-driven proton-pumping rhodopsin, Acetabularia rhodopsin II, from marine alga. J. Mol. Biol 411, 986–998 (2011). [DOI] [PubMed] [Google Scholar]
- 28.Hengen KB, Lambo ME, Van Hooser SD, Katz DB & Turrigiano GG Firing rate homeostasis in visual cortex of freely behaving rodents. Neuron 80, 335–342 (2013). [DOI] [PMC free article] [PubMed] [Google Scholar]
- 29.Kannan M, Gross GG, Arnold DB & Higley MJ Visual deprivation during the critical period enhances layer 2/3 GABAergic inhibition in mouse V1. J. Neurosci 36, 5914–5919 (2016). [DOI] [PMC free article] [PubMed] [Google Scholar]
- 30.Maffei A & Turrigiano GG Multiple modes of network homeostasis in visual cortical layer 2/3. J. Neurosci 28, 4377–4384 (2008). [DOI] [PMC free article] [PubMed] [Google Scholar]
- 31.Akerboom J et al. Genetically encoded calcium indicators for multi-color neural activity imaging and combination with optogenetics. Front. Mol. Neurosci 6, 2 (2013). [DOI] [PMC free article] [PubMed] [Google Scholar]
- 32.Marshall JD et al. Cell-type-specific optical recording of membrane voltage dynamics in freely moving mice. Cell 167, 1650–1662 (2016). [DOI] [PMC free article] [PubMed] [Google Scholar]
- 33.Contreras D & Steriade M Cellular basis of EEG slow rhythms: a study of dynamic corticothalamic relationships. J. Neurosci 15, 604–622 (1995). [DOI] [PMC free article] [PubMed] [Google Scholar]
- 34.Harvey CD, Collman F, Dombeck DA & Tank DW Intracellular dynamics of hippocampal place cells during virtual navigation. Nature 461, 941–946 (2009). [DOI] [PMC free article] [PubMed] [Google Scholar]
- 35.Vanderwolf CH Hippocampal electrical activity and voluntary movement in the rat. Electroencephalogr. Clin. Neurophysiol 26, 407–418 (1969). [DOI] [PubMed] [Google Scholar]
- 36.Aso Y et al. The neuronal architecture of the mushroom body provides a logic for associative learning. eLife 3, e04577 (2014). [DOI] [PMC free article] [PubMed] [Google Scholar]
- 37.Wilt BA, Fitzgerald JE & Schnitzer MJ Photon shot noise limits on optical detection of neuronal spikes and estimation of spike timing. Biophys. J 104, 51–62 (2013). [DOI] [PMC free article] [PubMed] [Google Scholar]
- 38.Chou YH et al. Diversity and wiring variability of olfactory local interneurons in the Drosophila antennal lobe. Nat. Neurosci 13, 439–449 (2010). [DOI] [PMC free article] [PubMed] [Google Scholar]
- 39.Zhao Y et al. An expanded palette of genetically encoded Ca2+ indicators. Science 333, 1888–1891 (2011). [DOI] [PMC free article] [PubMed] [Google Scholar]
- 40.Chen TW et al. Ultrasensitive fluorescent proteins for imaging neuronal activity. Nature 499, 295–300 (2013). [DOI] [PMC free article] [PubMed] [Google Scholar]
- 41.Dana H et al. Sensitive red protein calcium indicators for imaging neural activity. eLife 5, e12727 (2016). [DOI] [PMC free article] [PubMed] [Google Scholar]
- 42.Inoue M et al. Rational design of a high-affinity, fast, red calcium indicator R-CaMP2. Nat. Methods 12, 64–70 (2015). [DOI] [PubMed] [Google Scholar]
- 43.Tian L et al. Imaging neural activity in worms, flies and mice with improved GCaMP calcium indicators. Nat. Methods 6, 875–881 (2009). [DOI] [PMC free article] [PubMed] [Google Scholar]
- 44.Gautam SG, Perron A, Mutoh H & Knöpfel T Exploration of fluorescent protein voltage probes based on circularly permuted fluorescent proteins. Front. Neuroeng 2, 14 (2009). [DOI] [PMC free article] [PubMed] [Google Scholar]
- 45.Roux L, Stark E, Sjulson L & Buzsáki G In vivo optogenetic identification and manipulation of GABAergic interneuron subtypes. Curr. Opin. Neurobiol 26, 88–95 (2014). [DOI] [PMC free article] [PubMed] [Google Scholar]
- 46.Subramaniam S et al. Protein conformational changes in the bacteriorhodopsin photocycle. J. Mol. Biol 287, 145–161 (1999). [DOI] [PubMed] [Google Scholar]
- 47.Seibenhener ML & Wooten MW Isolation and culture of hippocampal neurons from prenatal mice. J. Vis. Exp 65, 3634 (2012). [DOI] [PMC free article] [PubMed] [Google Scholar]
- 48.McClure C, Cole KL, Wulff P, Klugmann M & Murray AJ Production and titering of recombinant adeno-associated viral vectors. J. Vis. Exp 57, e3348 (2011). [DOI] [PMC free article] [PubMed] [Google Scholar]
- 49.Maffei A, Nelson SB & Turrigiano GG Selective reconfiguration of layer 4 visual cortical circuitry by visual deprivation. Nat. Neurosci 7, 1353–1359 (2004). [DOI] [PubMed] [Google Scholar]
- 50.Huang C et al. Long-term optical brain imaging in live adult fruit flies. Nat. Commun 9, 872 (2018). [DOI] [PMC free article] [PubMed] [Google Scholar]
- 51.Ziv Y et al. Long-term dynamics of CA1 hippocampal place codes. Nat. Neurosci 16, 264–266 (2013). [DOI] [PMC free article] [PubMed] [Google Scholar]
Associated Data
This section collects any data citations, data availability statements, or supplementary materials included in this article.