Abstract
Space-based observations offer a unique opportunity to investigate the atmosphere and its changes over decadal time scales, particularly in regions lacking in situ and/or ground based observations. In this study, we investigate temporal and spatial variability of atmospheric particulate matter (aerosol) over the urban area of Córdoba (central Argentina) using over ten years (2003–2015) of high-resolution (1 km) satellite-based retrievals of aerosol optical depth (AOD). This fine resolution is achieved exploiting the capabilities of a recently developed inversion algorithm (Multiangle implementation of atmospheric correction, MAIAC) applied to the MODIS sensor datasets of the NASA-Terra and -Aqua platforms. Results of this investigation show a clear seasonality of AOD over the investigated area. This is found to be shaped by an intricate superposition of aerosol sources, acting over different spatial scales and affecting the region with different yearly cycles. During late winter and spring (August-October), local as well as near- and long-range transported biomass burning (BB) aerosols enhance the Córdoba aerosol load, and AOD levels reach their maximum values (> 0.35 at 0.47μm). The fine AOD spatial resolution allowed to disclose that, in this period, AOD maxima are found in the rural/agricultural area around the city, reaching up to the city boundaries pinpointing that fires of local and near-range origin play a major role in the AOD enhancement. A reverse spatial AOD gradient is found from December to March, the urban area showing AODs 40 to 80% higher than in the city surroundings. In fact, during summer, the columnar aerosol load over the Córdoba region is dominated by local (urban and industrial) sources, likely coupled to secondary processes driven by enhanced radiation and mixing effects within a deeper planetary boundary layer (PBL). With the support of modelled AOD data from the Modern-Era Retrospective Analysis for Research and Application (MERRA), we further investigated into the chemical nature of AOD. The results suggest that mineral dust is also an important aerosol component in Córdoba, with maximum impact from November to February. The use of a long-term dataset finally allowed a preliminary assessment of AOD trends over the Córdoba region. For those months in which local sources and secondary processes were found to dominate the AOD (December to March), we found a positive AOD trend in the Córdoba outskirts, mainly in the areas with maximum urbanization/population growth over the investigated decade. Conversely, a negative AOD trend (up to −0.1 per decade) is observed all over the rural area of Córdoba during the BB season, this being attributed to a decrease of fires both at the local and the continental scale.
Keywords: air pollution, aerosol, particulate matter, MODIS, MAIAC, South America, Argentina, Córdoba
1. INTRODUCTION
According to the latest report of the World Health Organization (WHO, 2013) particulate matter (PM) is among the most harmful pollutants for human health, particularly associated with heart attacks, cardiovascular and respiratory diseases strokes and cancer (Du et al., 2016; Gharibvand et al., 2017; IARC, 2013). Nowadays, nearly half of the world population lives in big cities and is exposed to levels of airborne particles 2.5 times higher than those recommended by the WHO. To protect citizen health, Europe and North America pioneered the implementation of legislation to reduce emissions of PM from the 1970s (UNECE, 2004). Currently, several countries all over the world regulate and constantly monitor PM ambient levels. In particular, specific daily and/or annual thresholds are typically established for PM2.5 and PM10 (i.e., two metrics corresponding to the total mass of airborne particulate matter with mean aerodynamic diameter < 2.5 and 10 μm, respectively).
In Argentina (South America), a continuous monitoring of PM is only available in its capital, Buenos Aires. In 2014, the Argentinian Secretary of Environment and Sustainable Development established a National Action Plan on Atmospheric Pollution (Res. 1327/14), which identifies the monitoring of atmospheric pollution as a main priority. However, differently from other countries in South America, no specific nation-wide regulation on PM currently exists to protect the population yet.
As aerosols in the atmosphere are greatly variable in space and time (e.g. da Silva Palácios et al., 2016; Satheesh et al., 2017; Zhang et al., 2012), capturing this high spatial and temporal variability is particularly important (Chudnovsky et al. 2013a and 2014; Gupta et al., 2006). Again, most of the information currently available on levels and characteristics of PM and related effects on human health comes from studies focused on developed countries. With few exceptions (e.g., Andrade Filho et al., 2013; Reddington et al., 2015; Smith et al., 2014), this information is conversely scarce, in countries with low/medium income, whose population is even more vulnerable to air pollutant effects (WHO, 2010). In this context, the capabilities of the Earth observation from space offer a unique opportunity to fill gaps and expand spatial coverage of aerosol measurements, potentially enhancing our capability to estimate location-specific exposures to particulate matter.
In the last two decades, the satellite prospective has been crucial in the understanding of PM-related, large-scale or regional phenomena such as continental and intercontinental transport of desert dust or biomass burning emissions (Ancellet et al., 2016; Athanasopoulou et al., 2016; Badarinath et al., 2007; Barnaba et al., 2011; Ben-Ami et al., 2012; Chudnovsky et al., 2011; Kar et al., 2018; Markowicz et al., 2016; Qin et al., 2016; Stachlewska et al., 2018; Yu et al., 2015). Over the (smaller) urban and intra-urban scales, satellite data exploitation for PM-air quality evaluation studies has been attempted (e.g, Chudnovsky et al. 2013a; Guo et al., 2017; Gupta et al., 2013; Meng et al., 2016; Bilal et al., 2017; Misra et al., 2017). Still, literature on this matter has been limited by the unsuitable (low) spatial resolution of most of the available aerosol-related satellite products, the main of which is the aerosol optical depth (AOD). This parameter optically quantifies the aerosol amount within the entire atmospheric column.
Among the space-based remote sensing sensors with aerosol retrieval capabilities, the MODIS instruments flying on board the two NASA platforms Terra and Aqua are providing the longest datasets. In fact, Terra and Aqua were launched in 1999 and 2002, respectively, and are releasing continuous aerosol data since then (Kaufman and Tanré, 1998; Remer et al., 2005; Levy et al., 2007). The standard MODIS product provides AOD retrievals at 10 km spatial resolution, while a more recent, finer product at 3 km resolution has been released in 2015 (Remer et al., 2013). While such spatial resolutions have been extensively exploited for many regional-scale, aerosol-related studies (e.g., Barnaba and Gobbi 2004; Engel-Cox et al., 2004; Ichoku et al., 2002; Kharol et al., 2011; Tian et al., 2018 Yin et al., 2016; Zhang and Reid, 2010), these are yet not sufficient for applications requiring more spatial detail, such as the study of air quality within urban areas (Chudnovsky et al., 2014). Recently, a high-resolution algorithm (Multi-Angle Implementation of Atmospheric Correction, MAIAC) providing AOD at 1km-resolution was developed (Lyapustin et al., 2011 and 2012), thus representing a promising tool to investigate atmospheric particles variability at the city scale (Chudnovsky et al. 2013a). It has been already usefully employed investigating different areas of the world such as the United States (Chudnovsky et al., 2014; Lee H. et al., 2011; Lee M. et al., 2016), the Amazon region (Martins et al., 2018), Europe (Arvani et al., 2016; Emili et al., 2011; Stafoggia et al., 2017), the Middle East and Asia (Kloog et al., 2015; Sever et al., 2017; Xiao et al., 2017).
In this study, we focus on the urban area of Córdoba and its surroundings (central Argentina). Our main goal is the satellite-based characterization of the aerosol load and its temporal and spatial variability. The study also intends to contribute understanding whether space-based, remote-sensing data can be potentially used to infer information on the PM-related air quality status over the target region, given the scarcity of relevant in situ measurements. In fact, in the Córdoba area, there is no air quality monitoring currently underway by any governmental agency, and there is a serious lack of long-term aerosol observations. To overcome this deficiency, in this study we use over ten years (2003–2015) of space-based, remote sensing aerosol data in the attempt to disclose the processes that drove, and are currently driving, changes in atmospheric particulate loads over this populated city of Argentina and its surroundings. The work also includes a detailed accuracy assessment of the MAIAC AOD retrieval in the addressed region through an extended comparison with coincident ground-based, remote sensing AOD measurements.
2. MATERIALS AND METHODS
2.1. The study area
This study focuses over the area of Córdoba (31.1 – 31.6 °S, 63.9 – 64.5 °O), located in the center of Argentina (Figure 1a), in the plain of the Humid Pampa, about 30 km east of the Sierras Chicas hills (550 to 1800 m a. s. l., Figure 1b). The Córdoba city (31.39°S - 64.18°O) is the second largest of Argentina (1.3 million inhabitants, INDEC, 2017). The area has an irregular topography, with an increasing positive slope from the center towards the surrounding rural areas (Figure 1b, c), characterized by an intense agricultural activity (mainly soybean and, partly, maize). In the last 15 years, the Córdoba province experienced a major growth of soybean crops, with a 64% increase of the area cultivated in the period 2000–2015 (National Ministry of Agricultural Industry, see Figure A1, Appendix A).
Figure 1.
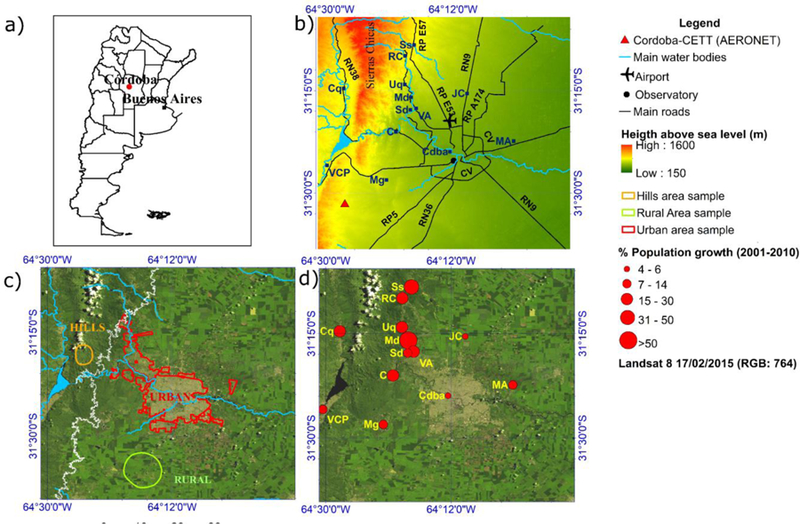
a) Location of the Córdoba City (red dot) within Argentina and relative position of its capital, Buenos Aires (black square); b) The Córdoba area investigated in this study and relevant topography (color code), with indication of main water bodies (cyan), main roads (RP, RN and CV as black lines) and location of the smaller cities in the area: Malagueño (Mg), Villa Carlos Paz (VCP), Cosquín (Cq), Unquillo (Uq), Mendiolaza (Md), Villa Allende (VA), Juárez Celman (JC), Saldán (Sd), La Calera (C), Salsipuedes (Ss), Río Ceballos (RC), Malvinas Argentinas (MA). Position of the Córdoba AERONET site (red triangle) and of the National Weather Service Observatory (black circle) station is also reported); c) Landsat image of the area, and contours of three main zones of different land use (‘rural’, ‘hills’ and ‘urban’) used in this study; d) Population growth (%) in Córdoba and surrounding cities between 2001 and 2010 (source: National Institute of Statistics and Census).
Industries are mostly located outside the city, the main activities being food processing and the automotive industry, including the manufacture of agricultural machinery, manufacture of vehicles parts and motorcycles.
While a minor population growth has been registered in Córdoba in the last decades, this has been more remarkable in the nearby smaller urban centers (Figure 1d). According to demographic data, between 2001 and 2010, growth of the minor centers around Córdoba range from the +6% of Juarez Celman (JC), to the +144% of Mendiolaza (Md). Simultaneously, the vehicle fleet registered an over 90% increase during the decade 2002–2012 (Figure A2).
In this study, we define three main zones within the investigated area, namely ‘rural’, ‘hills’ and ‘urban’ (Figure 1c), selected on the basis of land use and geographical characteristics. The ‘rural’ zone comprises an area characterized by intense agricultural activity, the ‘hills’ zone is a natural area (no buildings and no agricultural activity), while the ‘urban’ zone corresponds to the highly urbanized Córdoba city area.
From a meteorological point of view, the region is characterized by warm and rainy summers (December to February) and dry winters (June to August, Figure 2a, b). In spring (September to November), the temperature raise is also associated to an increase in both frequency and intensity of precipitations, as well as of wind speed, with flows mostly from N – NW (see also Figure A3).
Figure 2.
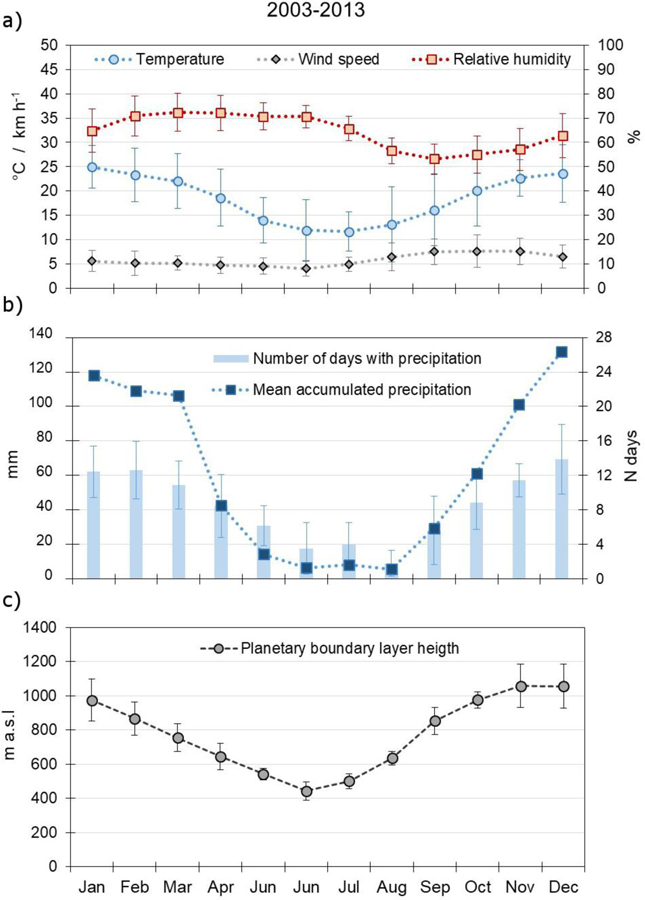
a) Monthly mean temperature (blue), relative humidity (red), wind speed (gray), and b) accumulated precipitation (blue squares) and number of days of precipitation (bars) at the Observatory station in the Córdoba city center (see Figure 1b). Data are from the National Weather Service and cover the period 2003–2013. c) Planetary boundary layer (PBL) height derived from the MERRA model over the Córdoba area for the same period.
Height of the Planetary Boundary Layer (PBL, i.e. the atmospheric layer in which pollutants emitted at ground level are expected to be well mixed), ranges from less than 500 m to over 1000 m a. s. l. (Figure 2c), well following the temperature yearly cycle.
2.2. Datasets
2.2.1. The MODIS-MAIAC algorithm and its application
The Moderate Resolution Imaging Spectroradiometer (MODIS) instrument, aboard the two Terra and Aqua satellites (NASA), acquires data in 36 spectral bands (wavelength range from 0.4 to 14.4 μm). The bands are imaged at a nominal resolution of 250 m (bands 1–2), 500 m (bands 3–7) and 1 km (bands 8–36). The ±55-degree scanning pattern at the 705 km orbit achieves a 2330-km swath, providing global coverage every one-to-two days (Remer et al., 2006). Since the instrument planning phase, specific retrievals have been set up to provide the aerosol optical depth over ocean and land globally on a daily base (Kaufman and Tanré, 1998), with constant improvements which currently allow to provide a 3 km-resolved ‘standard’ AOD product (e.g., Hsu et al., 2013; Remer et al., 2006).
The MAIAC (Multiangle implementation of atmospheric correction) algorithm applied to MODIS processing Level 1 (L1) data allows to retrieve the AOD with a spatial resolution of 1 km, which is compatible with the investigation of the aerosol variability at the urban-scale. A comparison between the standard 10 km- and 3 km-MODIS AOD with the 1 km MAIAC-MODIS one over Córdoba is presented in Figure 3.
Figure 3.

Example of MODIS (Terra) AOD maps over Córdoba city and its surroundings for a single day (18/10/2013) at resolution of: a) 10 km (standard MOD04 product), b) 3 km (standard MOD04_3K product) and c) 1 km (MODIS-MAIAC product). Missing data (white pixels) in plots b) and c) were filtered out as associated to high uncertainty (UNC > 0.1), see text for details.
Full details of the algorithm can be found in Lyapustin et al. (2011 and 2012). Briefly, MAIAC provides aerosol optical thickness at 0.47 μm over both dark surfaces with vegetation and bright deserts. This greater spatial resolution is achieved by time series analysis and image-based processing of MODIS data. MAIAC algorithm derives the Spectral Regression Coefficient (SRC), which relates surface bidirectional reflectance factor (BRF) between the Blue (0.47 μm) and short-wave infrared (2.1 μm) bands. Once the SRC is obtained, the surface BRF in the blue band evaluated from the 2.1 μm channel, and AOD at 0.47 μm (AOD470) is found by matching the measured reflectance with the theoretical values.
In this study, we use the MAIAC AOD470 product for MODIS Terra and Aqua to evaluate the spatial and temporal (13-year dataset, 2003–2015) variability of aerosols in Córdoba city and its surroundings. Terra and Aqua satellites overpass the Córdoba area between 10.00 and 13.00, and 13.00 and 16.00 (local time), respectively.
We pre-filtered MAIAC data in order to exclude from the analysis pixels with low confidence AOD values, screening out pixels likely contaminated by clouds or with too high surface brightness. Specifically, as over bright surfaces the AOD retrievals become uncertain due to a higher sensitivity to small errors in the surface reflectance, a first filter was set up to reject uncertainty pixel values (UNC) higher than 0.1. A second filter is based on the MAIAC quality assurance (QA) flag, which is defined based on detected presence of adjacent clouds. In fact, QA flag = 0 indicates no clouds in a range of 2 km, QA = 1 represents just one detected cloud, while QA > 1 means many adjacent clouds. The latter were filtered out in our study.
2.2.2. AERONET data
To quantify the expected accuracy of the MAIAC AOD retrievals over the investigated area (see Section 3.1), we used ground-based AOD measurements from a sun-photometer located in the Teófilo Tabanera Space Center of the Argentina Space Agency (CONAE) in Córdoba (Córdoba–CETT site, 31.52°S 64.46°O, see Figure 1b). The instrument operated from October 1999 to December 2010 within the worldwide Aerosol Robotic Network (AERONET, Holben et al., 1998, https://aeronet.gsfc.nasa.gov/). AERONET is the most globally distributed network of ground-based sun-photometers, commonly used for validating satellite AOD retrievals (e.g., Gupta et al., 2013; Liu et al., 2004; Nichol and Bilal, 2016; Omar et al., 2013; Remer et al., 2002 and 2005). AERONET data are provided at three data quality levels: Level 1 (L1, unscreened), Level 1.5 (L1.5, cloud-screened), and Level 2 (L2, cloud-screened and quality-assured). To obtain AERONET L2 datasets pre- and post-field calibrations are applied. Furthermore, the dataset is automatically cloud screened and manually inspected to assure the good quality of data.
In this study, we employed the AERONET Córdoba-CETT, L2 AOD dataset at 0.440 μm over the 8-year period 2003–2010. AERONET (‘ground truth’) data were compared to MAIAC retrievals following a quite standard approach that requires spatial and temporal co-location between satellite and ground-based AOD measurements (e.g., Ichoku et al., 2002; Remer et al., 2005), thus assuming that aerosol is relatively homogeneous within a certain time-space boundary (Anderson and Charlson, 2003).
A recent work by Martins et al. (2017) reports an extended validation of MAIAC AOD over South America. In that study, the MAIAC performances where evaluated considering 19 AERONET sites, and grouping them based on land-use characteristics. In that study, the performances of MAIAC over the Córdoba-CETT site were thus evaluated together with those of two additional sites characterized by a savanna/grassland soil type.
Spatial and temporal windows chosen here for the specific comparison in Córdoba are those identified by Martins et al. (2017) as having sufficient matchup for accuracy assessment. Therefore, we computed the MAIAC (Aqua and Terra) average AOD (at 0.470 μm, AOD470) in a 25 × 25 km2 area around the pixel corresponding to AERONET station, with the average AERONET AOD measured within ±60 minutes of the MODIS overpass.
2.2.3. MERRA model dataset
To investigate the chemical nature of the aerosol components contributing to the AOD (Section 3.3), we used data provided by the Modern-Era Retrospective Analysis for Research and Application (MERRA, Rienecker et al., 2011). This is a reanalysis tool incorporating satellite and model data to reproduce spatially consistent observations of many environmental variables. In particular, MERRAero is an innovative tool to study aerosol pollution issues, especially in regions where reliable surface-based monitoring is scarce or unavailable (e.g., Kishcha et al., 2014 and 2015; Yi et al., 2015). The last version of the MERRAero algorithm, assimilates biased-corrected aerosol optical depth from the MODIS sensors (Aqua and Terra satellites) and provides chemically-speciated AOD data with hourly time resolution and 0.5° x 0.625° spatial resolution. MerraAero includes five major aerosol species, namely sulfate (SO4), particulate organic carbon (OC), black carbon (BC), mineral dust and sea salt.
2.2.4. MODIS-derived Angstrom Exponent
In our analysis we also used the MODIS-derived Angstrom Exponent (AE) as a cross-check of the Merra model results in terms of aerosol composition, and particularly with respect to the mineral dust component. In fact, the AE parameter is a measure of the spectral dependence of the AOD (approximately described as AOD(λ) = AOD(λ0) (λ/λ0)-AE) and it’s inversely related to the average particle size (e.g., Schuster et al., 2006). Small particles (as those from urban pollution or biomass burning) are associated to AE > 1, while large particles (as mineral dust, ash, or sea salt) typically have AE < 1. This means that when AOD is dominated by coarse particles it tends to be spectrally neutral (i.e., it does not change with wavelength).
MODIS atmospheric science team provides the Angstrom Exponent computed using AOD values at different wavelengths (0.412 and 0.470 μm) from the ‘Deep Blue’ algorithm. At many wavelengths of visible light, the contrast between aerosols and the surface is difficult to discern, but in the 0.412 μm band aerosol signals tend to be bright and surface features dark. The 0.412 μm band is sometimes referred to as the “deep blue” band, from which the algorithm gets its name.
In this study we used the MODIS Level 3 AE over land (1°x1° spatial resolution, QA-weighted product), derived using the Deep Blue algorithm (Hsu et al., 2013; Sayer et al., 2013) to evaluate the advection of (coarse) mineral dust particles on a monthly basis and at the regional scale.
2.3. Analysis of the intra and inter annual variability
With the aim of investigating the AOD spatio-temporal variability, in this work both inter and intra annual analysis of the above described datasets were performed. In particular, intra-annual variability was assessed investigating monthly-resolved data aggregating years (e.g., Sections 3.2 and 3.3), while the reverse (yearly-resolved data, aggregating months) was generally applied to investigate inter-annual variability (trends) over the whole period 2003–2015 addressed (Section 3.4).
In terms of spatial variability of the aerosol fields, intra-annual analysis over the addressed region was evaluated using both monthly-resolved maps aggregating years and monthly-resolved values aggregating years plus land use categories (Sections 3.2, 3.3). Inter-annual variability (trends) was mainly evaluated through yearly-resolved data, aggregating months and land use (Section 3.4).
3. RESULTS AND DISCUSSION
3.1. Assessment of the MAIAC AOD accuracy in Córdoba
Figure 4 shows the scatter plot of MAIAC vs. AERONET AOD data. Expected error due to the MODIS-AERONET wavelength shift (0.470 μm MODIS, 0.440 μm AERONET) is estimated to be within 20 % (considering an AE in the range 0.5 – 3). A synthesis of the parameters quantifying the accordance between the datasets is given in Table 1, this also including results of the data linear fit (y= a x + b). At low AOD, it is the bias rather than the slope that characterizes the accuracy (uncertainty) of satellite retrievals. For this reason, the general statistical evaluation includes characterization of both the slope and offset of regression (e.g., Liu et al., 2010, Xie et al., 2011, Martins et al. 2017, Wang et al., 2017, Zhang et al., 2017).
Figure 4.
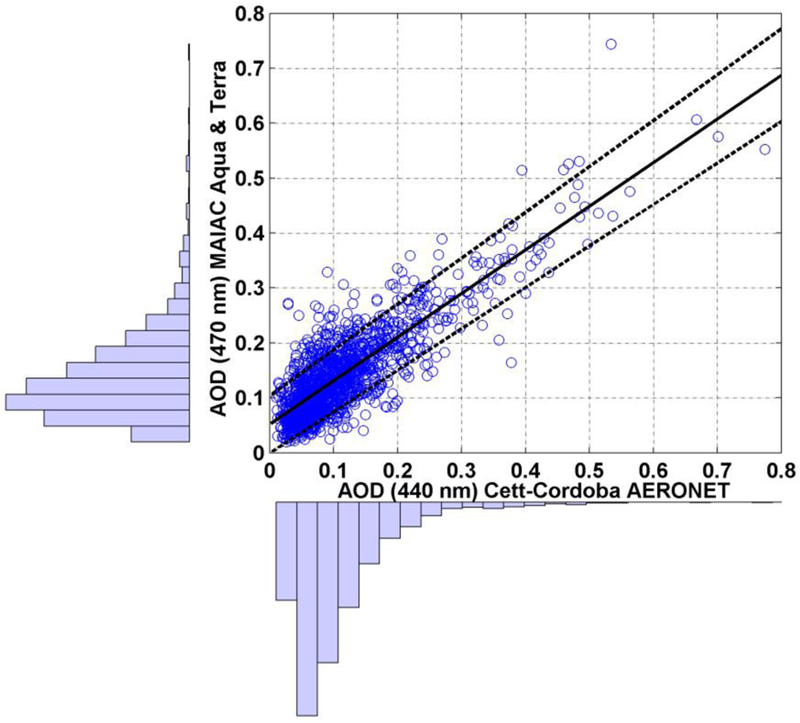
Scatter plot of MAIAC AOD (0.47 μm) retrievals (25 × 25 km2 area, Aqua & Terra combined) vs Córdoba-CETT AERONET AOD at 0.44 μm (within ±60 min from the satellite overpass) over the period 2003–2010. The continuous black line corresponds to the data linear fit (y= a x + b, see Table 1) while dashed lines to the AOD Expected Error [EE = ± (0.05 + 0.05 × AOD)]. Histograms on each axis show the relative frequency distribution of the data within different AOD bins.
Table 1.
Statistics for Córdoba-CETT AERONET station AOD440 data vs MAIAC AOD470: total data (N), adjusted linear model coefficient (R2adj), slope (a), intercept (b), Root Mean Square Error (RMSE= square root of the variance of the residuals) and Pearson correlation coefficient (rpearson).
| MAIAC (Córdoba) | MODIS 3 km* | MODIS 10 km* | MAIAC (ensemble of Savanna/Grassland sites of Argentina, in Martins et al. 2017) | ||||
|---|---|---|---|---|---|---|---|
| Terra | Aqua | Terra & Aqua | Terra & Aqua | Terra & Aqua | Terra | Aqua | |
| N | 1480 | 715 | 2195 | 636 | 162 | 1232 | 1095 |
| R2adj | 0.70 | 0.69 | 0.70 | 0.45 | 0.35 | - | - |
| a | 0.75 | 0.82 | 0.79 | 0.55 | 0.35 | - | - |
| b | 0.05 | 0.05 | 0.05 | 0.01 | 0.03 | - | - |
| RMSE | 0.04 | 0.04 | 0.04 | 0.05 | 0.06 | 0.04 | 0.04 |
| rpearson | 0.83 | 0.84 | 0.83 | 0.67 | 0.59 | 0.87 | 0.91 |
Arithmetic mean of the MODIS data that are co-located (within 27.5 km) with ground-based AERONET measurement (± 30 minutes). Source: https://giovanni.gsfc.nasa.gov/aerostat/.
In general, our results show that there is a good agreement of both Terra and Aqua MAIAC-AOD products with AERONET measurements, obtaining Pearson correlation coefficients rpearson > 0.8, and adjusted linear model coefficient R2adj ≥ 0.70.
Overall, even if the fit slope a is < 1, due to the positive bias, b, MAIAC tends to slightly overestimate AOD at low AOD values (< 0.2), these representing the majority within the Córdoba dataset (Figure 4).
Similar results by Martins et al. (2017) for the ensemble of sites sharing the same land-use type of Córdoba are also reported in Table 1 for direct comparison. As can be seen, the MAIAC-AERONET correlation coefficient found in this study for the Córdoba-CETT station is slightly lower than the one reported by Martins et al. (2017). More than 2/3 (~73%) of retrievals of Aqua and Terra data over Córdoba are within the expected error (EE) for MAIAC data proposed by Martins et. al (2017), i.e., EE = ± (0.05 + 0.05 × AOD) (see also Figure 4). These MAIAC performances are also in line with those reported for other regions of the world. For example, Kloog et al. (2015) found rpearson = 0.85 between MAIAC/Aqua and AERONET data for Israel; Emili et al. (2011) reported a similar adjusted linear model coefficient (R2adj = 0.67) in Ispra (Italy). Similar results were also found using AERONET sites in the East Coast of the United States (Lyapustin et al., 2011) and above arid (bright) areas surrounding the Dead Sea (Sever et al., 2017). Slightly higher correlations coefficients (up to r > 0.9) were found by Martins et al. (2018) comparing MAIAC-Terra to two AERONET sites in the Amazon in the period 2011–2015.
To illustrate the advantages of the MAIAC high resolution, we also included in Table 1 the same statistical parameters obtained using the standard MODIS 10 km- and 3 km-resolution AOD550 product (MXD04 and MXD04_3k, respectively). As previously documented (Chudnovsky et al. 2013a and 2013b), MAIAC retrievals lead to a general better agreement with ground-based AOD measurements as well as provide much larger spatial coverage than conventional 10 and 3 km, supporting its potential in aerosol monitoring at urban and regional scales.
3.2. Temporal and spatial AOD variability over Córdoba
The yearly variability of the aerosol load over Córdoba as derived from MAIAC and AERONET data is illustrated in Figure 5. It refers to the whole period of coincident AERONET-MODIS measurements, i.e. 2003–2010. Figure 5 highlights a clear annual cycle, with the highest values occurring in September-October (spring) and lowest values from March to July (autumn and winter).
Figure 5.
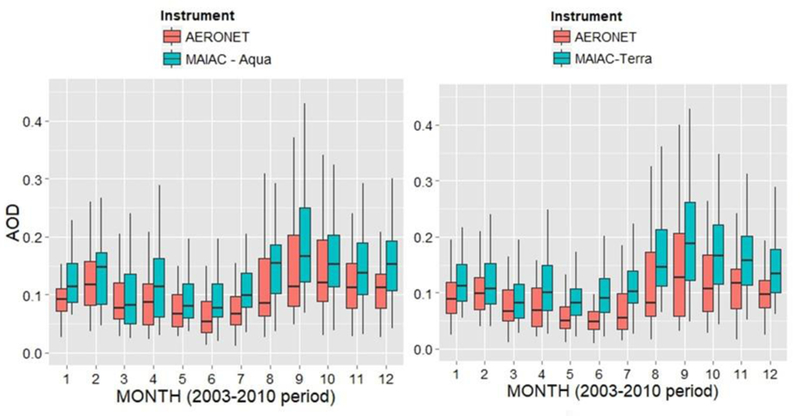
Box plots of AOD (2003–2010 period) obtained using the Córdoba-CETT AERONET AOD at 0.44 μm (red bars) (only data within ±60 minutes from the MODIS overpass average) and MAIAC AOD470 retrievals (25×25 km average, blue bars) from Aqua (left panel) and Terra (right panel). The bold line in each box is the median AOD, upper and lower hinges correspond to the first and third quartiles (the 25th and 75th percentiles, respectively), while whiskers extend from the hinge to the value that is within ±1.5*IQR (interquartile range) of the hinge.
Although the seasonal AOD evolution is well captured by the MAIAC retrievals, as expected from Figure 4, Figure 5 shows a 20–30% MAIAC overestimation with respect to AERONET, mainly during those months with the lowest (May to June) and highest (August-December) AOD values. Correlation of MAIAC and AERONET monthly medians for the whole period keeps however quite high (rMAIAC Aqua = 0.95, rMAIAC Terra = 0.93), indicating the good ability of MAIAC to reproduce the AOD seasonality. For comparison, the correlation decreases to 0.83 and 0.74 using the Aqua MODIS 3 km (MYD04_3K) and 10 km (MYD04) products, respectively.
It is also worth noting that, since this study mainly addresses spatial and temporal variability of the MAIAC AOD (rather than its absolute value), the 20–30% overestimation of MAIAC with respect to the ‘ground-truth’ does not affect much our analysis and relevant conclusions.
A small positive bias in MAIAC AOD gives a clear indication for the future improvement of MAIAC algorithm including its regional aerosol model assumptions. For the current practical applications, the bias can be characterized on a regional/seasonal basis, and possibly as a function of the land cover type (e.g., Martins et al., 2017), with the help of AERONET dataset. One prototype for such approach of regional improvement of satellite dataset by using the machine learning has been recently proposed (Just et al., 2018).
Overall, the AOD annual cycle illustrated in Figure 5 hides an intricate interplay of several factors, some of which can be easily identified, and some other being of more difficult interpretation. The highest absolute AOD values recorded between August and October in Córdoba are a common feature in South America (SA), and are driven by biomass burning (BB) emissions at both the local and continental scale as widely documented (e.g., Argañaraz et al., 2015; Ulke et al., 2011; Videla et al., 2013). All over SA, fire is in fact the dominant method through which forests and vegetation are cleared to prepare and maintain land for agriculture, and both rural and urban populations are exposed to air pollution from open burning associated with agricultural practices (e.g., Jacobson et al., 2014). Coupling fire counts and lagrangian modeling of atmospheric transport, Videla et al. (2013) estimated that in the burning season near-range fires (mostly within the Chaco woodlands of Argentina and Paraguay) contribute to 60–70% of the BB-related AOD in Central Argentina, the remaining 30–40% being almost entirely due to longer-range transport from the Brazilian Amazon and Cerrado regions. Locally, the Sierras Chicas (Figure 1b) is among the most active fire areas in the Córdoba region (Argarañaz et al., 2015), which typically exhibits an August-to-November seasonality of fires (Miglietta, 1994).
Apart from the AOD values in the BB season, it is worth mentioning that the Córdoba AOD cycle, with summer maxima and winter minima (Figure 5), is rather typical in several other regions of the world (Barnaba et al., 2010; Gupta et al., 2013; Prasad et al., 2005; Sharma et al., 2011). Main factors driving this cycle are summer increase of secondary aerosol production, higher availability of water vapour in the atmospheric column and possible enhanced injection of soil particles due to stronger convection.
To provide further insights into the results of Figure 5, and exploiting the MAIAC spatial resolution capabilities, we show in Figure 6 the AOD annual cycles derived for the three different zones identified in Figure 1c, i. e., over the selected ‘hills’, ‘rural’ and ‘urban’ pixels.
Figure 6.
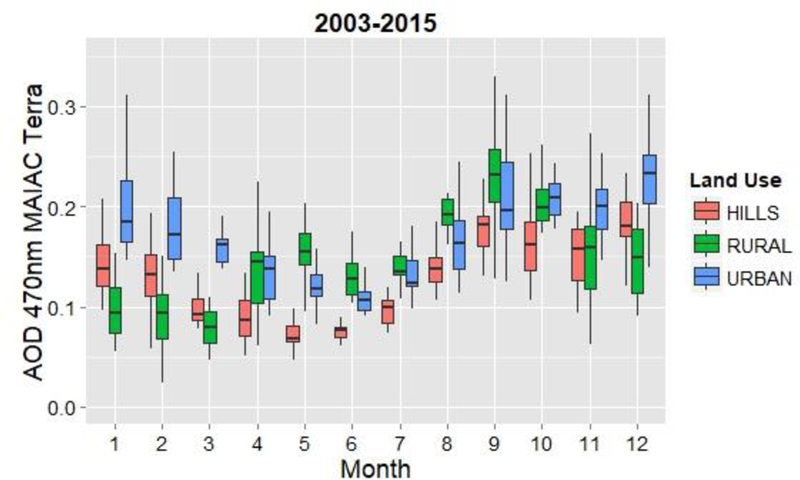
Box plot of MAIAC AOD at 0.470 μm for the 2003–2015 period for the selected ‘urban’, ‘rural’ and ‘hills’ areas (see Figure 1c). Meaning of each box element is the same of Figure 5.
Figure 6 shows the three different regions to exhibit a similar annual cycle, with maxima in the warmest months and minima in the coldest ones. From November to March, the urban area clearly shows the highest median AODs values, almost doubling the ‘rural AOD’ in January. In principle, the difference between the ‘urban’ AOD and the ‘rural’ and ‘hills’ one could be used to quantify the impact of local, urban emissions with respect to the cleaner conditions of the city outskirts. However, from April to June we observe a local maximum of rural-AOD, this keeping higher than the ‘urban’ AOD up to September. This behavior is incompatible with the urban AOD being simply the sum of a ‘background AOD’ and ‘local pollution’. Rather, it points to an additional aerosol source, likely related to agricultural practices. Indeed, April-to-early June is the harvest period in the rural area, and many farmers burn the open fields to clear wheats instead of removing them manually.
The monthly-resolved spatial distribution of AOD in the addressed region (Figure 7) further contributes disclosing the points discussed so far. In Figure 7, we show the 1km-resolved, monthly-mean AOD values (MAIAC/Aqua) over the Córdoba region, covering the period 2003–2015. This detailed view clearly illustrates how much, and how extensively, the area is impacted by BB aerosol between August and October, leading to the maximum yearly AODs already commented in Figures 5 and 6. Furthermore, it allows highlighting that, in this period, maximum AODs are observed in the rural/agricultural area around the city, reaching up to the boundaries of the urban area (the ring road in Figure 7). Despite the different absolute values in the total number of fires recorded in the region with respect to other areas in South America (see Figure A4), this feature clearly suggests a major contribution to AOD of local and near-range fires, this superimposing to the one from long-range BB. This is again in agreement with the results of Videla et al. (2013), who estimated an AOD contribution of long-range BB transport from the Amazon to Central Argentina of 30–40%.
Figure 7.
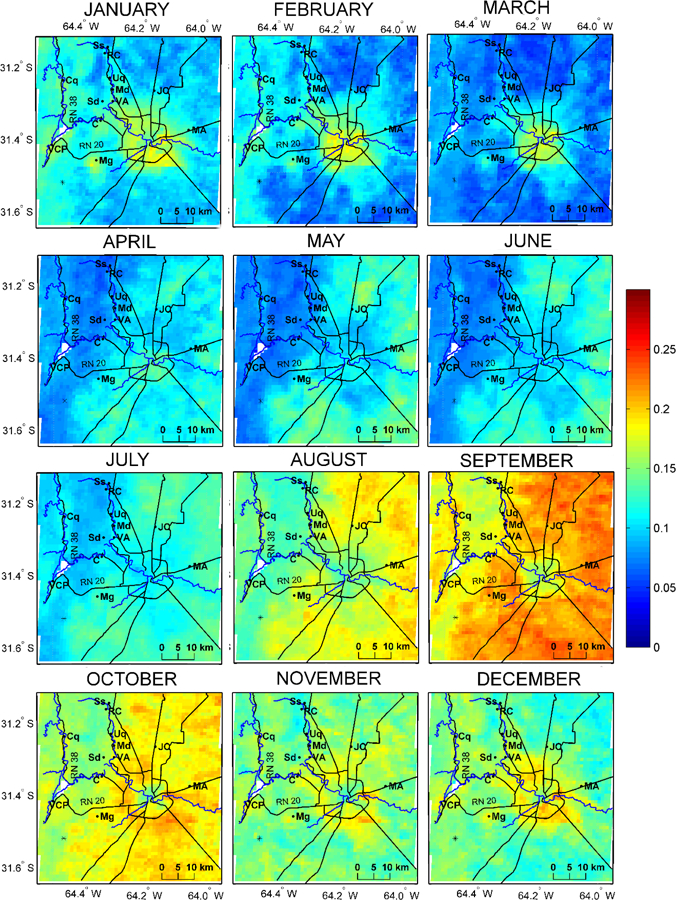
AOD-MAIAC (470 nm) monthly median for the 2003–2015 period over Córdoba city and its surroundings (Mg: Malagueño, VCP: Villa Carlos Paz, Cq: Cosquín, Uq: Unquillo, Md: Mendiolaza, VA: Villa Allende, JC: Juárez Celman, Sd: Saldán, C: La Calera, Ss: Salsipuedes, RC: Río ceballos, MA: Malvinas Argentinas, see also Figure 1).
Figure 7 also discloses that the enhanced ‘rural’ AOD from March to June obtained for a limited area in Figure 6, extends all over the rural/agricultural area around the city, likely linked to the mentioned April-to-early June harvest period in this region. Earlier studies also reported higher values of PM10 observed in situ at backgrounds sites and at the borders of the city with respect to urban sites, this being attributed to the different land use, and to the dust transported by the wind (Olcese et al., 1998; Olcese and Toselli, 1998).
In the Hills area, AOD keeps the lowest of the whole region almost all year round, which is an expected effect of the coupling between higher elevation and minor emission sources. It is also interesting to note that this spatial gradient is still visible in the BB season. This further supports the major contribution of local and near-range fires to the observed AOD in the area with respect to the long-range transported smoke. In fact, this latter is rather expected to more uniformly impact over our study area, being the associated AOD mainly build up by aerosol extinction above the Córdoba PBL (e.g., Andreae et al., 2001; Baars et al., 2012; Huang, et al., 2015)
Out of the BB and of the harvesting season, a quite different spatial pattern is observed in Figure 7. In fact, from December to March the aerosol load is found to be 40 to 80% higher within the Córdoba urban area compared to its surroundings. In particular, in this period of the year, the highest AOD values (0.15 – 0.2) are shown to extend from the city to its outskirts along the main roads. The high MAIAC spatial resolution also allows detecting an enhanced AOD values over some other minor urban settlements in the area, particularly over Malagueño (Mg, southwest of Córdoba), and partially over both Villa Carlos Paz (VCP) and Cosquin (Cq), in the hills area (see Figure 1). It is worth mentioning that the hills to the east of Córdoba are an important touristic center in summer, accounting for about 20% of the total Argentinian tourism and reflecting into a great increase in local traffic (see Figure A5). For example, along the National Route 20 (RN 20, which links Córdoba city and Villa Carlos Paz, the main touristic city in the area) January has 40–65% higher levels of total traffic with respect to June. As mentioned, apart from these summer months, the hills region always show the lowest AOD loads in the investigated area, as expected.
These results suggest that, in summer, the columnar aerosol load over the Córdoba region is dominated by local (urban and industrial) sources, likely coupled to secondary processes driven by enhanced radiation and PBL mixing (Figure 2c). Knowledge of the aerosol chemical composition would be necessary to support this interpretation, but available measurements on this aspect are also limited. Some few, previous studies on atmospheric pollution within the city revealed that the primary source of pollutants in Córdoba city is vehicular traffic (Olcese and Toselli, 2002). A study conducted from June 1995 to April 1996 found a linear correlation between the amount of traffic and the measured CO and NOx at two urban sites (Olcese et al., 2001; Stein and Toselli, 1996). In terms of PM, a recent study by López et al. (2011) carried out over 10 months (July 2009 - April 2010) revealed that sources contributing to PM10 were traffic and oil combustion, while for PM2.5 these were, in order of importance: traffic, metallurgical industries, and construction activities. Nevertheless, for both PM2.5 and PM10, the most important contribution (in terms of mass concentration) was found to be re-suspended urban dust (up to 65% in PM10). Similarly, a recent study by Tavera Busso et al. (2017) investigating PM2.5 elemental composition, confirmed the anthropic origin of particles as well as the significant contribution of dust resuspension, this latter revealed by the abundance of K, Ca, Fe, As and Pb.
3.3. Chemical nature of aerosol particles: insights from the MERRA model
To get some insights into the seasonally variable chemical nature of aerosol particles in our study region we employed the MERRA model data described in Section 2.2.3. This model-based approach revealed a non-negligible role of soil dust on AOD in Argentina. In Figure 8 (top row) we show the MERRA-derived, monthly mean (2003–2015) contribution of dust-related AOD over the country for the period November to February (i.e., the period of maximum dust impact). Figure 8 suggests mineral dust generated over the arid regions of the Andes to be an important source of long-range advected aerosol particles, reaching Córdoba transported by downslope winds. According to previous studies, additional potential dust sources in the Córdoba region are represented by the Laguna Mar Chiquita, a terminal saline lake located North West of the Córdoba province (Engelstaedter and Washington, 2007), and the eroded areas to the South (Otero et al., 2011).
Figure 8.
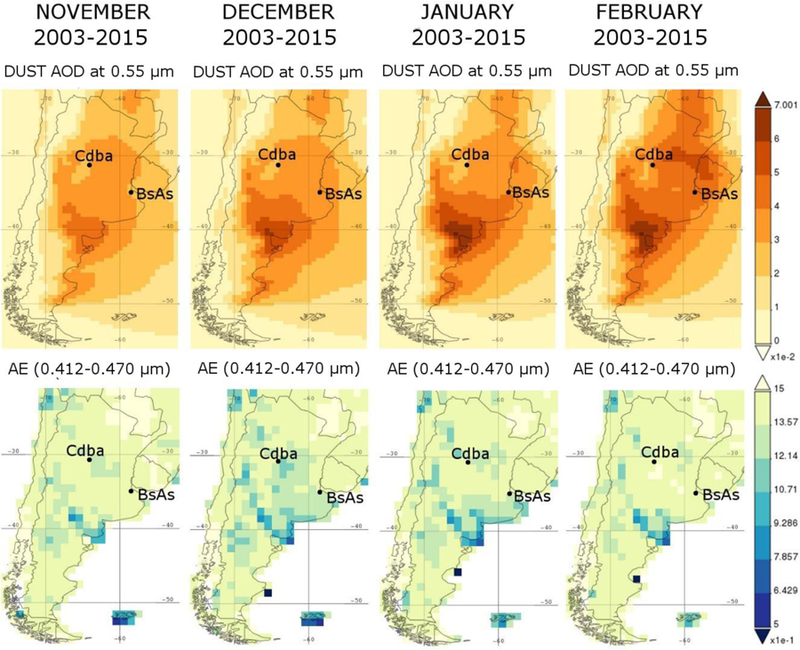
Top: Monthly mean (2003–2015) MERRA-model Dust-AOD at 0.550 μm at 0.5 × 0.625° for the months from November-to-February (from left to right). Bottom: Monthly mean (2003–2015) Angstrom Exponent as derived over land using the Deep Blue Algorithm applied to MODIS-Aqua data, see text for details). The position of Córdoba (Cdba) and Buenos Aires (BsAs) is reported in both panels.
As a further, observation-based confirmation of the advection of dust particles in the Córdoba region, we show in Figure 8 (bottom row), maps of mean Angstrom Exponent derived over land using the MODIS Deep Blue algorithm (see Section 2.2.4). These maps provide evidence of the presence and transport of coarse particles (AE ≤ 1) from the Andes through the Córdoba region and down to the Buenos Aires area.
Overall, these results indicate mineral dust to contribute to the November-to-March AOD over the whole area investigated. The enhanced AOD observed within the urban area of Córdoba and over the main roads (Figure 7) could therefore be (at least partially) related to dust particles resuspension by local traffic. This effect has been documented in Buenos Aires (Arkouli et al., 2010; Bogo et al., 2003) as well as in other areas of the world affected by long-range mineral dust transport (e.g., Amato et al., 2013; Barnaba et al., 2017). Verification of this hypothesis for Córdoba would require specific investigation with size- and/or chemically-resolved aerosol sampling in the area.
To complete the picture, we show in Figure 9 the MERRA-derived results for all the aerosol components considered in the model. In particular, monthly mean (2003–2015) absolute and relative contribution to the total AOD of the five aerosol components (black carbon, organic carbon, dust, sea salt and sulfate) are shown in Figure 9a and 9b, respectively.
Figure 9.
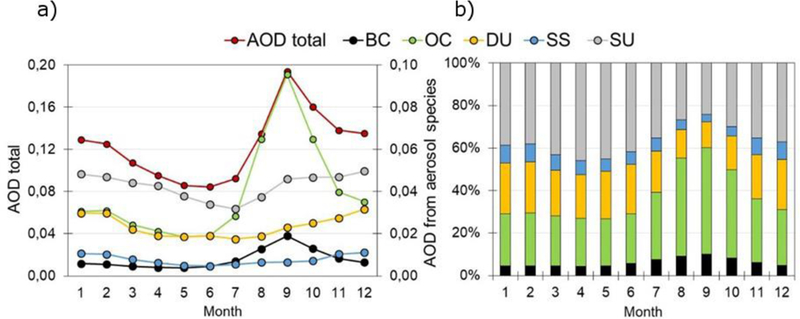
a) Monthly median (2003–2015) total (red) and component-resolved (Black Carbon, BC, Organic Carbon, OC, Dust, DU, Sea Salt, SS and Sulfate, SU, see color legend) AOD at 0.550 μm as reproduced by the MERRA model over the Córdoba region. Note the different scale for the total AOD (left Y-axis) and the component-resolved ones (right Y-axis). b) Monthly-resolved relative contribution (%) of the different aerosol species to the total AOD.
As expected, the BB season is well identifiable in terms of both absolute AOD and chemical components (increase of BC and OC values and relative, percent contributions from July to November, with maxima in August-October). Yearly cycles of sulfate (SU) can be seen as a proxy of components having a clear anthropogenic-origin and affected by secondary, radiation-driven processes. Contribution of sea salt keeps low (10%) all over the year.
3.4. Year-to-Year variability and Trends
The use of long-term AOD datasets also allows evaluating possible trends over the targeted area. Although a detailed assessment of this aspect is beyond the scope of this work, a preliminary investigation is provided here. In Figure 10 we show yearly median values of AOD over the three selected regions of this study (‘urban’, ‘rural’, ‘hills’) covering the period addressed (2003–2015).
Figure 10.
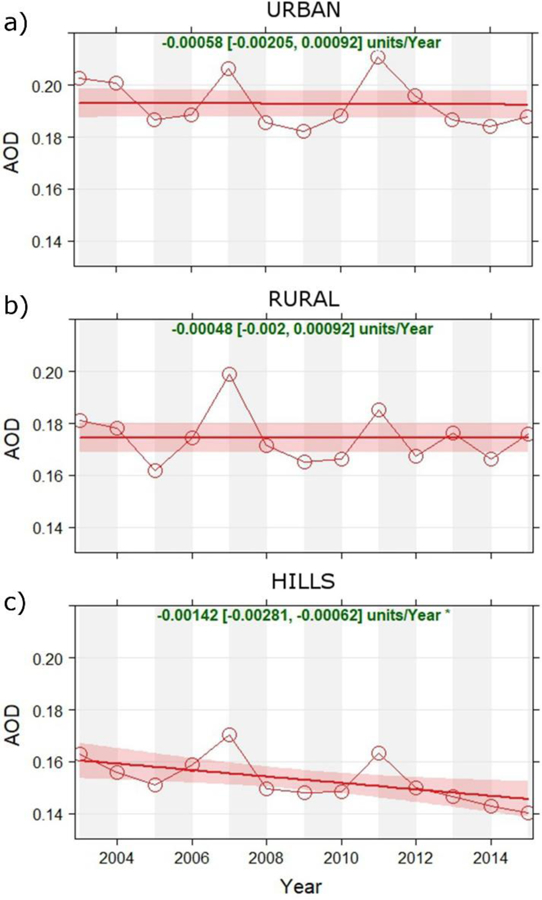
Annual median AOD MAIAC and data fit curve (red line). Red area show the 95 % confidence intervals of the fit, determined using Generalized Additive Modelling. The overall slope of the trend [and relevant 95% confidence intervals] are shown at the top of each panel. The ∗ symbol indicates that the trend is significant to the 0.05 level.
Figure 10 reveals a marked year-to-year variability of AOD in each of the three regions, and only suggests a (negative) significant trend over the ‘Hills’ area. However, as widely discussed throughout the text, the Córdoba region is characterized by quite different aerosol sources, each with a marked seasonality. Therefore, the use of yearly average (or yearly median) AODs could lead to misleading interpretations. For this reason, we examined possible trends using a monthly- and spatially-resolved approach, thus further exploiting the MAIAC capabilities.
In Figure 11, we show the monthly and 1km-resolved maps of the slope of the AOD linear fit over the 13-year period 2003–2015. We only included in Figure 11 those months showing the most interesting trends, i.e., those corresponding to boreal summer-early autumn (December to March) and to the BB season (August to November), the other, transition ones showing no particularly interesting trends. The usefulness of this approach is that it allows identifying regions in which there is a clear spatial coherence (i.e., robustness) in the derived trends.
Figure 11.
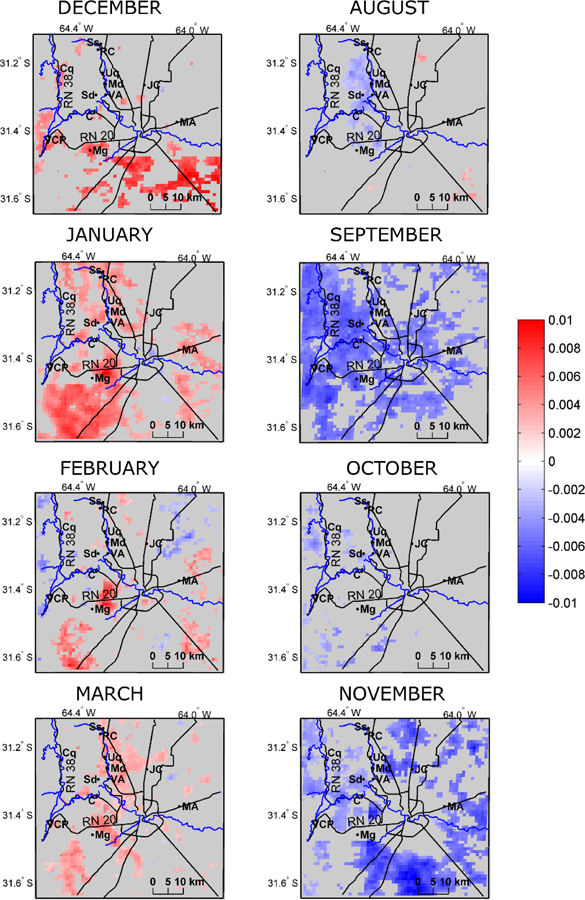
Monthly and 1km-resolved maps of the slope of the AOD linear fit (units/year) over the 13-year period 2003–2015. Gray areas are those in which the trend is not significant, p < 0.05.
Results of Figure 11 show a positive AOD trend in the Córdoba outskirts in those months (December to March) in which local sources and secondary processes dominate the AOD (see also Section 3.2), reaching up to +0.01/year. The increase is particularly evident in the proximity of the small centers of Malagueño (Mg, southwestern Córdoba) and in the northwestern area around Unquillo (Uq), Mendiolaza (Md), and Villa Allende (VA), this latter being the area with maximum urbanization/population growth over the 13-year period investigated (see Figure 1d). An opposite trend is found during the BB season (Figure 11, right column) in which our results clearly indicate a negative AOD trend (up to - 0.01/year) all over the rural area of Córdoba, particularly marked in September, i.e., during the maximum intensity of the BB season. This is in line with the well-documented, policy-driven decrease in deforestation rates and associated fires in the Amazon region (e.g., Aragão and Shimabukuro, 2010; Chen et al., 2014; Hansen et al., 2013; Macedo et al., 2012; Nepstad et al., 2014; Reddington et al., 2015). Although deforestation in Argentina is not slowing down as much as in Brazil (e.g., FAO, 2016; Hansen et al., 2013; see also Figure A6), we verified that a quite remarkable reduction in number of fires in the Córdoba province was registered in the 2003-to-2015 period (Figure A7). This decrease is also compatible with the agricultural expansion in the Córdoba region (e. g., Figure A1), a factor that has been shown to drive fire decline at both the regional (Aragão and Shimabukuro, 2010) and the global (Andela et al., 2017) scales. However, at this stage we are not able to establish in which proportion the local and continental-scale fires reductions contributed to the observed negative AOD trend over Córdoba. This aspect would certainly merit further investigation, which is however beyond the scope of the current study.
Interestingly, in Figure 11 the Córdoba city center does not show any particular feature (no significant trend), with the only exception in the month of September, in which AOD decrease reaches within the city area.
Finally, Figure 11 also clarifies why we see no trend in the rural area in Figure 10b. In fact, it shows that positive trends in summer are to some extent balanced by the negative ones during the BB season.
4. Summary and conclusions
The scarcity of in situ and/or ground-based aerosol physical and chemical observations in Argentina is an obstacle that should be addresses to understand the processes that drove, and are currently driving, changes in atmospheric particulate matter and related impacts in this area. To contribute filling this gap, in this study we use over ten years (2003–2015) of high-resolution (1 km) satellite retrievals of aerosol optical depth (AOD) from the MODIS-MAIAC algorithm to explore temporal and spatial variability of particulate matter loads over the Córdoba region (central Argentina).
Results can be summarized as follows.
The aerosol seasonal variability over the Córdoba region is driven by an intricate superposition of local and non-local sources, each having a different yearly cycle. In fact, as a common feature all over South America, local as well as near- and long-range transported biomass burning (BB) markedly enhance the Córdoba aerosol load during the burning season, in which AOD levels reach their annual maxima (0.37 at 0.470 μm).
The spatial detail of MAIAC retrievals helped understanding how extensively the Córdoba area is impacted by BB aerosol between August and October. Additionally, it allowed to unveil that, in this period of the year, maximum AODs are found in the rural/agricultural area around the city, reaching up to the city boundaries. This inhomogeneous pattern suggests a major contribution to AOD of fires of local and near-range origin, this superimposing to the still important contribution of long-range transported smoke from the active Brazilian Amazon and Cerrado regions. In fact, this latter is expected to affect the whole region more homogeneously, as most of its aerosol extinction is above the planetary boundary layer.
A reverse spatial gradient is observed from December to March, with AOD over the Córdoba urban area being 40-to-80% higher than in its surroundings. This indicates that in summer the columnar aerosol load over the Córdoba region is dominated by local (urban and industrial) sources, likely coupled to secondary processes driven by enhanced radiation and PBL mixing effects.
Additional to these local sources, our results suggest mineral dust to be an important aerosol component in Córdoba, with maximum impact from November to February. This is revealed by combining the MAIAC-derived AOD spatial variability within the Córdoba urban area (higher AOD in the city center and along the major roads, indicating a possible role of dust resuspension) with a country-scale analysis of a) the MERRA model AOD components and b) the MODIS-observed Angstrom Exponents.
The use of a long-term AOD dataset allowed a preliminary assessment of trends over the investigated area. In those months in which local sources and secondary processes dominate the AOD (December to March), this analysis revealed a positive AOD trend (up to +0.01/year) in the Córdoba outskirts, particularly evident in the areas with maximum urbanization/population growth over the period investigated. Conversely, during the BB season our results clearly indicate a negative AOD trend (up to −0.01/year) all over the rural area of Córdoba. This latter result is compatible with the known, policy-driven decrease of Amazon deforestation (and associated BB) in the last decade as well as to the observed decrease in the number of fires of more local origin in the Córdoba area. At this stage we are not able to establish in which proportion the two effects (far-range and the near-range fire reductions) contribute to the observed AOD decrease trend in the Córdoba area, this leaving an interesting subject for further investigation.
Several studies recently exploited the MAIAC AOD retrievals to infer PM data at the ground (Kloog et al., 2015; Stafoggia et al., 2017; Xiao et al., 2017), and this would also be an interesting extension of the current study. However, our results highlight that caution should be used in attempting similar conversions in this area, at least in those periods in which non-local, long-range transported particles play an important role. In fact, atmospheric transport differently affects particulate matter loads at the ground level and aloft, thus differently impacting AOD (columnar) and PM (ground-level) values.
Acknowledgements
We thank the AERONET network and staff, and particularly Brent Holben (NASA) and Eduardo Quel (CITEDEF), for having established and maintained the CETT-Córdoba site used in this investigation. MerraAero and Angstrom exponent data used in this study were acquired using the GES-DISC Interactive Online Visualization And aNalysis Infrastructure (Giovanni) as part of the NASA’s Goddard Earth Sciences (GES) Data and Information Services Center (DISC). We acknowledge the MODIS mission scientists and associated NASA personnel for the production of the data used in this research effort. We also acknowledge the Food and Agriculture Organization (FAO) of the United Nations, and particularly the FAO Statistics Division, for providing the forest land data used in Figure A6 through their open-access database. LSDC was supported by grants from the Comisión Nacional de Actividades Espaciales (CONAE, Argentina) and the Agenzia Spaziale Italiana (ASI, Italy).
Appendix A.
Figure A1.
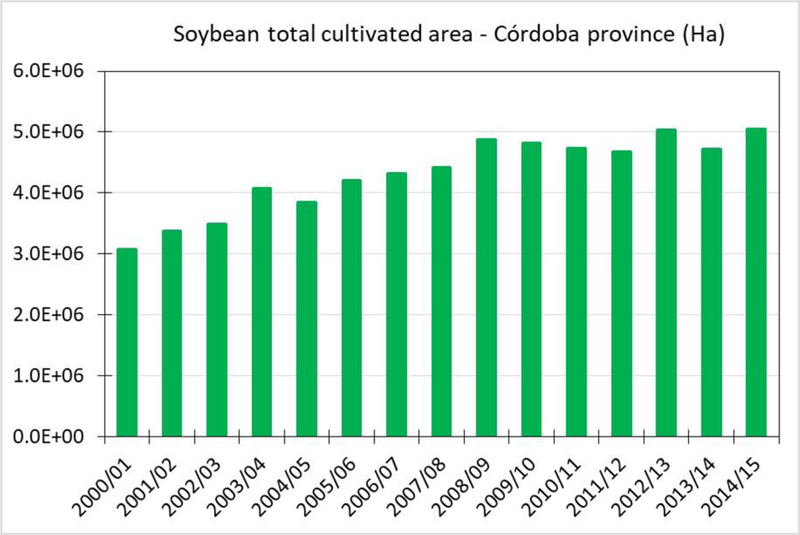
Total area of Córdoba province cultivated with soybean in the 2000 – 2014 period (Source: National Ministry of Agricultural Industry).
Figure A2.
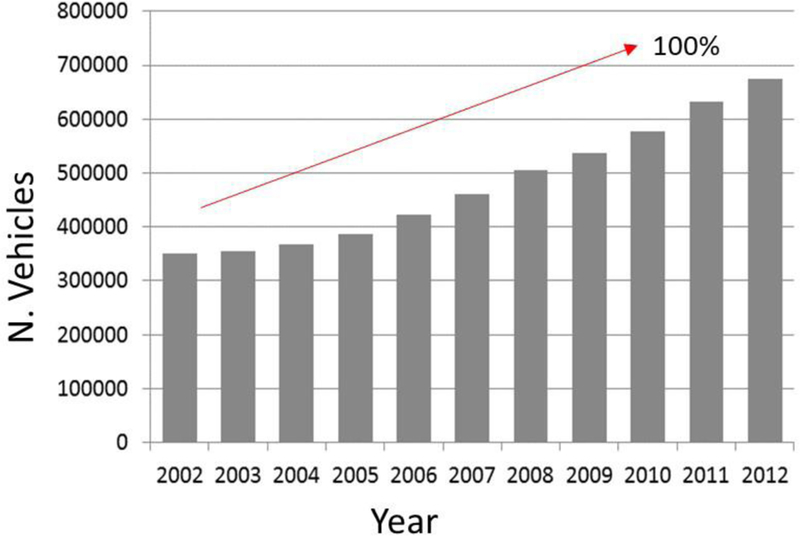
Number of vehicles per year in Córdoba city (Source: Municipalidad de Córdoba, http://gobiernoabierto.Córdoba.gob.ar)
Figure A3.
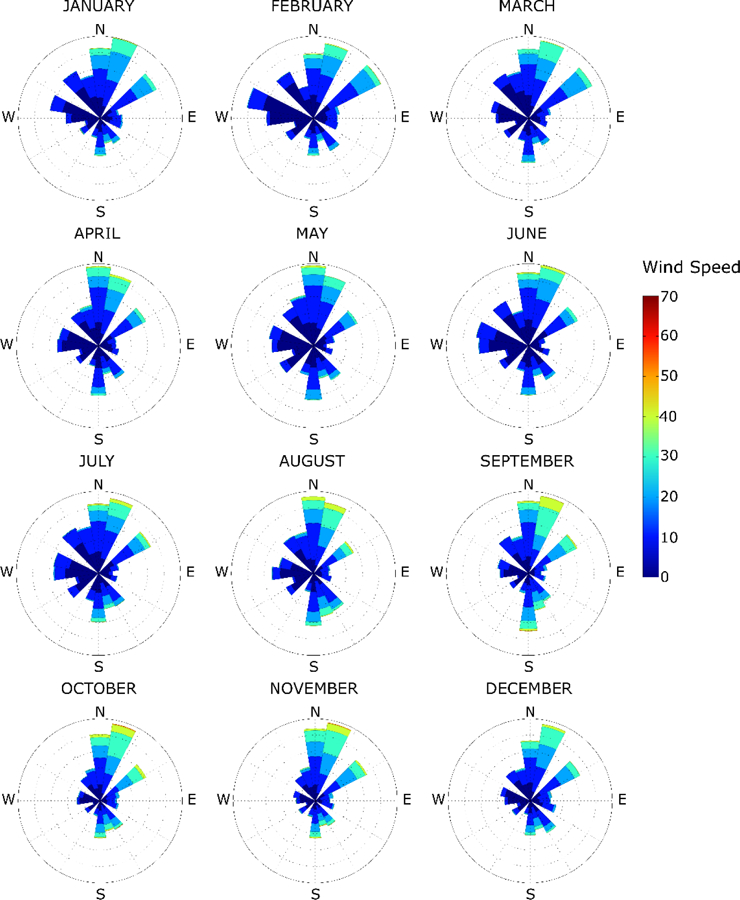
Monthly wind roses for the Airport meteorological station. Data provided by the National Weather Service and cover the period 2003–2013.
Figure A4.
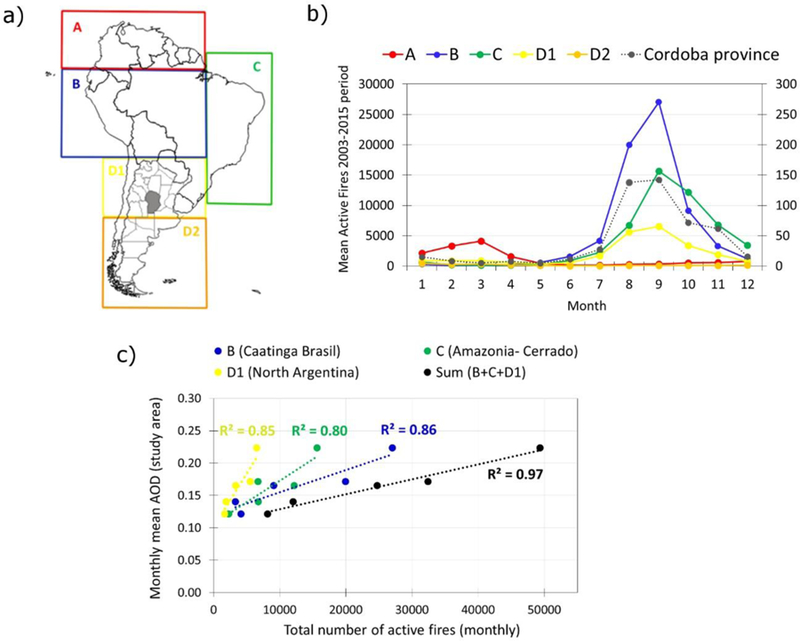
Five regions of South America (A, B, C, D1, D2, colored boxes, chosen for homogeneity with Videla et al., (2013)), and the Córdoba province region within D1 (grey area); b) Mean number of active fires within the 5 regions (left Y-axis) and within the Córdoba province only (right Y-axis) during the 2003–2015 period; c) correlation between the monthly mean AOD in the study area and total number of active fires in the regions B, C and D1, and their sum (number of active fires is from the MODIS product MCD14DL, Giglio et al., 2003).
Figure A5.
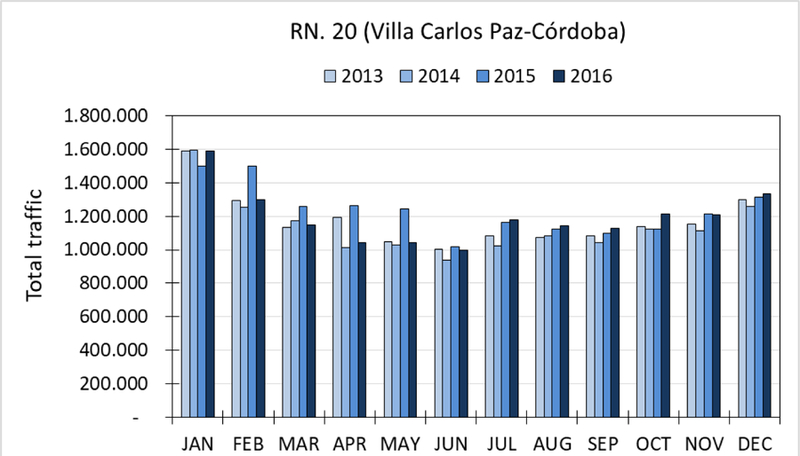
Total vehicle transit recorded at the toll stations in National route 20 (see Figure 1b) during the 24 hours of the day in both directions of circulation (Source: National Directorate of Roads of Argentina, data available for the years 2013, 2014, 2015, 2016)
Figure A6.
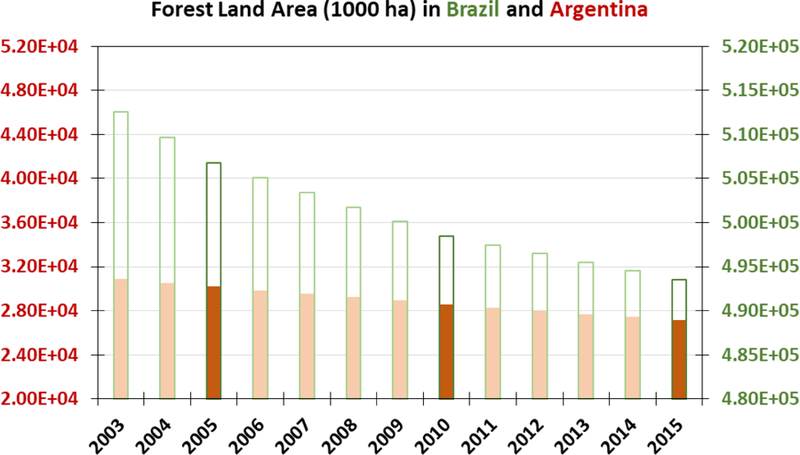
Yearly values of Forest Land Area (unit = 1000 ha) as derived for Argentina (red bars, left y axis) and Brazil (green empty bars, right y axis) over the period 2003–2015 (Source: FAO Statistics Division, Forest Resource Assessment - FRA). Years with darker colour bars are those with official data, light colour bars are FAO estimates (data available at http://faostat.fao.org/)
Figure A7.
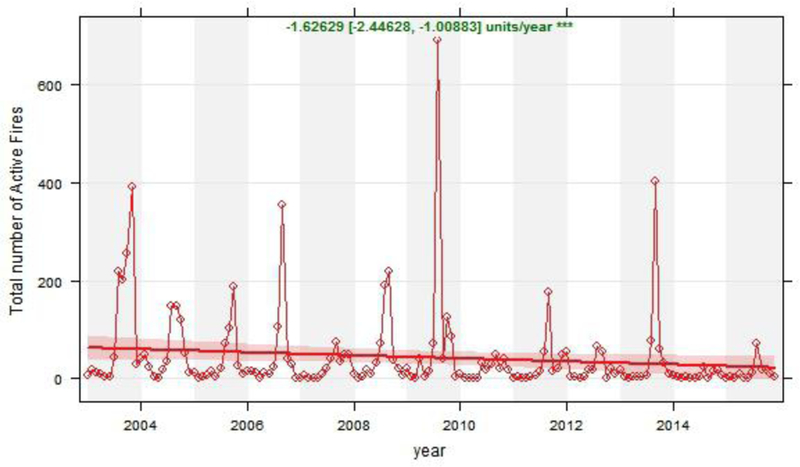
Monthly mean trend of the total number of active fires (from MODIS product MCD14DL) in Córdoba province for the 2003–2015 period and data fit curve (red line). Red area show the 95 % confidence intervals of the fit, determined using Generalized Additive Modelling. The overall slope of the trend [and relevant 95% confidence intervals] are shown at the top of each panel. The *** symbol indicates that the trend is significant to the 0.001 level.
References
- Amato F, Schaap M, van der Gon H, Pandolfi M, Alastuey A, Keuken M, Querol X, 2013. Short-term variability of mineral dust, metals and carbon emission from road dust resuspension. Atmospheric Environment, 74, 134–140. doi: 10.1016/j.atmosenv.2013.03.037 [DOI] [Google Scholar]
- Ancellet G, Pelon J, Totems J Chazette P, Bazureau A, Sicard M, Di Iorio T, Dulac F, Mallet M, 2016. Long-range transport and mixing of aerosol sources during the 2013 North American biomass burning episode: analysis of multiple lidar observations in the western Mediterranean basin. Atmospheric Chemistry and Physics, 16, 4725–4742. doi: 10.5194/acp-16-4725-2016 [DOI] [Google Scholar]
- Andela N, Morton DC, Giglio L, Chen Y, van der Werf GR, Kasibhatla PS, DeFries RS, Collatz GJ, Hantson S, Kloster S, Bachelet D, Forrest M, Lasslop G, Li F, Mangen S, Melton JR, Yue C, Randerson JT, 2017. A human-driven decline in global burned area. Science, 356 (6345), 1356–1362. doi: 10.1126/science.aal4108 [DOI] [PMC free article] [PubMed] [Google Scholar]
- Anderson T, Charlson R, 2003. Mesoscale variations of tropospheric aerosols. Journal of the Atmospheric Sciences, 60, 119–136. doi: [DOI] [Google Scholar]
- Andrade Filho VS, Artaxo P, Hacon S, Carmo CN, Cirino G, 2013. Aerosols from biomass burning and respiratory diseases in children, Manaus, Northern Brazil. Revista de Saúde Pública, 47(2), 239–247. doi: 10.1590/S0034-8910.2013047004011 [DOI] [PubMed] [Google Scholar]
- Andreae MO, Artaxo P, Fischer H, Freitas SR, Grégoire J-M, Hansel A, Hoor P, Kormann R, Krejci R, Lange L, Lelieveld J, Lindinger W, Longo K, Peters W, de Reus M, Scheeren B, Silva Dias MAF, Ström J, van Velthoven PFJ, Williams J, 2001. Transport of biomass burning smoke to the upper troposphere by deep convection in the equatorial region. Geophysical Research Letters, 28 (6), 951–954. doi: 10.1029/2000GL012391 [DOI] [Google Scholar]
- Aragão LEOC, Shimabukuro YE, 2010. The incidence of fire in Amazonian forests with implications for REDD. Science, 328 (5983), 1275–1278, doi: 10.1126/science.1186925 [DOI] [PubMed] [Google Scholar]
- Argañaraz JP, Gavier Pizarro G, Zak MR, Bellis LM, 2015. Fire regime, climate, and vegetation in the Sierras de Córdoba, Argentina. Association for Fire Ecology, Fire Ecology, 11 (1), 55–73. doi: 10.4996/fireecology.1101055 [DOI] [Google Scholar]
- Arkouli M, Ulke AG, Endlicher W, Baumbach G, Schultz E, Vogt U, Müller M, Dawidowski M, Faggi A, Wolf-Benning U, Scheffknecht G, 2010. Distribution and temporal behavior of particulate matter over the urban area of Buenos Aires. Atmospheric Pollution Research, 1 (1), 1–8. doi: 10.5094/APR.2010.001 [DOI] [Google Scholar]
- Arvani B, Bradley R, Lyapustin AI, Wang Y, Ghermandi G, Teggi S, 2016. Seasonal monitoring and estimation of regional aerosol distribution over Po valley, northern Italy, using a high-resolution MAIAC product. Atmospheric Environment, Volume 141, 106–121. doi: 10.1016/j.atmosenv.2016.06.037 [DOI] [Google Scholar]
- Athanasopoulou E, Protonotariou A, Papangelis G, Tombrou M, Mihalopoulos N, Gerasopoulos E, 2016. Long-range transport of Saharan dust and chemical transformations over the Eastern Mediterranean. Atmospheric Environment, 140, 592–604. doi: 10.1016/j.atmosenv.2016.06.041 [DOI] [Google Scholar]
- Baars H, Ansmann A, Althausen D, Engelmann R, Heese B, Müller D, Artaxo P, Paixao M, Pauliquevis T, Souza R, 2012. Aerosol profiling with lidar in the Amazon Basin during the wet and dry season. Journal of Geophysical Research, 117, D21201. doi: 10.1029/2012JD018338 [DOI] [Google Scholar]
- Badarinath KVS, Kharol SK, Chand TRK, 2007. Use of satellite data to study the impact of forest fires over the northeast region of India. IEEE Geoscience and Remote Sensing Letters, 4 (3), 485–489. doi: 10.1109/LGRS.2007.896738 [DOI] [Google Scholar]
- Barnaba F, Gobbi GP, 2004. Aerosol seasonal variability over the Mediterranean region and relative contribution of maritime, continental and Saharan dust particles over the basin from MODIS data in the year 2001. Atmospheric Chemistry and Physics, 4, 2367–2391. doi: 10.5194/acp-4-2367-2004 [DOI] [Google Scholar]
- Barnaba F, Putaud JP, Gruening C, dell’Acqua A, Dos Santos S, 2010. Annual cycle in co-located in situ, total-column, and height-resolved aerosol observations in the Po Valley (Italy): implications for ground-level particulate matter mass concentration estimation from remote sensing. Journal of Geophysical Research, 115, D19209. doi: 10.1029/2009JD013002 [DOI] [Google Scholar]
- Barnaba F, Angelini F, Curci G, Gobbi GP, 2011. An important fingerprint of wildfires on the European aerosol load. Atmospheric Chemistry and Physics, 11, 10487–10501. doi: 10.5194/acp-11-10487-2011 [DOI] [Google Scholar]
- Barnaba F, Bolignano A, Di Liberto L, Morelli M, Lucarelli F, Nava S, Perrino C, Canepari S, Basart S, Costabile F, Dionisi D, Ciampichetti S, Sozzi R, Gobbi GP, 2017. Desert dust contribution to PM10 loads in Italy: Methods and recommendations addressing the relevant European Commission Guidelines in support to the Air Quality Directive 2008/50. In Atmospheric Environment, 161, 288–305. doi: 10.1016/j.atmosenv.2017.04.038 [DOI] [Google Scholar]
- Ben-Ami Y, Koren I, Altaratz O, Kostinski A, and Lehahn Y, 2012. Discernible rhythm in the spatio/temporal distributions of transatlantic dust. Atmospheric Chemistry and Physics, 12, 2253–2262. doi: 10.5194/acp-12-2253-2012 [DOI] [Google Scholar]
- Bilal M, Nichol JE, Spak SN, 2017. A New Approach for Estimation of Fine Particulate Concentrations Using Satellite Aerosol Optical Depth and Binning of Meteorological Variables. Aerosol and Air Quality Research, 17,356–367. doi: 10.4209/aaqr.2016.03.0097 [DOI] [Google Scholar]
- Bogo H, Otero M, Castro P, Ozafrán MJ, Kreiner A, Calvo EJ, Negri RM, 2003. Study of atmospheric particulate matter in Buenos Aires city. Atmospheric Environment, 37 (8), 1135–1147. doi: 10.1016/S1352-2310(02)00977-9 [DOI] [Google Scholar]
- Chen Y,Morton DC, Jin Y, Collatz JG, Kasibhatla PS, van der Werf GR, DeFries RS, Randerson JS, 2014. Long-term trends and interannual variability of forest, savanna and agricultural fires in South America. Carbon Manage, 4 (6), 617–638. doi: 10.4155/cmt.13.61 [DOI] [Google Scholar]
- Chudnovsky A, Kostinski A, Herrmann L, Koren I, Nutesku G, and Ben-Dor E, 2011. Hyperspectral Spaceborne Imaging of Dust-laden Flows: Anatomy of Saharan storm from the Bodele Depression. Remote Sensing of Environment, 115 (4), 1013–1024. doi: 10.1016/j.rse.2010.12.006 [DOI] [Google Scholar]
- Chudnovsky A, Kostinski, Lyapustin A, and Koutrakis P, 2013a. Spatial scales of pollution from variable resolution satellite imaging. Environmental Pollution, 172, 131–138. doi: 10.1016/j.envpol.2012.08.016 [DOI] [PubMed] [Google Scholar]
- Chudnovsky A, Tang C, Lyapustin A, Wang Y, Schwartz J, Koutrakis PA, 2013b. A critical assessment of high-resolution aerosol optical depth retrievals for fine particulate matter predictions. Atmospheric Chemistry and Physics, 13 (21), 10907–10917. doi: 10.5194/acp-13-10907-2013 [DOI] [Google Scholar]
- Chudnovsky AA, Koutrakis P, Kloog I, Melly S, Nordio F, Lyapustin AI, Wang Y, Schwartz J, 2014. Fine particulate matter predictions using high resolution Aerosol Optical Depth (AOD) retrievals. Atmospheric Environment, 89, 189–198. doi: 10.1016/j.atmosenv.2014.02.019 [DOI] [PMC free article] [PubMed] [Google Scholar]
- da Silva Palácios R, da Silva Sallo F, de Souza Nogueira J, 2016. Variability of Aerosol Optical Depth over Cerrado of Mato Grosso, Brazil. Environment and Ecology Research, 4, 99–105. doi: 10.13189/eer.2016.040207 [DOI] [Google Scholar]
- Du Y, Xu X, Chu M, Guo Y, Wang J, 2016. Air particulate matter and cardiovascular disease: the epidemiological, biomedical and clinical evidence. Journal of Thoracic Disease, 8 (1), 8–19. doi: 10.3978/j.issn.2072-1439.2015.11.37 [DOI] [PMC free article] [PubMed] [Google Scholar]
- Emili E, Lyapustin A, Wang Y, Popp C, Korkin S, Zebisch M, Wunderle S, Petitta M, 2011. High spatial resolution aerosol retrieval with MAIAC: Application to mountain regions. Journal of Geophysical Research, 116, D23211. doi: 10.1029/2011JD016297 [DOI] [Google Scholar]
- Engel-Cox JA, Holloman CH, Coutant BW, Hoff RM, 2004. Qualitative and quantitative evaluation of MODIS satellite sensor data for regional and urban scale air quality. Atmospheric Environment, 38 (16), 2495–2509. doi: 10.1016/j.atmosenv.2004.01.039 [DOI] [Google Scholar]
- Engelstaedter S, Washington R, 2007. Temporal controls on global dust emissions: The role of surface gustiness. Geophysical Research Letters, 34, L15805. doi: 10.1029/2007GL029971 [DOI] [Google Scholar]
- FAO-Food and Agriculture Organization of the United Nations, 2016. Global Forest Resources Assessment 2015, ISBN 978–92-5–109283-5. http://www.fao.org/3/a-i4793e.pdf (Accesed 1st June, 2018).
- Gharibvand L, Beeson WL, Shavlik D, Knutsen R, Ghamsary M, Soret S, Knutsen SF, 2017. The association between ambient fine particulate matter and incident adenocarcinoma subtype of lung cancer. Environmental Health 16, 71. doi: 10.1186/s12940-017-0268-7 [DOI] [PMC free article] [PubMed] [Google Scholar]
- Giglio L, Descloitres J, Justice CO, Kaufman YJ, 2003. An Enhanced Contextual Fire Detection Algorithm for MODIS. Remote Sensing of Environment, 87, 273–282. doi: 10.1016/S0034-4257(03)00184-6 [DOI] [Google Scholar]
- Guo Y, Tang Q, Gong DY, Zhang Z, 2017. Estimating ground-level PM2.5 concentrations in Beijing using a satellite-based geographically and temporally weighted regression model. Remote Sensing of Environment, 198, 140–149. doi: 10.1016/j.rse.2017.06.001 [DOI] [Google Scholar]
- Gupta P, Christopher SA, Wang J, Gehrig R, Lee Y, Kumar N, 2006. Satellite remote sensing of particulate matter and air quality assessment over global cities. Atmospheric Environment, 40 (30), 5880–5892. doi: 10.1016/j.atmosenv.2006.03.016 [DOI] [Google Scholar]
- Gupta P, Khan MN, da Silva A, Patadia F, 2013. MODIS aerosol optical depth observations over urban areas in Pakistan: quantity and quality of the data for air quality monitoring. Atmospheric Pollution Research, 4 (1), 43–52. doi: 10.5094/APR.2013.005 [DOI] [Google Scholar]
- Hansen MC, Potapov PV, Moore R, Hancher M, Turubanova SA, Tyukavina A, Thau D, Stehman SV, Goetz SJ, Loveland TR, Kommareddy A, Egorov A, Chini L, Justice CO, Townshend JRG, 2013. High-Resolution Global Maps of 21st-Century Forest Cover Change. Science, 342, 850. doi: 10.1126/science.1244693 [DOI] [PubMed] [Google Scholar]
- Holben BN, Eck TF, Slutsker I, Tanré D, Buis JP, Setzer A, Vermote E, Reagan JA, Kaufman YJ, Nakajima T, Lavenu F, Jankowiak I, Smirnov A, 1998. AERONET—A Federated Instrument Network and Data Archive for Aerosol Characterization. Remote Sensing of Environment, 66 (1), 1–16. doi: 10.1016/S0034-4257(98)00031-5 [DOI] [Google Scholar]
- Hsu NC, Jeong M-J, Bettenhausen C, Sayer AM, Hansell R, Seftor CS, Huang J, Tsay S-C, 2013. Enhanced Deep Blue aerosol retrieval algorithm: The second generation. Journal of Geophysical Research: Atmospheres, 118, 1–20. doi: 10.1002/jgrd.50712 [DOI] [Google Scholar]
- Huang J, Guo J, Wang F, Liu Z, Jeong M-J, Yu H, Zhang Z, 2015. CALIPSO inferred most probable heights of global dust and smoke layers. Journal of Geophysical Research: Atmospheres, 120, 5085–5100. doi: 10.1002/2014JD022898 [DOI] [Google Scholar]
- IARC-International Agency for Research on Cancer, 2013. Monographs on the evaluation of carcinogenic risks to humans: Outdoor air pollution Lyon, France: International Agency for Research on Cancer; ISBN: 978–92-832–0175-5. [Google Scholar]
- Ichoku C, Chu DA, Mattoo S, Kaufman YJ, Remer LA, Tanré D, Slutsker I, Holben BN, 2002. A spatio-temporal approach for global validation and analysis of MODIS aerosol products. Geophysical Research Letters, 29 (12). doi: 10.1029/2001GL013206 [DOI] [Google Scholar]
- INDEC - National Institute of Statistics and Census. Censo Nacional de Población, Hogares y Viviendas y geografía y códigos geográficos del Sistema Estadístico Nacional Buenos Aires: Retrieved 30/08/2017, from http://www.indec.gov.ar/ [Google Scholar]
- Jacobson MZ, 2014. Effect of biomass burning on climate, accounting for heat and moisture fluxes, black and brown carbon, and cloud absorption effects. Journal of Geophysical Research Atmospheres, 119, 8980–9002. doi: 10.1002/2014JD021861 [DOI] [Google Scholar]
- Just AC, De Carli MM, Shtein A, Dorman M, Lyapustin A, Kloog I, 2018. Correcting Measurement Error in Satellite Aerosol Optical Depth with Machine Learning for Modeling PM2.5 in the Northeastern USA. Remote Sensing, 10(5), 803. doi: 10.3390/rs10050803. [DOI] [PMC free article] [PubMed] [Google Scholar]
- Kar J, Vaughan M, Tackett J, Liu Z, Omar A, Rodier S, Trepte C, Lucker P, 2018. Swelling of transported smoke from savanna fires over the Southeast Atlantic Ocean. Remote Sensing of Environment, 211, 105–111. doi: 10.1016/j.rse.2018.03.043. [DOI] [PMC free article] [PubMed] [Google Scholar]
- Kaufman YJ, Tanré D, 1998. Algorithm for remote sensing of tropospheric aerosol form MODIS. MODIS ATBD MOD02, 9, 1–85. [Google Scholar]
- Kharol SK, Badarinath KVS, Sharma AR, Kaskaoutis DG, Kambezidis HD, 2011. Multiyear analysis of Terra/Aqua MODIS aerosol optical depth and ground observations over tropical urban region of Hyderabad, India. Atmospheric Environment, 45, 1532–1542. doi: 10.1016/j.atmosenv.2010.12.047 [DOI] [Google Scholar]
- Kishcha P, da Silva AM, Starobinets B, Alpert P, 2014. Air pollution over the Ganges basin and northwest Bay of Bengal in the early postmonsoon season based on NASA MERRAero data. Journal of Geophysical Research Atmospheres, 119, 1555–1570. doi: 10.1002/2013JD020328 [DOI] [Google Scholar]
- Kishcha P, da Silva A, Starobinets B, Long CN, Kalashnikova O, Alpert P, 2015. Saharan dust as a causal factor of hemispheric asymmetry in aerosols and cloud cover over the tropical Atlantic Ocean. International Journal of Remote Sensing, 36 (13), 3423–3445. doi: 10.1080/01431161.2015.1060646 [DOI] [Google Scholar]
- Kloog I, Sorek-Hamer M, Lyapustin A, Coull B, Wang Y, Just A, Schwartz J, Broday D 2015. Estimating daily PM2.5 and PM10 across the complex geo-climate region of Israel using MAIAC satellite-based AOD data. Atmospheric Environment, 122 409–416. doi: 10.1016/j.atmosenv.2015.10.004 [DOI] [PMC free article] [PubMed] [Google Scholar]
- Lee HJ, Liu Y, Coull BA, Schwartz J, Koutrakis P, 2011. A novel calibration approach of MODIS AOD data to predict PM2.5 concentrations. Atmospheric Chemistry and Physics, 11 (15), 7991–8002. doi: 10.5194/acp-11-7991-2011 [DOI] [Google Scholar]
- Lee M, Kloog I, Chudnovsky A, Lyapustin A, Wang Y, Melly S, Coull B, Koutrakis P, Schwartz J, 2016. Spatiotemporal prediction of fine particulate matter using high-resolution satellite images in the Southeastern US 2003–2011. Journal of Exposure Science and Environmental Epidemiology 26, 377–384. doi: 10.1038/jes.2015.41 [DOI] [PMC free article] [PubMed] [Google Scholar]
- Levy RC, Remer LA, Mattoo S, Vermote EF, Kaufman YJ, 2007. Second-generation operational algorithm: Retrieval of aerosol properties over land from inversion of Moderate Resolution Imaging Spectroradiometer spectral reflectance. Journal of Geophysical Research-Atmospheres, 112(D13), D13211. doi: 10.1029/2006JD007811 [DOI] [Google Scholar]
- Liu L, Mishchenko MI, Geogdzhayev I, Smirnov A, Sakerin SM, Kabanov DM, Ershov OA, 2004. Global validation of two-channel AVHRR aerosol optical thickness retrievals over the oceans. Journal of Quantitative Spectroscopy and Radiative Transfer, 88, 97–109. doi: 10.1016/j.jqsrt.2004.03.031 [DOI] [Google Scholar]
- Liu J, Xia X, Li Z, Wang P, Min M, Hao W, Wang Y, Xin J, Li X, Zheng Y, Chen Z, 2010. Validation of multi-angle imaging spectroradiometer aerosol products in China. Chemical and Physical Meteorology, 62(2), 117–124. doi: 10.1111/j.1600-0889.2009.00450.x [DOI] [Google Scholar]
- López ML, Ceppi S, Palancar GG, Olcese LE, Tirao G, Toselli BM, 2011. Elemental concentration and source identification of PM10 and PM2.5 by SR-XRF in Córdoba City, Argentina. Atmospheric Environment 45, 5450–5457. doi: 10.1016/j.atmosenv.2011.07.003 [DOI] [Google Scholar]
- Lyapustin AI, Wang Y, Laszlo I, Kahn R, Korkin S, Remer L, Levy R, Reid JS, 2011. Multi-angle implementation of atmospheric correction for MODIS (MAIAC): 2.Aerosol algorithm. Journal of Geophysical Research-Atmospheres, 116, D03210. doi: 10.1029/2010JD014986 [DOI] [PMC free article] [PubMed] [Google Scholar]
- Lyapustin A, Wang Y, Laszlo I, Korkin S, 2012. Improved cloud and snow screening in MAIAC aerosol retrievals using spectral and spatial analysis. Atmospheric Measurement Techniques, 5 (4), 843–850. doi: 10.5194/amt-5-843-2012 [DOI] [Google Scholar]
- Macedo MN, DeFries RS, Morton DC, Stickler CM, Galfordd GL, Shimabukuro YE, 2012. Decoupling of deforestation and soy production in the southern Amazon during the late 2000s. Proceedings of the National Academy of Sciences of the United States of America, 109 (4), 1341–1346. doi: 10.1073/pnas.1111374109 [DOI] [PMC free article] [PubMed] [Google Scholar]
- Markowicz KM, Chilinski MT, Lisok J, Zawadzka O, Stachlewska IS, Janicka L, Rozwadowska A, Makuch P, Pakszys P, Zielinski T, Petelski T, Posyniak M, Pietruczuk A, Szkop A, Westphal DL, 2016. Study of aerosol optical properties during long-range transport of biomass burning from Canada to Central Europe in July 2013. Journal of Aerosol Science, 101, 156–173. doi: 10.1016/j.jaerosci.2016.08.006 [DOI] [Google Scholar]
- Martins VS, Lyapustin A, de Carvalho LAS, Barbosa CCF, Novo EMLM, 2017. Validation of high-resolution MAIAC aerosol product over South America. Journal of Geophysical Research, 122 (14), 7537–7559. doi: 10.1002/2016JD026301 [DOI] [Google Scholar]
- Martins VS, Novo EMLM Lyapustin A, Aragão LEOC, Freitas SR, Barbosa CCF, 2018. Seasonal and interannual assessment of cloud cover and atmospheric constituents across the Amazon (2000–2015): Insights for remote sensing and climate analysis. ISPRS Journal of Photogrammetry and Remote Sensing doi: 10.1016/j.isprsjprs.2018.05.013 [DOI] [Google Scholar]
- Meng X, Fu Q, Ma Z, Chen L, Zou B, Zhang Y, Xue W, Wang J, Wang D, Kan H, Liu Y, 2016. Estimating ground-level PM in a Chinese city by combining satellite data, meteorological information and a land use regression model. Environmental Pollution, 208, 177–184. doi: 10.1016/j.envpol.2015.09.042 [DOI] [PubMed] [Google Scholar]
- Miglietta S 1994. Patrón de ocurrencia de fuegos y su efecto sobre la vegetación en el bosque Serrano de Córdoba. Tesis de Maestría, Facultad de Ciencias Exactas, Físicas y Naturales, Universidad Nacional de Córdoba, Córdoba, Argentina: 60 pp. [Google Scholar]
- Misra P, Fujikawa A, Takeuchi W, 2017. Novel Decomposition Scheme for Characterizing Urban Air Quality with MODIS. Remote Sensing, 9 (8), 812. doi: 10.3390/rs9080812 [DOI] [Google Scholar]
- Nepstad D, Mcgrath D, Stickler C, Alencar A, Azevedo A, Swette B, Bezerra T, Digiano M, Shimada J, Da Motta RS, Armijo E, Castello L, Brando P, Hansen MC, Mcgrath-Horn M, Carvalho O, Hess L, 2014. Slowing Amazon deforestation through public policy and interventions in beef and soy supply chains. Science 344, 1118–1123. doi: 10.1126/science.1248525 [DOI] [PubMed] [Google Scholar]
- Nichol JE, Bilal M, 2016. Validation of MODIS 3 km resolution Aerosol Optical Depth retrievals over Asia. Remote Sensing, 8(4), 328. doi: 10.3390/rs8040328 [DOI] [Google Scholar]
- Olcese LE, Toselli BM, 1998. Statistical analysis of PM10 measurements in Córdoba City, Argentina. Meteorology and Atmospheric Physics, 66, 123–130. doi: 10.1007/BF01030452 [DOI] [Google Scholar]
- Olcese LE, Toselli BM, Palancar GG, 1998. Air quality monitoring in the city of Córdoba. Proceedings of the School of Science and Technology, 2, 149–159. [Google Scholar]
- Olcese LE, Palancar GG, Toselli BM, 2001. An inexpensive method to estimate CO and NOx emissions from mobile sources. Atmospheric Environment, 35, 6213–6218. doi: 10.1016/S1352-2310(01)00387-9 [DOI] [Google Scholar]
- Olcese LE, Toselli BM, 2002. Some aspects of air pollution in Córdoba, Argentina. Atmospheric Environment, 36, 299–306. doi: 10.1016/S1352-2310(01)00336-3 [DOI] [Google Scholar]
- Omar A, Winker DM, Tackett JL, Kar J, Liu Z, Vaughan M, Powell K, and Trepte C, 2013. CALIOP and AERONET aerosol optical depth comparisons: One size fits none. Jounal of Geophysical Research Atmospheres, 118, 4748–4766. doi: 10.1002/jgrd.50330 [DOI] [Google Scholar]
- Otero L, Ristori P, D’Elia R, Quel E, 2011. Salt and Smoke Dust Clouds over Mar Chiquita Lake, Córdoba Province, Argentina in August 2009. ANALES Asociación Física Argentina, 22 (1), 98–100. [Google Scholar]
- Prasad AK, Singh RP, Singh A, Kafatos M, 2005. Seasonal Variability of Aerosol Optical Depth over Indian Subcontinent. International Workshop IEEE, 35–38. doi: 10.1109/AMTRSI.2005.1469835 [DOI] [Google Scholar]
- Qin K, Wu L, Wong MS, Letu H, Hu M, Lang H, Sheng S, Teng J, Xiao X, Yuan L, 2016. Trans-boundary aerosol transport during a winter haze episode in China revealed by ground-based Lidar and CALIPSO satellite. Atmospheric Environment, 141, 20–29. doi: 10.1016/j.atmosenv.2016.06.042 [DOI] [Google Scholar]
- Reddington CL, Butt EW, Ridley DA, Artaxo P, Morgan WT, Coe H, Spracklen DV, 2015. Air quality and human health improvements from reductions in deforestation-related fire in Brazil. Nature Geoscience, 8 (10), 768–771. doi: 10.1038/ngeo2535 [DOI] [Google Scholar]
- Remer LA, Tanre D, Kaufman YJ, Ichoku C, Mattoo S, Levy RC, Chu DA, Holben B, Dubovik O, Smirnov A, Martins JV, Li R-R, Ahmad Z, 2002. Validation of MODIS aerosol retrieval over ocean. Geophysical Research Letters, 29, 1618. doi: 10.1029/2001GL013204 [DOI] [Google Scholar]
- Remer LA, Kaufman YJ, Tanre D, Mattoo S, Chu DA, Martins JV, Li RR, Ichoku C, Levy RC, Kleidman RG, Eck TF, Vermote E, Holben BN, 2005. The MODIS aerosol algorithm, products, and validation. Journal of the Atmospheric Sciences, 62, 947–973. doi: 10.1175/JAS3385.1 [DOI] [Google Scholar]
- Remer LA, Tanré D, Kaufman YJ, Levy R, Mattoo S, 2006. Algorithm for remote sensing of tropospheric aerosol from MODIS: Collection 005 product id: mod04/myd04 Available at https://pdfs.semanticscholar.org/566d/19c074f199963abba848ad53b77062d1333d.pdf (Accesed 1st June, 2018).
- Remer LA, Mattoo S, Levy RC, Munchak LA, 2013. MODIS 3 km aerosol product: algorithm and global perspective. Atmospheric Measurement Techniques, 6, 1829–1844. doi: 10.5194/amt-6-1829-2013 [DOI] [Google Scholar]
- Rienecker MM, Suarez MJ, Gelaro R, Todling R, Bacmeister J, Liu E, Bosilovich MG, Schubert SD, Takacs L, Kim GK, Bloom S, Chen J, Collins D, Conaty A, da Silva A, Gu W, Joiner J, Koster RD, Lucchesi R, Molod A, Owens T, Pawson S, Pegion P, Redder CR, Reichle R, Robertson FR, Ruddick AG, Sienkiewick M,Woollen J, 2011. MERRA: NASA’s Modern-Era Retrospective Analysis for Research and Application. Journal of Climate, 24, 3624–3648. doi: 10.1175/JCLI-D-11-00015.1 [DOI] [PMC free article] [PubMed] [Google Scholar]
- Satheesh SK, Suresh Babu S, Padmakumari B, Pandithurai G, Soni VK, 2017. Variability of Atmospheric Aerosols over India. In: Rajeevan M, Nayak S (eds) Observed Climate Variability and Change over the Indian Region. Springer Geology Springer, Singapore: 10.1007/978-981-10-2531-0_13 [DOI] [Google Scholar]
- Sayer AM, Hsu NC, Bettenhausen C, Jeong M-J, 2013. Validation and uncertainty estimates for MODIS Collection 6 “Deep Blue” aerosol data. Journal of Geophysical Research Atmospheres, 118, 7864–7872. doi: 10.1002/jgrd.50600 [DOI] [Google Scholar]
- Schuster GL, Dubovik O, Holben BN, 2006. Angstrom exponent and bimodal aerosol size distributions. Journal of Geophysical Research, 111, 1–14. doi: 10.1029/2005JD00632820411040 [DOI] [Google Scholar]
- Sever L, Alpert P, Lyapustin A, Wang Y, Chudnovsky A, 2017. An example of aerosol pattern variability over bright surface using high resolution MODIS MAIAC: The eastern and western areas of the Dead Sea and environs. Atmospheric Environment, 165, 359–369. doi: 10.1016/j.atmosenv.2017.06.047 [DOI] [PMC free article] [PubMed] [Google Scholar]
- Sharma NP, Sapkota BK, Bhattarai B, Kjeldstad B, 2011. Study on Aerosol Optical Depth in winter and summer season in Bhaktapur. Journal of the Institute of Engineering, 8 (1), 269–276. doi: 10.3126/jie.v8i1-2.5122 [DOI] [Google Scholar]
- Smith LT, Aragão LEOC, Sabel CE, Nakaya T, 2014. Drought impacts on children’s respiratory health in the Brazilian Amazon. Scientific Reports, 4, 3726 (2014). doi: 10.1038/srep03726 [DOI] [PMC free article] [PubMed] [Google Scholar]
- Stachlewska IS, Samson M, Zawadzka O, Harenda KM, Janicka L, Poczta P, Szczepanik D, Heese B, Wang D, Borek K, Tetoni E, Proestakis E, Siomos N, Nemuc A, Chojnicki BH., Markowicz KM, Pietruczuk A, Szkop A, Althausen D, Stebel K, Schuettemeyer D, Zehner C, 2018. Modification of local urban aerosol properties by long-range transport of biomass burning aerosol. Remote Sensing, 10(3), 412. doi: 10.3390/rs10030412 [DOI] [Google Scholar]
- Stafoggia M, Schwartz J, Badaloni C, Bellander T, Alessandrini E, Cattani G, de’ Donato F, Gaeta A, Leone G, Lyapustin A, Sorek-Hamer M, de Hoogh K, Di Q, Forastiere F, Kloog I, 2017. Estimation of daily PM concentrations in Italy (2006–2012) using finely resolved satellite data, land use variables and meteorology. Environment International, 99, 234–244. doi: 10.1016/j.envint.2016.11.024 [DOI] [PubMed] [Google Scholar]
- Stein AF, Toselli BM, 1996. Street level air pollution in Córdoba City, Argentina. Atmospheric Environment, 30, 3491–3495. doi: 10.1016/1352-2310(96)00097-0 [DOI] [Google Scholar]
- Tavera Busso I, Vera A, Mateos AC, Amarillo AC, Carreras H, 2017. Histological changes in lung tissues related with sub-chronic exposure to ambient urban levels of PM 2.5 in Córdoba, Argentina. Atmospheric Environment, 167, 616–624. doi: 10.1016/j.atmosenv.2017.08.061 [DOI] [Google Scholar]
- Tian X, Liu S, Sun L, Liu Q, 2018. Retrieval of Aerosol Optical Depth in the Arid or Semiarid Region of Northern Xinjiang, China. Remote Sensing, 10, 197. doi: 10.3390/rs10020197 [DOI] [Google Scholar]
- Ulke AG, Longo KM, Ribeiro de Freitas S, 2011. Biomass Burning in South America: Transport Patterns and Impacts, Biomass - Detection, Production and Usage, Matovic Darko Dr. (ed.), 10.5772/19264 [DOI] [Google Scholar]
- UNECE, 2004. United Nations Economic Commission for Europe 2004 Clearing the Air: 25 years of the Convention on Long-Range Transboundary Air Pollution, Sliggers J and Kakebeeke W (eds). Available at: www.unece.org/fileadmin/DAM/env/lrtap/ExecutiveBody/BOOKscreen.pdf (Accesed 1st June, 2018).
- Videla FC, Barnaba F, Angelini F, Cremades P, Gobbi GP 2013. The relative role of Amazonian and non-Amazonian fires in building up the aerosol optical depth in South America: A five-year study (2005–2009). Atmospheric Research, 122, 298–309. doi: 10.1016/j.atmosres.2012.10.026. [DOI] [Google Scholar]
- Wang W, Mao F, Pan Z, Du L, Gong W, 2017. Validation of VIIRS AOD through a Comparison with a Sun Photometer and MODIS AODs over Wuhan. Remote Sensing, 9(5), 403. doi: 10.3390/rs9050403 [DOI] [Google Scholar]
- WHO-World Health Organization, 2010. Exposure to Air Pollution: A Major Public Health Concern World Health Organization, Geneva. [Google Scholar]
- WHO-World Health Organization, 2013. Review of evidence on health aspects of air pollution – REVIHAAP Project Technical Report World Health Organization European Centre for Environment and Health, WHO Regional Office for Europe, Bonn. [PubMed] [Google Scholar]
- Xiao Q, Wang Y, Chang HH, Meng X, Geng Lyapustin, A., Liu Y, 2017. Full-coverage high-resolution daily PM estimation using MAIAC AOD in the Yangtze River Delta of China. Remote Sensing of Environment, 19, 437–446. doi: 10.1016/j.rse.2017.07.023 [DOI] [Google Scholar]
- Xie Y, Zhang Y, Xiong X, Qu JJ, Che H, 2011. Validation of MODIS aerosol optical depth product over China using CARSNET measurements. Atmosmospheric Environment, 45(33), 5970–5978. doi: 10.1016/j.atmosenv.2011.08.002 [DOI] [Google Scholar]
- Yi B, Yang P, Dessler A, da Silva AM, 2015. Response of aerosol direct radiative effect to the east Asian summer monsoon. IEEE Geoscience and Remote Sensing Letters, 12, 597–600. doi: 10.1109/LGRS.2014.2352630 [DOI] [Google Scholar]
- Yin XM, Dai T, Xin JY, Gong DY, Yang J, Teruyuki N, Shi GY, 2016. Estimation of aerosol properties over the Chinese desert region with MODIS AOD assimilation in a global model. Advances in Climate Change Research, 7 (1), 90–98. doi: 10.1016/j.accre.2016.04.001 [DOI] [Google Scholar]
- Yu H, Chin M, Bian H, Yuan T, Prospero JM, Omar AH, Remer LA, Winker DM, Yang Y, Zhang Y, Zhang Z, 2015. Quantification of trans-Atlantic dust transport from seven-year (2007– 2013) record of CALIPSO lidar measurements. Remote Sensing of Environment, 159, 232–249. doi: 10.1016/j.rse.2014.12.010. [DOI] [Google Scholar]
- Zhang J, Reid JS, 2010. A decadal regional and global trend analysis of the aerosol optical depth using a data-assimilation grade over-water MODIS and Level 2 MISR aerosol products. Atmospheric Chemistry and Physics, 10, 10949–10963. doi: 10.5194/acp-10-10949-2010 [DOI] [Google Scholar]
- Zhang Y, Yu H, Eck TF, Smirnov A, Chin M, Remer LA, Bian H, Tan Q, Levy R, Holben BN, Piazzolla S, 2012. Aerosol daytime variations over North and South America derived from multiyear AERONET measurements. J. Geophys. Res, 117, D05211. doi: 10.1029/2011JD017242 [DOI] [Google Scholar]
- Zhang J, Xin J, Zhang W, Wang S, Wang L, Xie W, Xiao G, Pan H, Kong L, 2017. Validation of MODIS C6 AOD products retrieved by the Dark Target method in the Beijing–Tianjin–Hebei urban agglomeration, China. Advances in Atmospheric Sciences, 34, 993. doi: 10.1007/s00376-016-6217-5 [DOI] [Google Scholar]


