

One of the primary factors that controls the limit-of-detection (LOD) of protein microarrays and limits the measurement of analytes from complex mixtures, such as serum or blood, is the adventitious adsorption of proteins (other proteins that are present in the analyte mixture and antibodies used for detection).1–14 Herein, we demonstrate protein microarray assays where background adsorption is effectively eliminated (reduced to below detectable levels) through the use of a protein-resistant surface coating. These “zero” background protein microarrays were successfully used to quantify protein analytes in serum with femtomolar LOD and a dynamic range of six orders of magnitude of analyte concentration. These LODs are 100-fold lower when compared to the same protein microarrays spotted on a conventional polymer substrate that displays high binding capacity but significant adventitious protein adsorption. This study also provides the first demonstration of the interrogation of an analyte directly from undiluted whole blood by a protein microarray with a LOD of ≈ 15 fm.
The development of antibody (Ab) microarrays for proteomics and clinical diagnostics has been limited by: i) the availability of high affinity and high specificity antibodies for capture and detection of protein biomarkers; ii) the susceptibility of proteins to denaturation upon adsorption; and ii) the propensity of proteins to avidly adsorb to surfaces, commonly referred to as the “nonspecific adsorption” problem, which can severely limit the ultimate sensitivity of protein microarrays, especially from complex protein mixtures such as plasma and serum.13–17 Motivated by this limitation, we sought to examine whether the elimination of nonspecific adsorption in a protein microarray would offer improvements in the performance of the assay.
We chose a poly(oligo(ethylene glycol) methacrylate) (POEGMA) polymer brush as the microarray substrate, because it can be conveniently grown on glass as a high-density brush that limits protein adsorption from solution.18–20 The procedure used to grow the POEGMA brushes on glass is summarized in Figure 1. We have previously shown that a thickness of POEGMA > 10 nm on gold and silicon oxide resists nonspecific protein adsorption.18,21,22 We specifically chose a thickness of 100 nm for the microarray substrates because we wished to immobilize the capture antibodies (Abc's) onto the polymer brush without covalent coupling, and hypothesized that a thicker brush layer would act as a nanoscale hydrogel, and allow physical absorption of the antibody into the polymer brush after spotting. Ellipsometry in air of POEGMA brushes grown on oxidized silicon wafers under identical conditions indicated a polymer brush thickness of (105 ± 2) nm.
Figure 1.
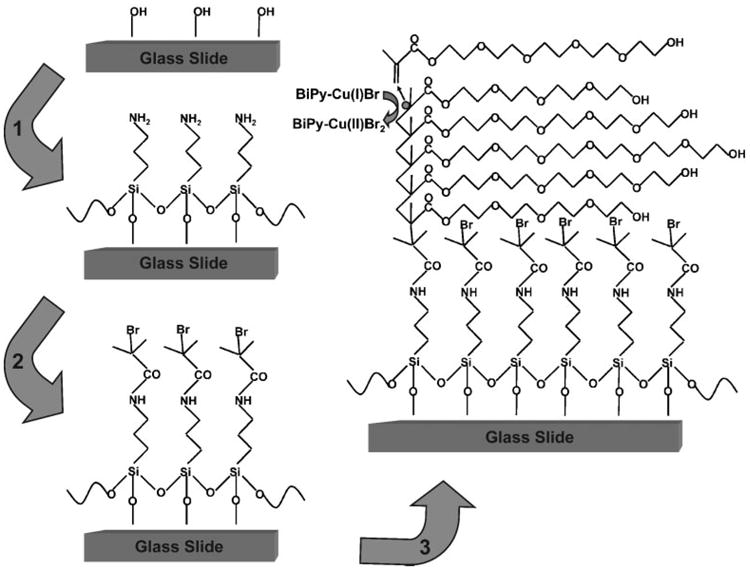
Synthesis of POEGMA brushes on glass via surface-initiated atom-transfer radical polymerization (ATRP). Cleaned slides were functionalized with APTES in step 1, and modified to present an ATRP initiator in step 2. Slides were then immersed in a polymerization solution in step 3, to synthesize surface-tethered brushes of POEGMA.
All capture antibodies were spotted using a noncontact Perkin Elmer Piezorray from aqueous solutions at room temperature and humidity. Capture antibodies were allowed to noncovalently absorb into the 100 nm thick polymer brush during vacuum dessication. After spotting, arrays were dried by placing the spotted slides in a vacuum dessicator containing calcium sulfate (Drierite) at a pressure of 30 KPa. While noncovalently immobilizing proteins on a protein-resistant surface may appear contradictory, this spotting and drying process resulted in stable immobilization of antibody, as arrayed spots of Cy-5-labeled goat anti-rabbit IgG were still visible after high-power sonication in a 1% Tween-20 solution (Fig. S1, Supporting Information (SI)). We hypothesize that vacuum dessication of the POEGMA micro-arrays after spotting of the capture antibodies results in removal of macroscopic “bulk water” from the system, and may lead to protein immobilization through physical entanglement of the antibody and polymer chains and secondary bonding interactions. At the same time, we do not believe that the bound waters of hydration of the antibody are removed under these relatively mild vacuum conditions, so that sufficient interfacial bound water remains to allow retention of the antibody structure and hence its function. Previous studies have demonstrated that PEG-based coatings have the ability to stabilize protein structure.23
An advantage of this noncovalent-immobilization approach over chemical activation of the POEGMA brushes and subsequent covalent attachment of the Abc is the extreme simplicity of the process, as no slide activation and deactivation steps are required.24,25 We also found that the shelf-life of POEGMA-coated glass slides had little impact on the spot quality and subsequent performance of the arrays, as coated slides that had been stored on the bench top in a closed container for up to two months performed similarly to freshly coated slides (data not shown). In contrast, chemically activated slides have a limited shelf-life, especially if the reactive moieties are prone to hydrolysis.26
To examine the performance of antibody arrays spotted on POEGMA, we used human Interleukin-6 (IL-6) and human osteoprotegerin (OPG) Ab arrays to directly interrogate a dilution series of analyte-spiked PBS and analyte-spiked serum (Fig. 2). A fluorescence image of microarray spots for an IL-6 assay in Figure 2A shows the increase in fluorescence intensity with increasing analyte concentration. Remarkably, spots could be visually discriminated from background even at an IL-6 concentration of 100 fg mL−1 (5 fm). Figure 2A also shows that the POEGMA matrix retained its ability to resist nonspecific protein adsorption throughout array fabrication and the subsequent sandwich immunofluorescence assay, as the fluorescence intensity in the background areas surrounding spots measured prior to the assay showed no increase in intensity upon completion of the procedure (the only background fluorescence detected on the POEGMA brushes was due to the autofluorescence of the glass slide). Figure 2A also highlights other important advantages of spotting the Abc's on the polymer brush. First, the concentration-dependent response of the array shows that drying of the arrays after spotting of the Abc did not prevent recognition of the analyte by the Abc, indicating that the it remained functionally active despite the drying process, and that the 100 nm thick POEGMA brush supports the retention of antibody structure and hence function. Second, the uniform morphology of the spots reveals that even after the incubation and rinsing steps in the interrogation of the array, the spotted Abc's remained entrapped in the polymer brush.
Figure 2.
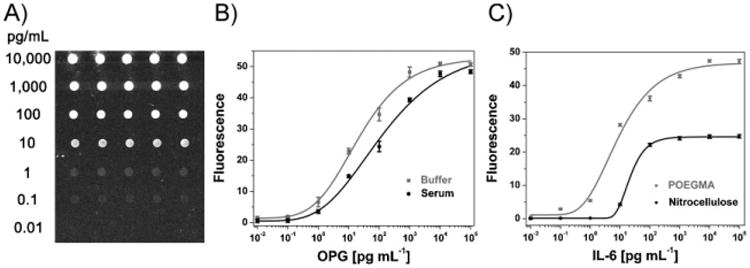
A) Image of a typical IL-6 microarray. B) Dose-response curves of OPG in buffer and serum on POEGMA. C) Dose-response curves of IL-6 in serum on POEGMA and nitrocellulose. In B and C, the ordinate shows the average background-subtracted fluorescence intensity in spots, and the abcissa shows the analyte concentration in solution. Error bars represent one standard deviation.
OPG dose response curves in buffer and serum are shown in Figure 2B, and show that the Abc arrays on POEGMA have virtually identical LODs in buffer and serum. This is in contrast to most other fluorescence immunoassays, where the LOD is typically orders of magnitude greater in complex physiological solutions containing high concentrations of extraneous proteins when compared to LODs determined in buffer.13,14 Storage time of the Ab arrays from 24 h to two weeks also had no obvious effect on array activity. An example of this observation can be seen in Figure 2B – arrayed slides used to produce the two dose-response curves were spotted simultaneously, but the assay in buffer preceded the assay in serum by two weeks.
To compare the performance of these arrays against a commonly used array material, we also spotted the same Abc on a commercially available nitrocellulose membrane (Whatman), which is commonly used because of its ability to provide high densities of the immobilized capture antibody, and hence high signal. The fluorescence response of IL-6 specific antibody arrays spotted on nitrocellulose and POEGMA as a function of IL-6 concentration in serum are shown in Figure 2C. Arrays printed on nitrocellulose were processed according to the manufacturer's suggested protocol, which included stringent blocking and rinsing steps to decrease the background signal due to nonspecific adsorption, while those printed on the POEGMA brushes were processed without a blocking step and less stringent rinsing conditions (see Experimental for details).
Analysis of the data showed that the fluorescence signal from the Abc spots on nitrocellulose was statistically different from that of a control spot that was exposed to serum with no added analyte only down to a concentration of 10 pg mL−1, whereas the signal on POEGMA was statistically different from the negative control down to a concentration of 100 fg mL−1. These results translate to a LOD for IL-6 on POEGMA of 100 fg mL−1 (which corresponds to 5 fm) while the same assay on nitrocellulose yielded a LOD of 10 pg mL−1. The surface density of the Abc on nitrocellulose was greater than on POEGMA, as was the background signal due to nonspecific adsorption, so the improved performance of arrays spotted on POEGMA compared to nitrocellulose cannot be attributed to the loading density of the capture antibody in the microarray spots. Instead, these results indicate that the elimination of background fluorescence due to suppression of nonspecific binding of proteins (such as the analyte, detection antibody, streptavidin, or other cross-reactive proteins present in serum) is the critical feature that allowed arrays on POEGMA to achieve a LOD that is at least two orders of magnitude lower than on nitrocellulose.
The dose-response curves in Figure 2C also show that arrays spotted on POEGMA brushes provided an improved dynamic range over arrays spotted on nitrocellulose, as they span protein concentrations up to six orders of magnitude, in comparison to 2–3 orders of magnitude dynamic range of arrays spotted on nitrocellulose. The LODs and dynamic range for all analytes are summarized in Table 1. With one exception, all analytes had a LOD of 100 fg mL−1 and a 6-log dynamic range. OPG was the only exception, with a 10-fold greater LOD of 1 pg mL−1, presumably because of the lower affinity of OPG for its Abc compared to the antibodies used for the other analytes. These results illustrate that the POEGMA brush is a robust platform for the sensitive detection of diverse protein analytes by an antibody microarray, but also highlight the important point that the LOD and dynamic range of an analyte are also dependent upon the affinity of the antibody for that analyte.
Table 1.
Limit-of-detection (LOD) and dynamic range of microarray assays on POEGMA brush for five different protein analytes.
| Analyte | LOD | Dynamic Range |
|---|---|---|
| IL-6 | 100 fg mL−1 | 100 fg mL−1–10 ng mL−1 |
| IL-1β | 100 fg mL−1 | 100 fg mL−1–10 ng mL−1 |
| TNF-α | 100 fg mL−1 | 100 fg mL−1–10 ng mL−1 |
| IL-8 | 100 fg mL−1 | 100 fg mL−1–10 ng mL−1 |
| OPG | 1 pg mL−1 | 1 pg mL−1–10 ng mL−1 |
We and others have previously shown that POEGMA brushes are resistant to the binding of various cell types.19,21,27 Although these cell-adhesion experiments were not carried out in blood, they suggested the intriguing possibility that arrays spotted on POEGMA may allow the interrogation of an analyte from whole undiluted blood. This possibility is of great interest, because it would allow assays to be developed that would require no sample processing, so that they could be carried out in a point-of-care setting, or alternatively, could reduce the time, complexity, and cost of assays in a clinical setting. The results for an IL-6 assay carried out in whole, heparinized blood spiked with IL-6 are shown in Figure 3. A concentration-dependent response was obtained for the range of concentrations from 300 fg mL−1 to 10 ng mL−1. In comparison, equivalent arrays used to probe analyte-spiked serum exhibit a concentration-dependent response from 100 fg mL−1 to 10 ng mL−1 (Fig. 2C). The cause of the three-fold greater LOD of 300 fg mL−1 (15 fM) in blood compared to 5 fm in serum is currently under investigation, as are efforts to reduce the LOD. Nevertheless, the current LOD for IL-6 suggests that ultrasensitive assays from whole blood are feasible using this platform.
Figure 3.

Dose-response curve for an IL-6 microarray interrogated from whole blood. The LOD of the microarray in blood is ≈15 fm. Error bars represent one standard deviation.
There are numerous strategies capable of improving the performance of immunoassays. Examples include the nanoparticle-based “Bio-barcode” assay and silicon-nanowire-based approaches, both of which rely on novel, yet somewhat elaborate, materials or methods.28,29 There are also strategies that focus on sensitivity improvement through signal amplification, such as immuno-polymerase chain reaction (PCR) and rolling circle amplification.30,31 While elegant in their design, these methods may not represent the most practical options, due to the increased complexity that they entail. In contrast, we believe that our approach has the desirable feature of being based on an existing and widely accepted sandwich fluoroimmunoassay format, so that its implementation to yield femtomolar LODs and a 6-log dynamic range only requires the substitution of currently used array substrates with a POEGMA brush on glass.
In conclusion, we have demonstrated the fabrication of antibody arrays on POEGMA brushes with several significant features. First, the noncovalent adsorption of antibodies provides a simple and robust procedure for the stable immobilization of the capture antibody, which avoids the need for chemical activation and deactivation of the surface. Second, spotted antibody microarrays have a shelf-life of at least several weeks, with no loss in performance. Third, antibody arrays spotted on the POEGMA brushes require only minimal washing steps, and do not require blocking steps during interrogation of the array, which greatly simplifies the assay and reduces the time required to perform the assay. Finally, the resistance of the POEGMA brushes to protein adsorption from solution eliminates background noise in the microarrays stemming from adventitious protein adsorption, and leads to LODs as low as 100 fg mL−1 in serum (which corresponds to 5 fm for IL-6), and 15 fm in whole blood. The femtomolar LODs in serum and blood and the wide dynamic range of antibody arrays spotted on POEGMA brushes suggest that these microarrays will be useful for the quantification of low-abundance protein biomarkers directly from complex mixtures with minimal sample pre-processing, with application in proteomics and clinical diagnostics.
Experimental
Surface-initiated atom-transfer radical polymerization of POEGMA on Glass and Characterization
All reagents for the synthesis of the POEGMA brushes were obtained from Sigma–Aldrich. The POEGMA brushes were fabricated on glass as follows (Fig. 1). First, glass slides (VWR) were cleaned in a solution of H2SO4:H2O2 (3:1) for 30 min. After rinsing with deionized H2O and drying, the cleaned slides were immersed in aminopropyltriethoxysilane (10%) in ethanol for 30 min, and were then rinsed with ethanol and dried at 120°C for 3 h (step 1). Slides were then immersed in a solution of bromoisobutyryl bromide (1%) and triethylamine (1%) in dichloromethane for 30 min, rinsed with dichloromethane and ethanol, and blown dry with N2 (step 2). Slides were then immersed for 12 h at room temperature in a degassed polymerization solution of Cu(I)Br (5 mg mL−1), bipyridine (12 mg mL−1) and oligo(ethylene glycol) methacrylate (Mn = 360, 300 mg mL−1) under argon (step 3). Finally, slides were rinsed with deionized H2O and blown dry with N2. The thickness of POEGMA on glass was inferred by measurement of the thickness of a POEGMA brush that was grown on an oxidized silicon wafer under identical conditions by ellipsometry in air using a M-88 spectroscopic ellipsometer (Woollam).
Spotting of Antibody Microarrays
All capture antibodies and the biotinylated detection antibodies for the following analytes were obtained from R&D Systems: IL-6, human Interleukin-1β (IL-1β), human tumor necrosis factor (TNF-α), human interleukin-8 (IL-8), and OPG. All Abc's (50 μg mL−1 in PBS) were spotted using a noncontact PerkinElmer Piezorray onto POEGMA brushes on glass at room temperature and humidity, and allowed to noncovalently absorb into the 100 nm thick polymer brush under vacuum dessication (30 KPa).
Multiplexed Sandwich Immunoassay
Arrays on POEGMA were first incubated with a dilution series of analyte-spiked PBS (100 μL), analyte-spiked undiluted fetal bovine serum (Gibco), or analyte-spiked rabbit whole blood (30 units mL−1 heparin, Pel-Freez Biologicals) for 4 h with orbital rotation at 30 rpm. The range of concentrations of each analyte in the assay spanned 1 fg mL−1 to 100 ng mL−1. After incubation of the microarrays with the analyte solution, they were incubated with biotinylated secondary antibody (100 μL, 10 μg mL−1) in PBS with BSA (1% (w/v)) for 1 h. Finally, the arrays were developed by incubation in streptavidin-Cy5 (100 μL, 1 μg mL−1) in PBS with BSA (1% (w/v)) for 30 min. After each incubation step, arrays were washed twice for 30 s with BSA (1% (w/v)) and Tween-20 (0.1% (w/v)) in PBS. Arrays were imaged on an Axon Genepix 4200 scanner. Assays on nitrocellulose substrates (Whatman) were performed according to the manufacturer's suggested protocol: First, slides were blocked for 1 h with 100 μL of Whatman Protein Array Blocking Buffer. Next, slides were incubated with the same dilution series of IL-6 spiked undiluted fetal bovine serum (Gibco) used in the POEGMA assay. Incubation took place for 4 h with orbital rotation at 30 rpm. The range of concentrations of IL-6 in the assay spanned from 1 fg mL−1 to 100 ng mL−1. After incubation of the microarray with the analyte solution, the arrays were incubated with biotinylated secondary antibody (100 μL, 10 μg mL−1) in PBS with BSA (1% (w/v)) for 1 h. Finally, the arrays were developed by incubation in streptavidin-Cy5 (100 μL, 1 μg mL−1) in PBS with BSA (1% (w/v)) for 30 min. After each incubation step, arrays were washed five times for 30 s with BSA (1% (w/v)) and Tween-20 (0.1% (w/v)) in PBS. Arrays were imaged using an Axon Genepix 4200 scanner. Whatman states that optimized microarray assays performed on their nitrocellulose substrates are capable of quantifying IL-6 from 3 pg mL−1 to 3 ng mL−1, which correlates well with the dose response curve we produced using their substrates, shown in Figure 2C. The LOD was defined as the lowest concentration for which the background-subtracted fluorescence signal was greater than three standard deviations (3σ) above the average signal from Abc spots that were exposed to serum with no analyte. The dynamic range was defined as the range of concentrations from the LOD to the greatest concentration that had a fluorescence signal greater than 3σ of the signal from the next lower concentration in the dilution series.
Curve Fitting
Data were fit to a five-parameter logistic [32] (5-PL) fit by the following equation:
where x and y are the dose and the response, respectively, p is the parameter vector of the 5-PL logistic, and a, b, c, d, and gare its parameters. Parameter estimation was performed by a large-scale trust-region reflexive Newton algorithm using MATLAB (Version 6.5).
Supplementary Material
Acknowledgments
This research was supported by a grant to A.C. from the Wallace H. Coulter Foundation and an IGERT fellowship from the National Science Foundation to A.H. We thank A. Risinger of PerkinElmer for his assistance with the Piezorray. Supporting Information is available online from Wiley InterScience or from the author.
Contributor Information
Angus Hucknall, Department of Biomedical Engineering, Duke University, Box 90281, Durham, North Carolina 27708-0281 (USA); Center for Biologically Inspired Materials and Material Systems, Duke University, Durham, NC, 27708 (USA).
Dr. Dong-Hwan Kim, Department of Biomedical Engineering, Duke University, Box 90281, Durham, North Carolina 27708-0281 (USA)
Dr. Srinath Rangarajan, Center for Biologically Inspired Materials and Material Systems, Duke University, Durham, NC, 27708 (USA)
Dr. Ryan T. Hill, Center for Biologically Inspired Materials and Material Systems, Duke University, Durham, NC, 27708 (USA)
Prof. William M. Reichert, Department of Biomedical Engineering, Duke University, Box 90281, Durham, North Carolina 27708-0281 (USA)
Prof. Ashutosh Chilkoti, Department of Biomedical Engineering, Duke University, Box 90281, Durham, North Carolina 27708-0281 (USA); Center for Biologically Inspired Materials and Material Systems, Duke University, Durham, NC, 27708 (USA)
References
- 1.Angenendt P, Lehrach H, Kreutzberger J, Glökler J. Proteomics. 2005;5:420. doi: 10.1002/pmic.200400955. [DOI] [PubMed] [Google Scholar]
- 2.Haab BB. Proteomics. 2003;3:2116. doi: 10.1002/pmic.200300595. [DOI] [PubMed] [Google Scholar]
- 3.Kingsmore SF. Nat Rev Drug Discovery. 2006;5:310. doi: 10.1038/nrd2006. [DOI] [PMC free article] [PubMed] [Google Scholar]
- 4.Kusnezow W, Hoheisel JD. J Mol Recognition. 2003;16:165. doi: 10.1002/jmr.625. [DOI] [PubMed] [Google Scholar]
- 5.MacBeath G. Nat Genet. 2002;32:526. doi: 10.1038/ng1037. [DOI] [PubMed] [Google Scholar]
- 6.Pavlickova P, Schneider EM, Hug H. Clin Chim Acta. 2004;343:17. doi: 10.1016/j.cccn.2004.01.009. [DOI] [PubMed] [Google Scholar]
- 7.Wilson DS, Nock S. Angew Chem Int Ed. 2003;42:494. doi: 10.1002/anie.200390150. [DOI] [PubMed] [Google Scholar]
- 8.Wingren C, Borrebaeck CAK. Expert Rev Proteomics. 2004;1:355. doi: 10.1586/14789450.1.3.355. [DOI] [PubMed] [Google Scholar]
- 9.Wingren C, Borrebaeck CAK. Omics. 2006;10:411. doi: 10.1089/omi.2006.10.411. [DOI] [PubMed] [Google Scholar]
- 10.Zhu H, Bilgin M, Snyder M. Annu Rev Biochem. 2003;72:783. doi: 10.1146/annurev.biochem.72.121801.161511. [DOI] [PubMed] [Google Scholar]
- 11.Kusnezow W, Syagailo YV, Rüffer S, Klenin K, Sebald W, Hoheisel JD, Gauer C, Goychuk I. Proteomics. 2006;6:794. doi: 10.1002/pmic.200500149. [DOI] [PubMed] [Google Scholar]
- 12.Kusnezow W, Syagailo YV, Goychuk I, Hoheisel JD, Wild DG. Expert Rev Mol Diagn. 2006;6:111. doi: 10.1586/14737159.6.1.111. [DOI] [PubMed] [Google Scholar]
- 13.Selby C. Ann Clin Biochem. 1999;36:704. doi: 10.1177/000456329903600603. [DOI] [PubMed] [Google Scholar]
- 14.Wood WG. Scand J Clin Lab Invest. 1991;51:105. [Google Scholar]
- 15.Schena M, Shalon D, Davis RW, Brown PO. Science. 1995;270:467. doi: 10.1126/science.270.5235.467. [DOI] [PubMed] [Google Scholar]
- 16.Mantripragada KK, Buckley PG, de Ståhl TD, Dumanski JP. Trends Genet. 2004;20:87. doi: 10.1016/j.tig.2003.12.008. [DOI] [PubMed] [Google Scholar]
- 17.Stoughton RB. Annu Rev Biochem. 2005;74:53. doi: 10.1146/annurev.biochem.74.082803.133212. [DOI] [PubMed] [Google Scholar]
- 18.Ma H, Li D, Sheng X, Zhao B, Chilkoti A. Langmuir. 2006;22:3751. doi: 10.1021/la052796r. [DOI] [PubMed] [Google Scholar]
- 19.Tugulu S, Klok HA. Biomacromolecules. 2008;9:906. doi: 10.1021/bm701293g. [DOI] [PubMed] [Google Scholar]
- 20.Brown AA, Khan NS, Steinbock L, Huck WTS. Eur Polym J. 2005;41:1757. [Google Scholar]
- 21.Ma H, Hyun J, Stiller P, Chilkoti A. Adv Mater. 2004;16:338. [Google Scholar]
- 22.Ma H, Wells M, Beebe TP, Jr, Chilkoti A. Adv Funct Mater. 2006;16:640. [Google Scholar]
- 23.Michel R, Pasche S, Textor M, Castner DG. Langmuir. 2005;21:12327. doi: 10.1021/la051726h. [DOI] [PMC free article] [PubMed] [Google Scholar]
- 24.Tugulu S, Arnold A, Sielaff I, Johnson K, Klok HA. Biomacromolecules. 2005;6:1602. doi: 10.1021/bm050016n. [DOI] [PubMed] [Google Scholar]
- 25.Lee BS, Chi YS, Lee KB, Kim YG, Choi IS. Biomacromolecules. 2007;8:3922. doi: 10.1021/bm7009043. [DOI] [PubMed] [Google Scholar]
- 26.Gong P, Grainger DW. Surf Sci. 2004;570:67. [Google Scholar]
- 27.Xu FJ, Li YL, Kang ET, Neoh KG. Biomacromolecules. 2005;6:1759. doi: 10.1021/bm050071w. [DOI] [PubMed] [Google Scholar]
- 28.Goluch ED, Nam JM, Georganopoulou DG, Chiesl TN, Shaikh KA, Ryu KS, Barron AE, Mirkin CA, Liu C. Lab Chip. 2006;6:1293. doi: 10.1039/b606294f. [DOI] [PubMed] [Google Scholar]
- 29.Lauhon LJ, Gudiksen MS, Wang D, Lieber CM. Nature. 2002;420:57. doi: 10.1038/nature01141. [DOI] [PubMed] [Google Scholar]
- 30.Sano T, Smith CL, Cantor CR. Science. 1992;258:120. doi: 10.1126/science.1439758. [DOI] [PubMed] [Google Scholar]
- 31.Schweitzer B, Roberts S, Grimwade B, Shao W, Wang M, Fu Q, Shu Q, Laroche I, Zhou Z, Tchernev VT, Christiansen J, Velleca M, Kingsmore S. Nat Biotechnol. 2002;20:359. doi: 10.1038/nbt0402-359. [DOI] [PMC free article] [PubMed] [Google Scholar]
- 32.Gottschalk PG, Dunn JR. Anal Biochem. 2005;343:54. doi: 10.1016/j.ab.2005.04.035. [DOI] [PubMed] [Google Scholar]
Associated Data
This section collects any data citations, data availability statements, or supplementary materials included in this article.