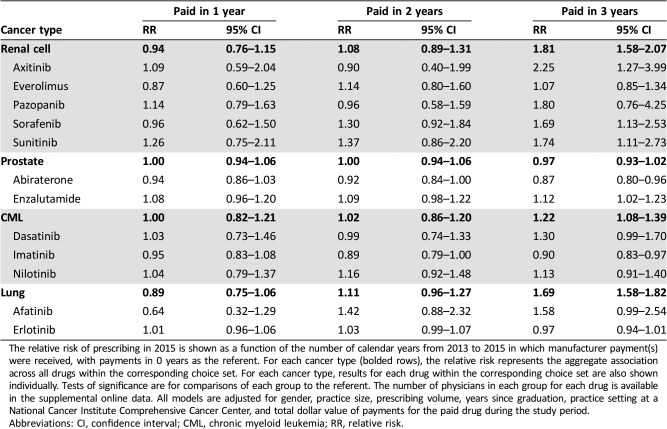
Table 2. Number of years of payments.
The relative risk of prescribing in 2015 is shown as a function of the number of calendar years from 2013 to 2015 in which manufacturer payment(s) were received, with payments in 0 years as the referent. For each cancer type (bolded rows), the relative risk represents the aggregate association across all drugs within the corresponding choice set. For each cancer type, results for each drug within the corresponding choice set are also shown individually. Tests of significance are for comparisons of each group to the referent. The number of physicians in each group for each drug is available in the supplemental online data. All models are adjusted for gender, practice size, prescribing volume, years since graduation, practice setting at a National Cancer Institute Comprehensive Cancer Center, and total dollar value of payments for the paid drug during the study period.
Abbreviations: CI, confidence interval; CML, chronic myeloid leukemia; RR, relative risk.

