Abstract
Spirometry testing plays an important role in the diagnosis and management of COPD and asthma in the primary care setting. Verifying the accuracy of the spirometer, using accurate patient demographics and appropriate reference equations, and ensuring the competency of testing personnel are key components of spirometry test interpretation. Spirometry testing plays an important role in the diagnosis and management of lung disease in the primary care setting. Spirometry interpretation should include an assessment of test quality and be based on sound statistical principals.
Keywords: spirometry, respiratory function tests, primary care, lower limit of normal
INTRODUCTION
Spirometry testing plays an important role in the diagnosis and management of Chronic Obstructive Pulmonary Disease (COPD) and asthma [1–3]. In addition, a restrictive spirometry pattern can prompt additional testing (e.g., lung volumes, diffusing capacity) to diagnose restrictive abnormalities like interstitial lung disease [4]. The clinical impact of spirometry data on patient care is considerable; however, primary care providers must be able to interpret spirometry testing accurately [3, 4]. Spirometry interpretation is not limited to evaluating physiologic patterns, but also pre-test procedures and test quality. While the quality of office spirometry has raised questions about its usefulness [5, 6], it is possible to obtain quality spirometry data in primary care settings [3, 7]. This paper will review basic concepts for the collection of quality spirometry data and test interpretation. More detailed information about spirometry testing and test interpretation can be found elsewhere [4, 8].
PRETEST PROCEDURES
Spirometer calibration verification
The 2005 American Thoracic Society/European Respiratory Society (ATS/ERS) spirometry guidelines recommend that spirometers have the device calibration verified daily with a 3 L calibration syringe [8]. Slow, intermediate, and fast flows should result in recorded values of 3 L ± 3.5% (2.9 L–3.1 L). Some manufacturers will indicate that their spirometer “doesn’t require calibration.” A more accurate phrasing of this claim is that many of these spirometers “cannot be calibrated,” because the device is calibrated when manufactured; however, this calibration should still be verified daily and whenever a flow sensor is changed [8]. Spirometers that fail calibration verification must be taken out of service until the malfunction is rectified.
Testing personnel performance
Poorly trained, incompetent testing personnel are the primary cause of low-quality spirometry tests. Several studies have shown that most patients, even the very young and elderly, can produce acceptable and repeatable spirometry tests with appropriate coaching and instructions from testing personnel [9–11]. Testing personnel must be adequately trained including classroom education and extensive practice [6, 12, 13]. Recruiting a pulmonary function technologist from an affiliated pulmonary function laboratory to provide education and mentoring is recommended. It is important that personnel perform testing on a regular basis; knowledge, skill retention, and interest will decline if personnel are infrequently asked to perform spirometry. A critical quality assurance procedure is testing personnel performance monitoring and feedback [14, 15]. An attainable goal is that 90% of tests performed should satisfy ATS/ERS acceptability and repeatability standards. Borg et al. [16] showed a significant improvement in test quality when technologists in an accredited pulmonary function laboratory received ongoing feedback on their testing performance. This type of quality assurance program can also be applied to primary care personnel. Initially performance audits can be done monthly, once sustained periods of good performance are achieved quarterly audits may be appropriate. Recruiting a pulmonary function technologist from an affiliated pulmonary function laboratory or a competent clinician working in a primary care setting to provide oversight, feedback, and mentoring is recommended.
Gathering accurate demographics
Spirometry data collected from a patient must be compared with data collected from biologic peers who are nonsmokers with disease-free lungs. Healthy lung size and function is dependent on four key variables: age, sex, height, and race. Lung growth is complete by early adulthood and later declines as senescent changes occur. Accordingly, an accurate age should be used to calculate expected spirometry values. Using a rounded age, instead of birth date can introduce significant bias, especially in children [17]. Sex is an important determinant of pulmonary function. Males have larger lungs than females of the same age, height, and race. The difference in lung size between sexes is greatest after childhood.
Height, as an estimate of chest size, is also used to calculate expected spirometry values. Height should be measured without shoes, with the patient standing up straight, and with the ear canal and lower margin of the orbital socket aligned on a horizontal plane (Frankfort plane). For patients with spinal deformities or unable to stand, arm span can be used to estimate height; however, the spirometer software should be capable of applying correction factors to account for age, race, and sex differences in the arm span to height ratio [18]. Self-reported heights are unreliable and should not be used.
Racial differences in lung capacity must also be accounted for when performing spirometry testing. Most notably, patients with African and Southeast Asian ancestry are expected to have smaller lungs than Caucasians, Latinos, and patients with North Asian (e.g., North China, Korea) ancestry [19]. As an example, Kim et al. [20] showed that in healthy nonsmokers, 30% of Southeast Asians had abnormal lung function when a reference equation that did not account for race was utilized.
Selecting a reference equation
Reference equations are derived from healthy, nonsmoking subjects. Lung function values and the normal subject’s age, height, sex, and race are used to develop an expected range of values that can be used to compare recorded values from patients with similar demographics. If the patient’s values fall within the range found in normal subjects, their lung function is regarded as normal. If the patient’s values fall below the range found in normal subjects, their lung function is regarded as abnormal. Values above the normal range are of no clinical consequence; however, values significantly higher than the normal range (e.g., 160% of predicted) should raise suspicions of inaccuracy (e.g., incorrect demographic entry, inaccurate spirometer). The choice of reference equations and how normal ranges are defined can have a significant impact on test interpretation. Ideally, a single reference equation is used to cover a patient’s life-span and should include representation from multiple ethnic groups, such as the Global Lung Function Initiative (GLI) equations published in 2012 [19]. When the age range of a reference equation is limited (i.e., pediatric or adult ages only) the spirometer software will be programed to patch together several different reference equations to cover all ages. When different reference equations are patched together, shifting in predicted values may occur when the patient matriculates to the next reference equation. This phenomenon has been called the “switching and stitching of reference equations” and can give the false impression that a patient’s lung function has changed [21]. In addition, many commonly used reference equations use unreliable correction factors to account for racial differences in pulmonary function. The GLI reference equations include sampling from Caucasian, African-American, Northern Asian, and Southeast Asian populations. Subjects from other ethnic groups or mixed race can be evaluated with a composite equation developed from the average values derived from the other races. Reference equations for specific groups (e.g., indigenous communities) should be used if available. The GLI reference equations have been endorsed by several international societies including the ATS and ERS.
Test quality and common errors
Unlike most diagnostic testing (e.g., blood tests, radiology), spirometry testing requires the patient to perform strenuous and precise physical maneuvers to capture accurate data. Specifically, the patient must inhale completely to total lung capacity and, without delay, blast the air from the lungs with maximum effort. The tongue and laryngeal structures must not obstruct airflow from the chest. The patient must maintain this action until the lung volume is near residual volume. Forced exhalation must continue for at least 6 s in adults and 3 s in children [8]. Once the patient has exhaled satisfactorily, the patient is instructed to inhale quickly back to total lung capacity. The addition of an inspiratory maneuver allows the recording of a full flow-volume loop graph. ATS/ERS spirometry acceptability and repeatability criteria are listed in Table 1. Acceptability criteria are intended to exclude erroneous efforts and data. Repeatability criteria increase confidence in the reported data since submaximal efforts are less likely to be repeatable [8].
TABLE 1. American Thoracic Society/European Respiratory Society spirometry quality criteria [8].
| Acceptability |
|---|
| Free of artifacts |
| Cough |
| Glottis closure |
| Early termination |
| Submaximal effort |
| Leaks |
| Obstructed mouthpieces |
| Back extrapolated volume <5% of FVC or 0.15 L, whichever is greater |
| Expiratory time ≥ 6 s, 3 s for children or plateau in the volume-time curve or when the patient cannot or should not continue to exhale |
|
Repeatability |
| A minimum of three acceptable tests should be obtained |
| The two largest FVC should be within .15 L of each other |
| The two largest FEV1 should be within .15 L of each other |
Note: FVC, forced vital capacity; FEV1 , forced expiratory volume in the first second.
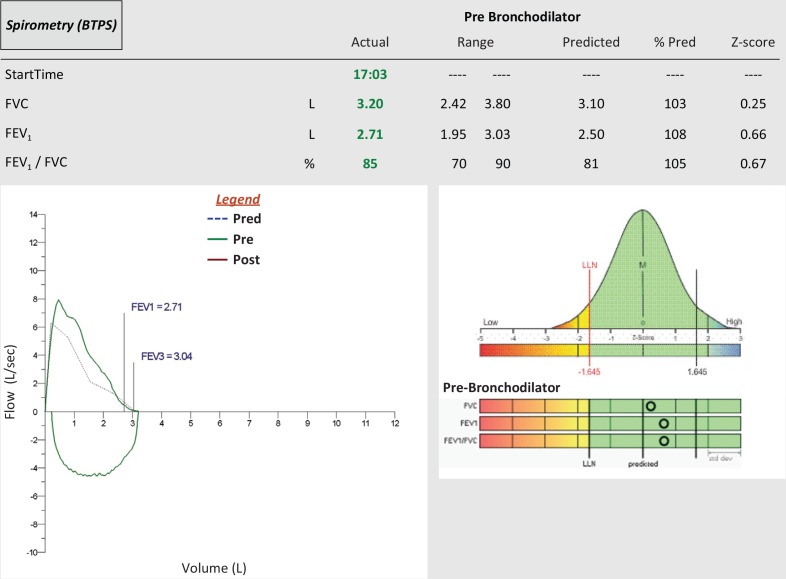
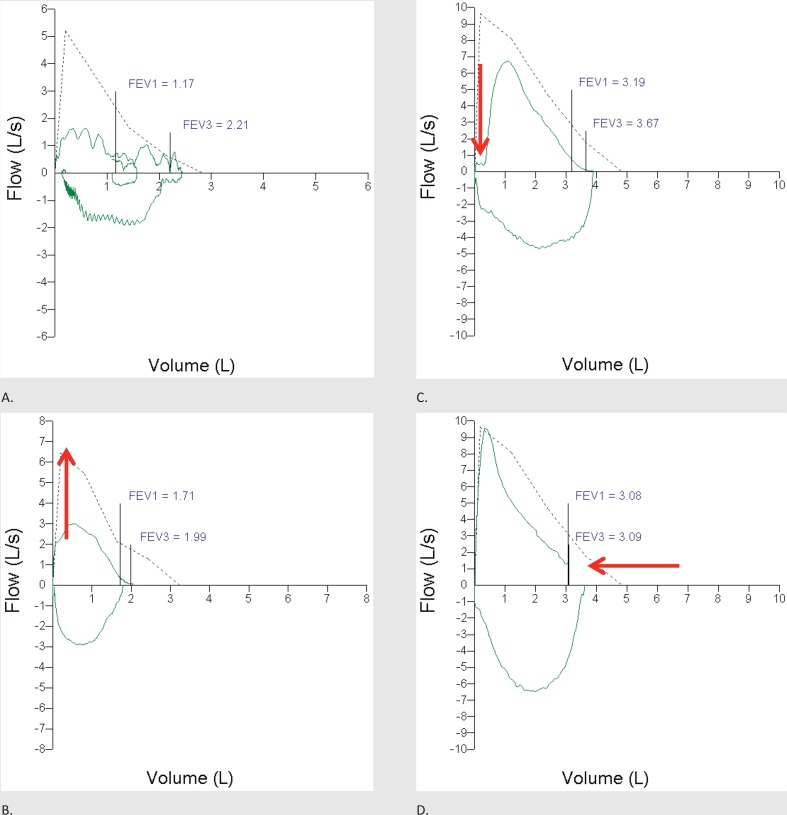
Examination of the flow–volume loop generated from a spirometry effort is central to the detection of common spirometry errors. Volume plotted against time is another common way to graphically display spirometry data; however, this paper will focus on the flow–volume loop. The flow–volume loop plots flow vertically (y-axis or ordinate) and volume horizontally (x-axis or abscissa). Flows above the intercept of the horizontal axis represent exhalation while flows below the horizontal axis represent inspiration. A flat inspiratory flow loop may indicate a variable extra-thoracic obstruction (e.g., paralyzed vocal cord). A normal and acceptable flow–volume loop is shown in Figure 1. Examples of common spirometry errors are shown in Figure 2. The clinician administering the test must be able to identify common errors and teach the patient how to generate error-free maneuvers. Modern spirometer software will alert the clinician when errors are detected. Demonstrating the maneuver for the patient prior to testing is a highly effective teaching tool. Continuous coaching during the maneuver coupled with suggestive body language will increase the chances for a quality recording. Screaming instructions at the patient is unnecessary.
FIGURE 1. Normal spirometry, all values fall within the normal range. The flow–volume loop exceeds the expected flows and volumes (dotted line). FVC, forced vital capacity; FEV1, forced expiratory volume in the first second; FEV3, forced expiratory volume in the third second; M, median; LLN, lower limit of normal.
FIGURE 2. Common spirometry errors. (A) Obstructed airflow due to a patient obstructing their pharyngeal and laryngeal structures (grunting) causing saw tooth flow patterns. (B) Poor expiratory effort, the red arrow indicates there should be a spiked, not rounded peak expiratory flow graphic. (C) Poor start, the red arrow indicates leaked air prior to the forced expiratory maneuver (excessive back extrapolated volume). (D) Premature termination of expiratory flow, the red arrow indicates a sudden vertical drop in flow. FEV1, forced expiratory volume in the first second; FEV3, forced expiratory volume in the third second.
BASIC SPIROMETRY INTERPRETATION
Which values are clinically important?
There is a seemingly endless list of spirometry indices available for clinicians to consider when performing spirometry interpretation. The sheer number of indices on many spirometry reports can generate both confusion and intimidation. However, many of these indices have been assigned physiologic importance that is either overstated or even nonexistent. Even popular indices such as the forced expiratory flow between 25% and 75% of the vital capacity (FEF25–75%) have not been found to play an important role in spirometry interpretation [22]. There are only three numeric values that are required to interpret spirometry: forced vital capacity (FVC), forced expiratory volume in the first second (FEV1), and FEV1/FVC ratio.
What are “normal” values?
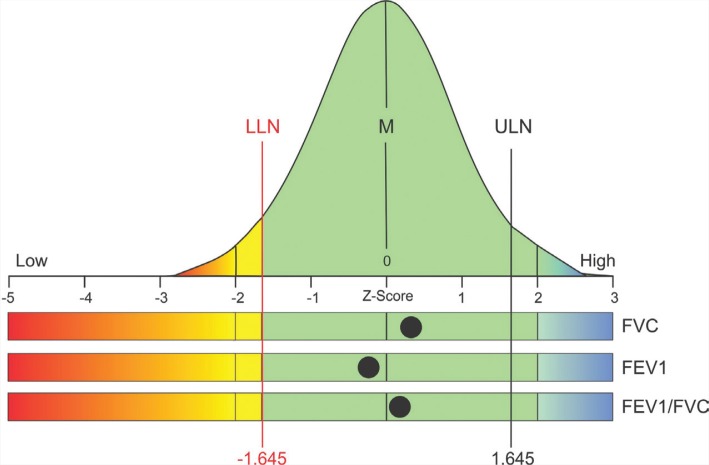
Recorded values are compared with a range of values derived from similar nonsmoking, disease-free subjects used to generate the reference equation. If the data collected from normal subjects are normally distributed, the values will be arrayed across a bell curve (see Figure 3). The mean (or median) value at the center of the bell curve is commonly referred to as the “predicted value” or “100% of predicted.” A “z-score” simply stated, is the number of standard deviations (SD) any value is from the center of the bell curve. Accordingly, the mean or predicted value has a z-score of zero. The empirical rule states that normally distributed data will be arrayed as follows: 68% within 1 SD, (z-score −1 to +1); 95% within 2 SD (z-score −2 to +2); 99.7% within 3 SD (z-score −3 to +3). For example, if you were measuring FVC in a large number of normal subjects, 95% of recordings would have a value within −2 SD and +2 SD. Each end of the bell curve is referred to as a “tail.” Because in spirometry interpretation we are only concerned with low values, a one-tailed approach is used. With a two-tailed approach 90% of values should lie within 1.64 SD from the center of the bell curve (i.e., 5% fall on each end of the bell curve). However, when using a one-tailed approach (we are only concerned with the lower tail) we can say that 95% of values from normal subjects should be ≥ −1.64 SD from the mean (center of the bell curve). In pulmonary function testing the fifth percentile of all normal values (z-score of −1.64) is defined as the lower limit of normal (LLN). A spirometry value at the LLN would be observed in only 1 in 20 (5%) normal subjects. In other words, a value at or below the LLN is an unusual finding for a subject with normal lungs. When a patient with an elevated pretest probability of disease (e.g., smoking history) has value at or below the LLN, it should be concluded that there is a greater chance of disease than health. Similar values from patients with a low pretest probability of disease should prompt diagnostic caution since 1 in 20 subjects with disease-free lungs have a value at the LLN. Diagnostic confidence in the declaration of health or disease should rise when values are further away from the LLN [23].
FIGURE 3. Spirometry data displayed on a bell curve. LLN, lower limit of normal; M, median; ULN, upper limit of normal; FVC, forced vital capacity; FEV1, forced expiratory volume in the first second. (Courtesy of Morgan Scientific Inc., Haverhill, MA, USA) .
A common and flawed approach to spirometry interpretation is to define 80% of the predicted value as the LLN. This approach is statistically invalid and should be abandoned, because the statistical LLN is often above 80% of the predicted value in young patients and may be well below 80% of predicted in the elderly [22]. A FEV1/FVC ratio of 0.7 to define airflow obstruction instead of the statistical LLN may under-diagnose obstruction in the young and over-diagnose obstruction in the aged. Using 80% of the predicted value and a FEV1/FVC ratio of 0.7 as the LLN has been shown to misclassify more than 20% of patients [24]. Recommendations on the grading of disease severity are listed in Table 2 [4, 25].
TABLE 2. Disease severity classification when FEV1 <LLN [4, 25].
| Classification | % of predicted | z-score |
|---|---|---|
| Mild | ≥70 | ≥−2 |
| Moderate | 60–69 | −2 to −2.5 |
| Moderately severe | 50–59 | <−2.5 to −3 |
| Severe | 35–49 | <−3 to −4 |
| Very severe | <35 | <−4 |
Note: FEV1, forced expiratory volume in the first second; LLN, lower limit of normal.
Spirometry reports
Spirometry reports should include only clinically meaningful indices such as FVC, FEV1, and FEV1/FVC. Many reports will also include peak expiratory flow rate. Recorded values should be listed in the first column followed by the normal range. The average expected value (predicted), percent of predicted and z-score may aid in interpretation (see Figure 1) [26]. Graphics including flow–volume loop and volume–time curve should be included in the report. Notes from the testing clinician regarding test quality and other pertinent information (e.g., bronchodilator use) can be very helpful to the interpreting physician.
BASIC SPIROMETRY PATTERNS
Normal pattern
A normal spirometry test is characterized by FVC, FEV1, and FEV1/FVC all within the normal range. It is important to keep in mind that having values in the normal range cannot completely rule out lung disease especially if the pretest probability of disease is elevated and if the recorded values are near the LLN. Moreover, a normal spirometry test cannot rule out asthma since many asthmatics spend most of their time with normal lung function. The flow–volume loop in normal patients will be tall and wide. Many reports display the flow–volume loop over an expected tracing. A normal test with data table, flow–volume loop, and bell curve is shown in Figure 1.
Obstructive pattern
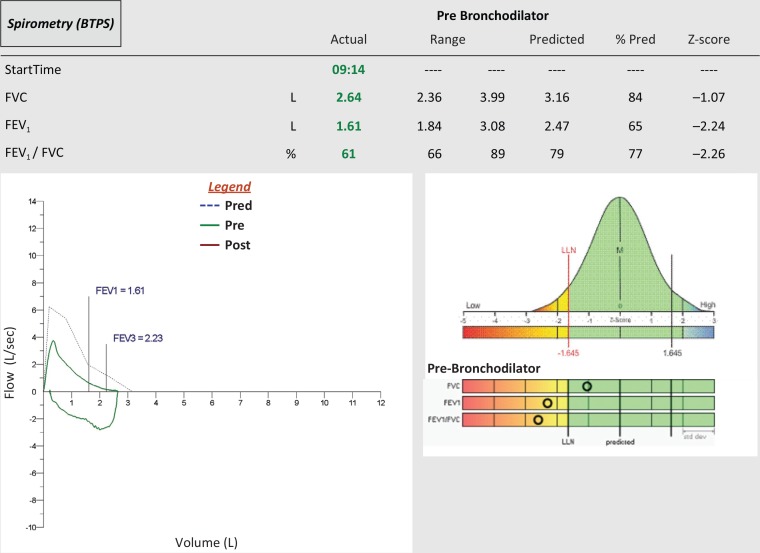
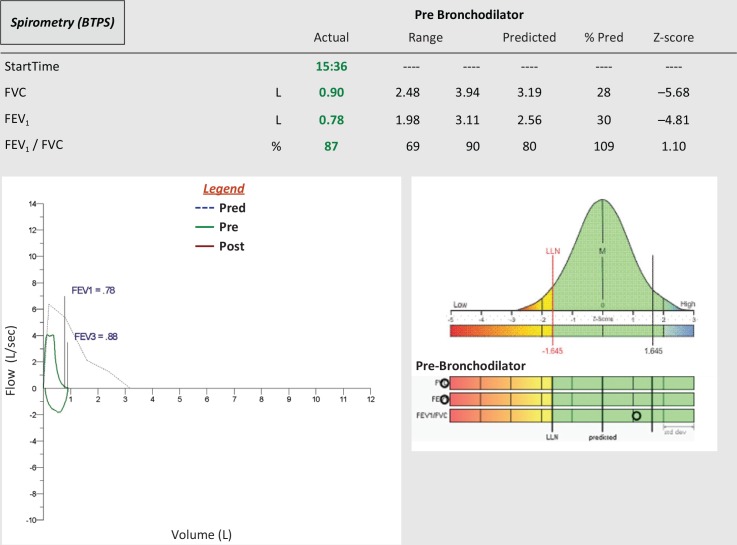
An obstructive pattern is characterized by FEV1/FVC < LLN. In other words, without airflow obstruction, most of the FVC should be exhaled in the first second of forced exhalation. Obstructive spirometry pattern is usually, but not always, accompanied by FEV1 <LLN. The FVC may be normal in milder disease but will be <LLN in more advanced disease. The flow–volume loop in obstructive diseases shows a lower peak flow and a concave (i.e., scooped) expiratory loop. An obstructed test with data table, flow–volume loop, and bell curve is shown in Figure 4.
FIGURE 4. Obstructive spirometry pattern, the FEV1 and FEV1/FVC are < LLN. The flow–volume loop shows less than expected expiratory flows (dotted line), which create a concave contour. FVC, forced vital capacity; FEV1, forced expiratory volume in the first second; FEV3, forced expiratory volume in the third second; M, median; LLN, lower limit of normal.
Restrictive pattern
A restrictive pattern is characterized by FVC and FEV1 <LLN accompanied by FEV1/FVC >LLN. Spirometry may suggest restrictive lung disease; however, restriction must be confirmed by measuring lung volumes and documenting a total lung capacity value <LLN [4]. The flow–volume loop in restrictive diseases will be thin due to small volumes (volume is displayed on the horizontal axis). A restrictive test with data table, flow–volume loop, and bell curve is shown in Figure 5.
FIGURE 5. Restrictive spirometry pattern, the FVC and FEV1 are <LLN but the FEV1/FVC is >LLN. The flow–volume loop is narrow indicating low volumes. FVC, forced vital capacity; FEV1, forced expiratory volume in the first second; FEV3, forced expiratory volume in the third second; M, median; LLN, lower limit of normal.
Post-bronchodilator testing
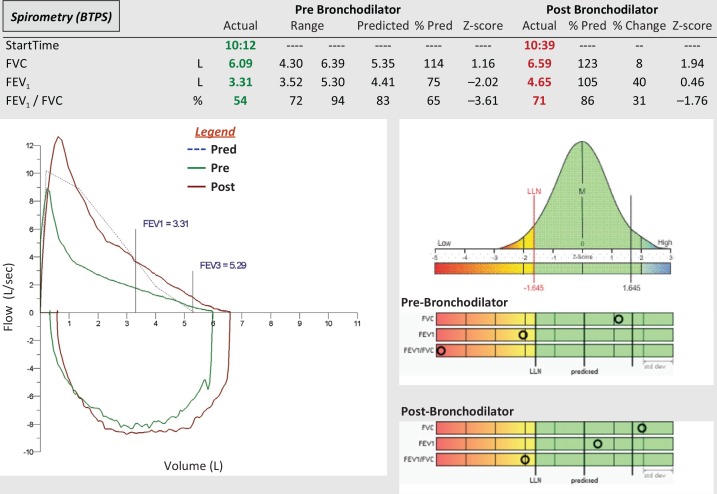
Spirometry tests are often repeated after the administration of a short-acting bronchodilator. A 12% (minimum of 200 mL) increase in FVC and/or FEV1 is considered significant [4]. A significant improvement in recorded values may indicate benefit from bronchodilator therapy. Normalization of an abnormal baseline test may indicate asthma. However, functional and symptomatic improvements may occur even in the absence of significant changes in spirometry. This is particularly true in patients with advanced COPD [27]. A short-acting beta agonist bronchodilator (e.g., albuterol) can be delivered either by small-volume nebulizer or metered dose inhaler. A minimum of 10 min should elapse between drug delivery and post-bronchodilator testing [8]. A spirometry test with data table, flow–volume loop, and bell curve from a patient with a significant bronchodilator response is shown in Figure 6.
FIGURE 6. Significant bronchodilator response, the post-bronchodilator FEV1 has increased more than 12% and 200 mL and is >LLN. The flow–volume loop overlay shows higher flows and volumes after bronchodilator (red tracing). FVC, forced vital capacity; FEV1, forced expiratory volume in the first second; FEV3, forced expiratory volume in the third second; M, median; LLN, lower limit of normal.
Longitudinal testing
Once a diagnosis has been made, follow-up spirometry testing to assess asthma control and COPD progression may be helpful. Both the Global Initiative for Asthma (GINA) [1] and the Global Initiative for Chronic Obstructive Lung Disease (GOLD) [2] recognize a role for serial spirometry measurements in patients’ asthma and COPD, respectively.
The GINA guidelines state that a low FEV1 may indicate a greater risk for asthma exacerbation, lung function decline, and poor perception of uncontrolled asthma [1]. A normal FEV1 in a symptomatic asthmatic may indicate a co-morbidity; however, FEV1 can be preserved in the presence of increased airway resistance [28, 29]. The repeated observation of bronchodilator responsiveness in a patient who has been prescribed asthma-control medications may indicate noncompliance, improper inhaler technique, the need for additional medication, or ongoing trigger exposure (e.g., allergens, occupational exposures). The GOLD guidelines state that yearly measurement of FEV1 can be used to identify accelerated loss of lung function [2].
The ATS/ERS interpretative strategy recommendations define a significant weekly change in FEV1 for normal subjects as ≥12% and ≥20% for patients with COPD [4]. Yearly changes in FEV1 should not exceed 15% [4]. In restrictive diseases such as idiopathic pulmonary fibrosis, a ≥10% reduction in FVC is reflective of disease progression [30]. In neuromuscular diseases such as amyotrophic lateral sclerosis, declining FVC is a strong indicator of disease progression [31].
SUMMARY
Spirometry testing plays an important role in the diagnosis and management of COPD, asthma, restrictive lung disease, and neuromuscular disease in the primary care setting [3]. Verifying the accuracy of the spirometer, the use of accurate patient demographics and appropriate reference equations, and ensuring testing personnel competency are key components of spirometry test interpretation. Spirometry interpretation should include an assessment of test quality and be based on sound statistical principals [3].
REFERENCES
- 1.Global Initiative for Asthma. Global strategy for asthma management and prevention, 2018. Available at: www.ginasthma.org. [Accessed 9 July 2018].
- 2.Global Initiative for Chronic Obstructive Lung Disease. Global strategy for the diagnosis, management, and prevention of chronic obstructive pulmonary disease, 2018 report. Available at: www.goldcopd.org. [Accessed 9 July 2018].
- 3.Ruppel GL, Carlin BW, Hart M, Doherty DE. Office spirometry in primary care for the diagnosis and management of COPD: National Lung Health Education Program update. Respir Care 2018;63(2): 242–2. doi: 10.4187/respcare.05710. [DOI] [PubMed] [Google Scholar]
- 4.Pellegrino R, Viegi G, Brusasco V, et al. Interpretative strategies for lung function tests. Eur Respir J 2005;26(5): 948–8. doi: 10.1183/09031936.05.00035205. [DOI] [PubMed] [Google Scholar]
- 5.Eaton T, Withy S, Garrett JE, Mercer J, Whitlock RM, Rea HH. Spirometry in primary care practice: The importance of quality assurance and the impact of spirometry workshops. Chest 1999;116(2): 416–23. doi: 10.1378/chest.116.2.416. [DOI] [PubMed] [Google Scholar]
- 6.Enright PL. Should we keep pushing for a spirometer in every doctor’s office?. Respir Care 2012;57(1): 146–51. doi: 10.4187/respcare.01504. [DOI] [PubMed] [Google Scholar]
- 7.Tuomisto L, Jarvinen V, Laitinen J, Erhola M, Kaila M, Brander P. Asthma programme in Finland: The quality of primary care spirometry is good. Prim Care Respir J 2008;17(4): 226–31. doi: 10.3132/pcrj.2008.00053. [DOI] [PMC free article] [PubMed] [Google Scholar]
- 8.Miller MR, Hankinson J, Brusasco V, et al. Standardisation of spirometry. Eur Respir J 2005;26(2): 319–38. doi: 10.1183/09031936.05.00034805. [DOI] [PubMed] [Google Scholar]
- 9.Enright PL, Beck KC, Sherrill DL. Repeatability of spirometry in 18,000 adult patients. Am J Respir Crit Care Med 2004;169(2): 235–8. doi: 10.1164/rccm.200204-347OC. [DOI] [PubMed] [Google Scholar]
- 10.Haynes JM. Pulmonary function test quality in the elderly: A comparison with younger adults. Respir Care 2014;59(1): 16–21. doi: 10.4187/respcare.02331. [DOI] [PubMed] [Google Scholar]
- 11.Gochicoa-Rangel L, Vargas-Dominguez C, Garcia-Mujica ME, et al. Quality of spirometry in 5-to-8-year-old children. Pediatr Pulmonol 2013;48(12): 1231–6. doi: 10.1002/ppul.22765. [DOI] [PubMed] [Google Scholar]
- 12.Wanger J. Quality Assurance. Respir Care Clin N Am 1997;3(2): 273–89. [PubMed] [Google Scholar]
- 13.Haynes JM. Quality assurance of the pulmonary function technologist. Respir Care 2012;57(1): 114–22. doi: 10.4187/respcare.01401. [DOI] [PubMed] [Google Scholar]
- 14.Enright PL, Johnson LR, Connett JE, Voelker H, Buist AS. Spirometry in the lung health study 1. Methods and quality control. Am Rev Respir Dis 1991;143(6): 1215–23. doi: 10.1164/ajrccm/143.6.1215. [DOI] [PubMed] [Google Scholar]
- 15.Haynes JM. Comprehensive quality control for pulmonary function testing: It’s time to face the music. (editorial) Respir Care 2010;55(3): 355–7. [PubMed] [Google Scholar]
- 16.Borg BM, Hartley MF, Bailey MJ, Thompson BR. Adherence to acceptability and repeatability criteria for spirometry in complex lung function laboratories. Respir Care 2012;57(12): 2032–8. doi: 10.4187/respcare.01724. [DOI] [PubMed] [Google Scholar]
- 17.Quanjer PH, Hall GL, Stanojevic S, Cole TJ, Stocks J. Global Lungs Initiative Age- and height-based prediction bias in spirometry reference equations. Eur Respir J 2012;40(1): 190–7. doi: 10.1183/09031936.00161011. [DOI] [PubMed] [Google Scholar]
- 18.Quanjer PH, Capderou A, Mazicioglu MM, et al. All-age relationship between arm span and height in different ethnic groups. Eur Respir J 2014;44(4): 905–12. doi: 10.1183/09031936.00054014. [DOI] [PubMed] [Google Scholar]
- 19.Quanjer PH, Stanojevic S, Cole TJ, et al. Multi-ethnic reference values for spirometry for the 3–95-yr age range: The global lung function 2012 equations. Eur Respir J 2012;40(6): 1324–43. doi: 10.1183/09031936.00080312. [DOI] [PMC free article] [PubMed] [Google Scholar]
- 20.Kim N, Kim SY, Song Y, et al. The effect of applying ethnicity-specific spirometric reference equations to Asian migrant workers in Korea. Ann Occup Environ Med 2015;27: 14. doi: 10.1186/s40557-015-0065-0. [DOI] [PMC free article] [PubMed] [Google Scholar]
- 21.Kirkby J, Aurora P, Spencer H, Rees S, Sonnappa S, Stocks J. Stitching and switching: The impact of discontinuous lung function reference equations. Eur Respir J 2012;39(5): 1256–7. doi: 10.1183/09031936.00173011. [DOI] [PubMed] [Google Scholar]
- 22.Quanjer PH, Weiner DJ, Pretto JJ, Brazzale DJ, Boros PW. Measurement of FEF25-75% and FEF75% does not contribute to clinical decision making. Eur Respir J 2014;43(4): 1051–8. doi: 10.1183/09031936.00128113. [DOI] [PubMed] [Google Scholar]
- 23.Crapo RO, Jensen RL. Standards and interpretive issues in lung function testing. Respir Care 2003;48(8): 764–72. [PubMed] [Google Scholar]
- 24.Miller MR, Quanjer PH, Swanney MP, Ruppel G, Enright PL. Interpreting lung function data using 80% predicted and fixed thresholds misclassifies more than 20% of patients. Chest 2011;139(1): 52–9. doi: 10.1378/chest.10-0189. [DOI] [PubMed] [Google Scholar]
- 25.Quanjer PH, Pretto JJ, Brazzale DJ, Boros PW. Grading the severity of airways obstruction: New wine in new bottles. Eur Respir J 2014;43(2): 505–12. doi: 10.1183/09031936.00086313. [DOI] [PubMed] [Google Scholar]
- 26.Culver BH, Graham BL, Coates AL, et al. Recommendations for a standardized pulmonary function report. An official American Thoracic Society technical statement. Am J Respir Crit Care Med 2017;196(11): 1463–72. doi: 10.1164/rccm.201710-1981ST. [DOI] [PubMed] [Google Scholar]
- 27.O’Donnell DE, Forkett L, Webb KA. Evaluation of bronchodilator responses in patients with “irreversible” emphysema. Eur Respir J 2001;18(6): 914–20. doi: 10.1183/09031936.01.00216501. [DOI] [PubMed] [Google Scholar]
- 28.Parker AL, McCool FD. Pulmonary function characteristics in patients with different patterns of methacholine airway hyperresponsiveness. Chest 2002;121(6): 1818–23. doi: 10.1378/chest.121.6.1818. [DOI] [PubMed] [Google Scholar]
- 29.Haynes J. A positive methacholine challenge based on specific airway conductance: A case report. Can J Respir Ther 2016;52(2): 53–5. [PMC free article] [PubMed] [Google Scholar]
- 30.Raghu G, Collard HR, Egan JJ, et al. An official ATS/ERS/JRS/ALAT statement: Idiopathic pulmonary fibrosis: Evidence-based guidelines for diagnosis and management. Am J Respir Crit Care Med 2011;183(6): 788–824. doi: 10.1164/rccm.2009-040GL. [DOI] [PMC free article] [PubMed] [Google Scholar]
- 31.Clavelou P, Blanquet M, Peyrol F, Ouchchane L, Gerbaud L. Rates of progression of weight and forced vital capacity as relevant measurement to adapt amyotrophic lateral sclerosis management for patient Result of a French multicentre cohort survey. J Neurol Sci 2013;331(1–2): 126–31. doi: 10.1016/j.jns.2013.06.002. [DOI] [PubMed] [Google Scholar]


