Abstract
The glycosaminogycan (GAG) family of biomacromolecules is composed acidic and linear chains of repeating disaccharide units. Quantitative disaccharide composition analysis is essential for the study and characterization of GAGs. Heparan sulfate and heparin consist of multiple disaccharide units and can be well-separated by ion-pairing reversed-phase microflow high-performance liquid chromatography (IPRP-Mf-HPLC). Each disaccharide can be detected and its mass confirmed by electrospray ionization mass spectrometry (ESI-MS). Isotopically enriched disaccharides were prepared chemoenzymatically from a uniformly 13C,15N-labeled N-acetylheparosan (–GlcA(1f→4)GlcNAc–) obtained from the fermentation of E. coli K5. These isotopically enriched disaccharides have identical HPLC retention times and mass spectra as their unlabeled counterparts and were used in liquid chromatography–mass spectrometry (LC–MS) as internal standards. The ratio of intensities between each pair of enriched and nonenriched disaccharides showed a linear relationship as a function of concentration. With the use of these calibration curves, the amount of each disaccharide (≥2 ng/disaccharide) could be quantified in four heparan sulfate samples analyzed by this method.
Heparan sulfate (HS)/heparin participate in many important biological processes, including blood anticoagulation, viral and bacterial infection and entry, angiogenesis, inflammation, cancer, and development.1–3 HS/heparin carry out their biological functions primarily by their interaction with proteins in which the sulfo groups electrostatically interact or hydrogen bond with basic amino acids of the target protein.4–6 In a number of cases, HS/ heparin have been demonstrated to bind specifically and with high affinity to proteins regulating their biological functions.4
HS/heparin are acidic linear polysaccharides having closely related structures. Both are isolated by extraction from animal tissues and are members of the glycosaminoglycan (GAG) family. These GAGs have an average molecular weight of 10–15 kDa and contain chains in size ranging from 5 to 50 kDa, corresponding to a polydispersity of 1.05–1.6.7 HS/heparin are both composed of a repeating disaccharide structure of 1,4-linked hexuronic acid and glucosamine residues. Heparin has a simpler structure with its most common disaccharide unit being 2-O-sulfo-α-L-iduronic acid (IdoA2S) 1→4-linked to 6-O-sulfo, N-sulfo-α-D-glucosamine (GlcNS6S), –IdoA2S(1→4)GlcNS6S–. HS has a similar but more highly variable and less sulfated structure with its most common disaccharide unit being β-D-glucuronic acid (GlcA) and N-acetyl-α-D-glucosamine (GlcNAc), –GlcA(1→4)GlcNAc–.8 HS/heparin from different tissues and various animals can differ substantially in their disaccharide composition and, hence, often have very different activities.9
The characterization of HS/heparin with various sequences and structures is critical in elucidating the functions corresponding to these GAGs. Characterization is still a challenge for analysts, because of the structural complexity and heterogeneity of these GAGs. Nuclear magnetic resonance (NMR) spectroscopy has been used for the disaccharide analysis of HS/heparin, but it is limited by the required sample amount, sample molecular weight, poly-dispersity, and sequence heterogeneity. High-performance liquid chromatography (HPLC) and capillary electrophoresis (CE)-based disaccharide analysis has been widely used over the last couple of decades. These methods are generally more sensitive and efficient than NMR analysis. In these analyses, HS/heparin are first completely or nearly completely depolymerized using either nitrous acid or a mixture of heparin lyases and reduced to obtain a mixture of disaccharides. After disaccharide separation by HPLC or CE14–16 the resulting disaccharides are often detected by absorbance, fluorescence (requiring either precolumn or postcolumn derivatization), or radioisotope (requiring precolumn labeling) methods to quantify the disaccharides comprising an individual HS/heparin sample. These disaccharide analyses require the use of standards, some of which are commercially available but some of which need to be prepared.17,18 However, because these approaches provide no additional structural information, these methods are difficult to use for the analyses of mixtures containing larger oligosaccharides (i.e., resistant tetrasaccharides) or peptide and other impurities. The sensitivity of such methods can also be affected by gradient solvent systems often required for elution and the requirement for precolumn or postcolumn derivatization steps. Mass spectrometry (MS) and liquid chromatography–mass spectrometry (LC–MS) have been successfully applied to analyze disaccharides and oligosaccharides derived from HS/heparin and can provide sensitive disaccharide analysis along with additional structural information.19–22 However, quantification is often a bottleneck of MS analysis, and quantification is critical for understanding the disaccharide content of biological samples. An unnatural internal standard disaccharide, UA2S–GlcNCOEt6S (IP) has been used in several studies for the identification and quantification of mixtures of HS/heparin disaccharides in MS and LC–MS.22,23 Unfortunately, different disaccharide structures, in particular sulfation level and pattern, result in very different ion intensities in MS.23–25 Different ionization methods, solvent systems, or matrixes, and even instrumentation result in major differences in disaccharide signal levels. Thus, a better method for disaccharide quantitative analysis by LC–MS would use an internal standard for each disaccharide present in an HS/heparin sample. Our laboratory has recently reported the chemoenzymatic synthesis of HS/heparin.26–30 Moreover, in this synthesis it was possible to introduce stable isotopes into the structures of HS/ (heparin and its precursors having a variety of disaccharide compositions.
In this paper, the most common heparin/HS disaccharides were analyzed by ion-pairing reversed-phase microflow highperformance liquid chromatography (IPRP-Mf-HPLC) using electrospray ionization MS (ESI-MS) detection. Seven uniformly 13C,15N-labeled disaccharides were prepared by chemoenzymatic synthesis from a uniformly labeled [13C,15N]N-acetyl-heparosan (–GlcA(1→4)GlcNAc–) prepared from E. coli K5. These internal standards with same retention time and ionization patterns were applied in LC–MS method to quantify the HS/heparin disaccharide composition. In addition, the sensitivity in this method improved to 2 ng/disaccharide.
EXPERIMENTAL SECTION
Materials.
Unsaturated disaccharide standards of heparin/HS, ΔUA–GlcNAc (0S), ΔUA–GlcNS (NS), ΔUA–GlcNAc6S (6S), ΔUA2S–GlcNAc (2S), ΔUA2S–GlcNS (NS2S), ΔUA–GlcNS6S (NS6S), ΔUA2S–GlcNAc6S (2S6S), and ΔUA2S–GlcNS6S (Tris) were obtained from Iduron Co. Manchester, U.K. (where ΔUA is 4-deoxy-α-L-threo-hex-4-enopyranosyluronic acid). HS-L1 and HS-L2 GAG chains, having low and high sulfation levels, were released from HS proteoglycans that had been extracted and purified from porcine liver. HS-B1 and HS-B2 GAG chains, having low and high sulfation levels, were released from HS proteoglycans that had been extracted from bovine brain in our laboratory.31,32 The protocol for the preparation of these HS samples is described in the Supporting Information.
Preparation of Isotopically Labeled Disaccharide Standards.
Uniformly labeled [13C,15N]N-acetylheparosan polysaccharide was prepared by the fermentation of E. coli K5 on 13C glucose and 15N ammonium chloride as previously described.29 Uniformly 13C,15N-labeled polysaccharides, N-sulfoheparo-san (–GlcA–GlcNS–), N-acetyl-6-O-sulfoheparosan (–GlcA–GlcNAc6S–),N-sulfo-6-O-sulfoheparosan (–GlcA–GlcNS6S–), undersulfated heparin (–IdoA2S–GlcNS–), and heparin (–IdoA2S–GlcNS6S–) were prepared from N-acetylheparosan (–G1cA–GlcNAc) using chemoenzymatic synthesis previously reported methods (Scheme 1).26–30 [13C,15N]-ΔUA–GlcNAc, (0SI), [13C,15N]-ΔUA–GlcNS (NSI), [13C,15N]-ΔUA–GlcNAc6S (6SI), [13C,15N]-ΔUA2S–GlcNS (NS2SI), [13C,15N]-ΔUA–GlcNS6S (NS6SI), and [13C,15N]-ΔUA2S–GlcNS6S (TriSI) were prepared by digestion of corresponding polysaccharides using recombinant, E. coli-expressed heparin lyases 1, 2, and 3 (Hep 1,2, and 3).29The digestion products were purified using anionexchange high-pressure liquid chromatography (SAX-HPLC) on a SAX S5 Spherisorb column (Waters, Milford, MA) with a 0–1 M NaCl (pH 3.5) linear gradient elution.33 The purified fractions were collected, using desalted P2 column (Bio-Rad, Richmond, CA), and freeze-dried. [13C,15N]-ΔUA2S–GlcNAc6S (2S6SI) was prepared by N-desulfonation and re-N-acetylation from TriSI.34 TriSI (40 μg) was passed through a cation-exchange column (AG50W-X8, H form, Bio-Rad, U.S.A., 0.5 mL), neutralized with pyridine, and freeze-dried. The dried sample was dissolved in 20 μL of 5% DMSO in H2O and incubated in 50 °C for 1.5 h. After N-desulfonation, the sample was freeze-dried and dissolved in 10 μL of H2O containing 10% MeOH, 5% uniformly labeled [13C]acetic anhydride (Sigma Co., St. Louis, MO). The re-N-acetylation was performed at 4 °C for 2 h, and the final product was purified by SAX-HPLC.
Scheme 1.
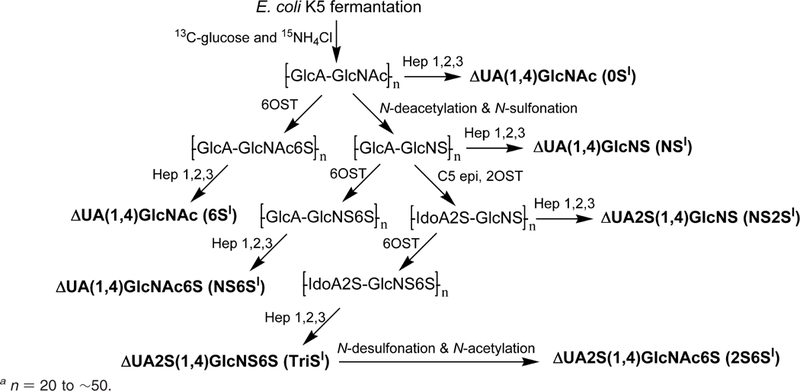
Scheme Used to Chemoenzymatically Prepare Isotopically Labeled Disaccharides Standardsa
a n = 20 to ∼50.
Quantification of GAGs by Carbazole Assay.
GAGs were subjected to carbozole assay35 to quantify the amount of GAG in each sample using HS as standard.
Enzymatic Digestion.
The Hep 1, 2, and 3 (5 mUnits each) were added to HS samples (5 μg) and incubated at 37 °C for 10 h. The products were recovered by centrifugal filtration (10 000g using a YM-3, 3000 MWCO membrane, Millipore, Bedford, MA), and the HS/heparin disaccharides were recovered in the flow-through, freeze-dried, and redissolved in 10 μL of H2O for LC–MS analysis.
IPRP-Mf-HPLC–MS.
LC–MS analyses were performed on an Agilent 1100 LC/MSD instrument (Agilent Technologies, Inc. Wilmington, DE) equipped with an ion trap, binary pump followed by microflow, and a UV detector. The column used was a 5 μm Agilent Zorbax SB-C18 (0.5 mm × 250 mm) (Agilent Technologies). Eluent A was water/acetonitrile (85:15) v/v, and eluent B was water/acetonitrile (35:65) v/v. Both eluents contained 12 mM tributylamine (TrBA) and 38 mM NH4OAc with pH adjusted to 6.5 with HOAc. A gradient of 0% B for 20 min and 0–50% B over 25 min was used at 10 μL/min for disaccharide analysis. The column effluent entered the source of the ESI-MS for continuous detection by MS. In addition, another 5 μL/min acetonitrile was added just after column and before MS to make the solvent and TrBA easy to spray and easy to evaporate in the ion source. The electrospray interface was set in negative ionization mode with a skimmer potential of –40.0 V, a capillary exit of –40.0 V, and a source of temperature of 325 °C, to obtain the maximum abundance of the ions in a full scan spectrum (150–1500 Da, 10 full scans/s). Nitrogen was used as a drying (5 L/min) and nebulizing gas (20 psi).
Disaccharide Analysis.
Unlabeled mixtures of disaccharide standards 1, 2, 5,10, 20, and 50 ng per disaccharide were analyzed by LC–MS to test the sensitivity of this method, the linearity based on amount of disaccharide and peak intensity in mass spectrometry. Isotopically labeled disaccharide standards (15 ng/disaccharide) were mixed with unlabeled disaccharide standard mixtures (1, 2, 5, 10, 20, and 50 ng/disaccharide) and analyzed by LC–MS. Isotopically labeled mixtures of disaccharide standards (15 ng/disaccharide) were also mixed with 2 μL of disaccharides prepared from various HS samples and analyzed by LC–MS. All analyses were performed in triplicate.
RESULTS AND DISCUSSION
HS/heparin GAGs are heterogeneous with respect to molecular weight and disaccharide composition. HS/heparin GAGs consist of 10–50 repeating disaccharide units, and their chain length can vary based on the level endoglucuronidase processing in different tissues and species.36 The quantitative disaccharide compositions of HS/heparin have direct relationships with their important biological functions, including blood anticoagulation, viral and bacterial infection and entry, angiogenesis, inflammation, cancer, and development.1,36 The availability of small amounts of samples is often a bottleneck for quantitative compositional analysis. Sensitive and reliable methods for quantitative analysis are required to characterize the HS/heparin and to elucidate the structure–activity relationships of these GAGs.1,7,36
IPRP-Mf-HPLC–MS Method.
The most common disaccharides comprising HS/heparin are shown in Figure 1. These disaccharides can be separated by IPRP-Mf-HPLC and detected by extracted ion chromatography (EIC, Figure 2A). The separation observed in EIC resolved the α- and β-anomeric forms present in 6S, 2S, and 2S6S. NMR analysis confirms similar amounts of α-and β-anomers are present in N-acetylated HS/heparin disaccharides, whereas the α-anomeric form is predominant in the N-sulfo disaccharides (data not shown). IPRP-Mf-HPLC is widely used in pharmaceutical research as a result of its high resolution and high sensitivity.37–40 In addition to excellent separation, ESI-MS affords the mass of each disaccharide (Figure 2B–I). A peak was observed for each disaccharide at m/z 378.1, 416.1, 458.1, 496.0, 538.0, and 575.9 (Figure 2B–I, respectively). A single peak was observed at m/z 458.1 and 496.0 for pairs of the 6S/2S and NS6S/NS2S anomers, respectively. Because sulfo groups are relatively unstable, minor peaks corresponding to desulfonation were also observed in the MS spectra of di- and trisulfated disaccharide. In addition to the major peaks for NS6S/NS2S, 2S6S, and TriS, minor peaks corresponding to monodesulfonated NS6S/NS2S, 2S6S, and TriS were also observed at m/z 416.0, 458.0, and 538.0, respectively. Thus, the disaccharides comprising HS/heparin could be unambiguously identified by both their retention times and their masses using IPRP-Mf-HPLC–MS. Interestingly, no multiply charged ions were observed even for highly charged disaccharides. This may be due to the relatively high concentration of TrBA ion-pairing reagent, which helped avoid multiple ionization.
Figure 1.
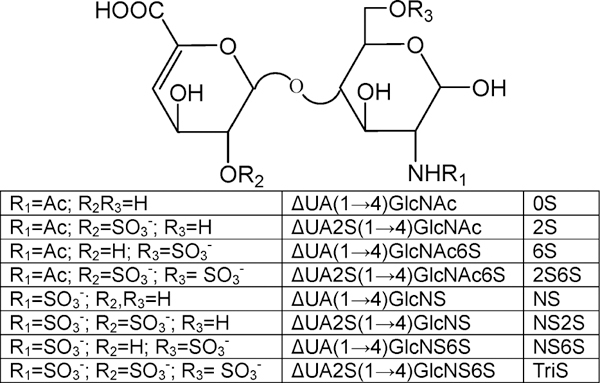
Structures of the most common disaccharides found in HS/heparin.
Figure 2.
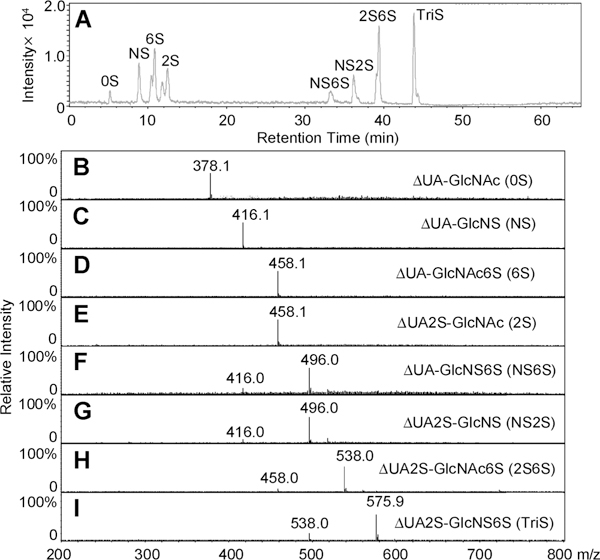
LC–MS analysis of disaccharides the most commonly found in HS/heparin. (A) Extracted ion chromatography (EIC) of disaccharides. (B–I) Mass spectra of 0S, NS, 6S, 2S, NS6S, NS2S, 2S6S, and TriS disaccharides, respectively.
Additional acetonitrile was injected in front of the ion source to increase the sensitivity of MS. The higher concentration of acetonitrile makes the solvent spray more efficiently. This efficient spraying affords more uniform and complete evaporation of solvent and volatile TrBA and ammonium acetate additives reducing the major source of background noise in the spectrum. Unlabeled disaccharide mixtures of equal mass amounts of disaccharides were prepared. Mixtures containing 1, 2, 5, 10, 20, and 50 ng of each disaccharide were analyzed by LC–MS (Figure 3). In the presence of pre-ion-source addition of acetonitrile, the peaks of disaccharides were broader but the disaccharides remained separated (Figure 3A). The EIC of disaccharides in an amount of 1 ng each gave a noisy chromatogram allowing identification, even in the corresponding mass spectrum (data not shown), but did not permit quantification. Samples having from 2 to 50 ng of each disaccharide gave EIC (Figure 3B–F) with increasing peak intensities and decreasing noise from which integrated peak areas could be accurately calculated. The integrated disaccharide peak areas showed excellent linearity when plotted as a function of their amounts (Figure 3G). The different slopes of these curves reflect the different efficiency of ionization for each of the corresponding disaccharides in electrospray ion source. These differences make quantification problematic in the absence of internal standard.
Figure 3.
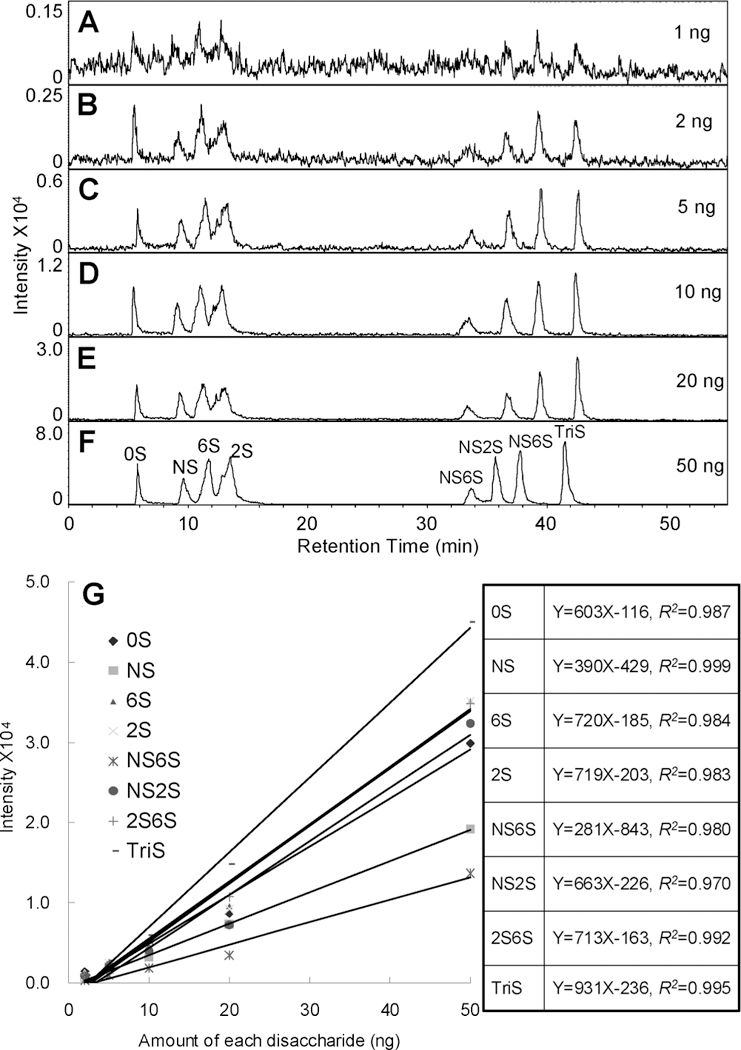
Sensitivity of analysis using the IPRP-Mf-HPLC–MS method. (A–F) EIC of disaccharide mixtures containing 1, 2, 5, 10, 20, and 50 ng of each disaccharide are shown. (G) The curves and linear equations of intensity as a function of concentration for each disaccharide are shown.
Quantitative Analysis.
A single unnatural internal standard can be used in LC–MS disaccharide analysis to quantify disaccharides. An alternative method for quantifying disaccharides having different physical and chemical properties is to utilize internal standards that are identical in all properties to the disaccharide analytes, with the exception of their isotopic com position. Uniformly 13C,15N-labeled HS/heparin polymers were synthesized chemoenzymatically in our previous work (Scheme 1).29 The isotopic purity of the fermentation product obtained from E. coli K5, N-acetylheparosan the precursor to the HS/heparin polysaccharides, was 94% (13C + 15N + 16O + 1H = 94%) based on MS spectrum of its disaccharide.29 The structures of N-acetylheparosan (–GlcA–GlcNAc–) and HS/heparin polysaccharides, N-sulfoheparosan (–GlcA–GlcNS–), undersulfated heparin (–IdoA2S–GlcNS–),andheparin (–IdoA2S–GlcNS6S–) were confirmed by NMR. The sequences of enzymatically derived disaccharides were also confirmed by MS and tandem mass spectrometry (MS/MS). The 0SI disaccharide obtained on heparin lyase treatment of 13C,15N-labeled N-acetylheparosan, for example, showed a molecular ion [M – H]– at m/z 393.0 in its ESI-MS spectrum (Figure 4A), 15 amu greater than the mass of the unlabeled 0S disaccharide (Figure 2B). Two crossring cleavages are observed in the MS/MS spectrum at m/z 269.0 and 287.0 corresponding to 0,2A2 and 0,2A2 – H2O, respectively (Figure 4B). The fragmentation observed in the MS/MS of 0SI is identical to that observed for the unlabeled 0S disaccharide.41 The disaccharides NSI, NS2SI, and NS2S6SI were also derived from corresponding polysaccharides by heparinase treatment and their structures (Scheme 1) confirmed by LC–MS. They have identical retention times as the corresponding unlabeled disaccharides (data not shown). Again, the MS of these disaccharides showed a peak of 13 amu greater than the corresponding unlabeled disaccharides (Figure 5, parts B, F, and H). The 6SI and NS6SI were synthesized by treating N-acetylheparosan and N-sulfoheparosan using 6-O-sulfotransferase (OST) (Scheme 1). The resulting 6SI and NS6SI disaccharides again gave peaks 15 and 13 amu higher than the unlabeled disaccharides, respectively (Figure 5, parts C and E). Disaccharide 2S6SI was derived chemically from disaccharide TriSI in a yield of ~60%. The product was purified by SAX-HPLC, and LC–MS showed a peak of the same retention time with 15 amu greater mass than the corresponding unlabeled 2S6S disaccharide (Figure 5G). We were unable to prepare disaccharide 2SI, but its ionization is similar to that observed for 6SI (Figure 3G). Rare disaccharides such as ones containing 3-O-sulfo groups and resistant oligosaccharides having stable isotopic labeling would also be useful for disaccharide analysis and oligosaccharide mapping. Strategies involving the use of partial enzymatic digestion and 3OST are currently being evaluated for the preparation of these standards.
Figure 4.
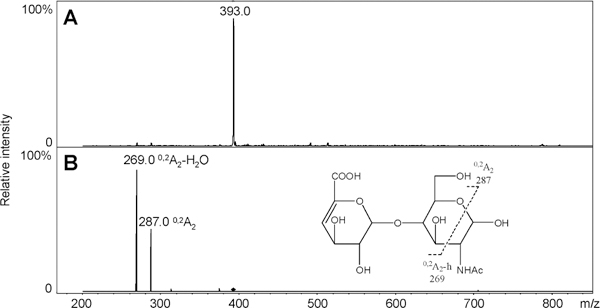
ESI-MS and MS/MS spectra of isotopically labeled disaccharide 0S. (A) ESI-MS spectrum of isotopically labeled disaccharide 0S. (B) MS/MS spectrum and scheme fragmentation of isotopically labeled disaccharide 0S.
Figure 5.
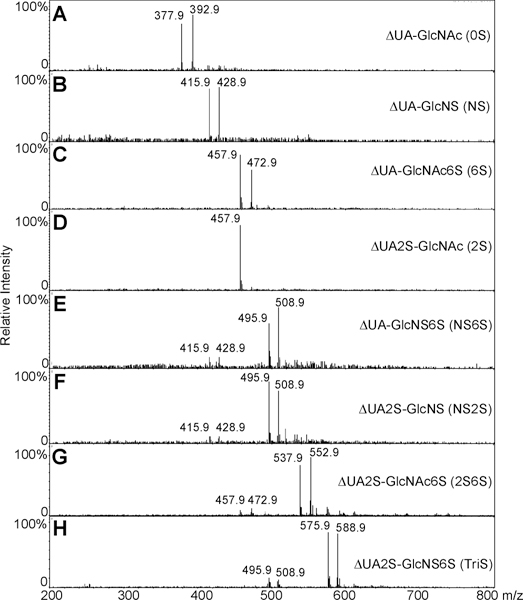
ESI-MS of disaccharides with corresponding isotopically labeled internal standards. (A–C) and (E–H) Mass spectra of equimolar mixtures of 0S with 0SI, NS with NSI, 6S with 6SI, NS6S with NS6SI, NS2S with NS2SI, 2S6S with 2S6SI, and TriS with TriSI, respectively. (D) Mass spectrum of 2S.
Fixed amounts of isotopically labeled disaccharides (15 ng/disaccharide) were mixed with different amounts of unlabeled disaccharides, 2, 5, 10, 20, and 50 ng, and analyzed by LC–MS. The peak intensity for each unlabeled disaccharide was determined, and the ratio of this peak intensity to each corresponding isotopically labeled disaccharide was calculated (Supporting Information Figure 1S and Table 1). This ratio was then plotted as a function of the amount of unlabeled disaccharide present. The disaccharides, 0S, NS, 6S, NS6S, NS2S, 2S6S, and TriS, were calibrated by corresponding isotopically labeled disaccharides with the absence of 2SI standard, respectively, using these MS intensities. Disaccharide 2S was calibrated by 6SI because similarity ionization efficiency of the 6S and 2S disaccharides. All the correlations in Supporting Information Figure 1S and Table 1 were lines with similar slopes because all disaccharides were calibrated by the corresponding isotopically labeled internal standards. The physical and chemical properties of the internal standard for each disaccharide make these ideal internal standards and eliminate the problems of multiple linear equations observed in Figure 3G. Additionally, all the correlation coefficients (R2) in Supporting Information Figure 1S and Table 1 are higher than those in Figure 3G, demonstrating the expected improvement linearity using isotopically labeled standards.
Table 1.
Linear Equations of Disaccharides Based on a Fixed Amount of the Corresponding Isotopically Labeled Internal Standardsa
| disaccharides | linear equations | correlation coefficients |
|---|---|---|
| 0S | Y = 0.125X + 0.242 | R2 = 0.999 |
| NS | Y = 0.128X + 0.244 | R2 = 0.999 |
| 6S | Y = 0.131X – 0.123 | R2 = 0.997 |
| 2S | Y = 0.127X – 0.216 | R2 = 0.992 |
| NS6S | Y = 0.138X – 0.172 | R2 = 0.997 |
| NS2S | Y = 0.128X – 0.212 | R2 = 0.987 |
| 2S6S | Y = 0.131X – 0.271 | R2 = 0.995 |
| TriS | Y = 0.131X + 0.145 | R2 = 0.998 |
A mixture of all of the isotopically labeled disaccharides, each in a fixed amount (15 ng), was analyzed by LC–MS five times in the presence of a mixture of the eight unlabeled disaccharides in five different amounts (2, 5,10, 20, and 50 ng). The ratio of the intensity of the ion corresponding to each unlabeled disaccharide to the ion corresponding to the identical isotopically labeled disaccharide (Y) was plotted as a function of the amount of unlabeled disaccharide (X).
Two mixtures, having known amounts of disaccharides, were next analyzed by this method. Mixture 1 (M-1) contained 40, 35, 30, 25, 20, 15, 10, and 5 ng of 0S, NS, 6S, 2S, NS6S, NS2S, 2S6S, and TriS, respectively. Mixture 2 (M-2) contained 5, 10, 15, 20, 25, 30, 35, and 40 ng of 0S, NS, 6S, 2S, NS6S, NS2S, 2S6S, and TriS, respectively. Fixed amounts of isotopically labeled disaccharides (15 ng/disaccharide) were combined with these two mixtures and analyzed by LC–MS. The quantity of each disaccharide in these two mixtures was calculated by the linear equations shown in Supporting Information Figure 1S and Table 1. The calculated amounts, given in Table 2, were consistent with the known amounts.
Table 2.
Quantification of HS/Heparin Disaccharide Mixtures Containing Known Amounts of Disaccharides
| M-1 | M-2 | |||
|---|---|---|---|---|
| disaccharides (ng) |
known amount |
calcd amount |
known amount |
calcd amount |
| 0S | 40 | 41 ± 2 | 5 | 5 ± 0 |
| NS | 35 | 35 ± 0 | 10 | 11 ± 1 |
| 6S | 30 | 29 ± 1 | 15 | 16 ± 0 |
| 2S | 25 | 24 ± 0 | 20 | 20 ± 1 |
| NS6S | 20 | 21 ± 0 | 25 | 26 ± 2 |
| NS2S | 15 | 15 ± 0 | 30 | 31 ± 0 |
| 2S6S | 10 | 9±1 | 35 | 34 ± 2 |
| TriS | 5 | 6±1 | 40 | 41 ± 1 |
Quantitative Analysis of HS from Different Sources.
Isotopically labeled standards (15 ng/disaccharide) were added to four HS samples isolated from animal tissues after their digestion with Hep 1, 2, and 3. The EIC of these samples are presented in Figure 6. The quantity of each disaccharide in these four samples was calculated by the linear equations shown in Supporting Information Figure 1S and Table 1. The disaccharide compositions of these four HS samples are given in Table 3. Absorbance (232 nm) detection, requiring 10-fold more sample, was also applied to determine disaccharide composition and was used to confirm the results from this method. In addition, carbazole assay was applied to quantify the total amount of HS- derived disaccharides. The compositions of these four HS samples obtained using UV detection are consistent to EIC results, which required 10-fold less sample. The quantification of these HS samples by carbazole assay was also similar to that obtained by LC–MS method. HS-L2 and HS-B2 have higher levels of 2-O-sulfo groups than HS-L1 and HS-B1. The two liver-derived HS samples showed a higher percentage of TriS than the brain-derived samples but a lower total sulfate content.
Figure 6.
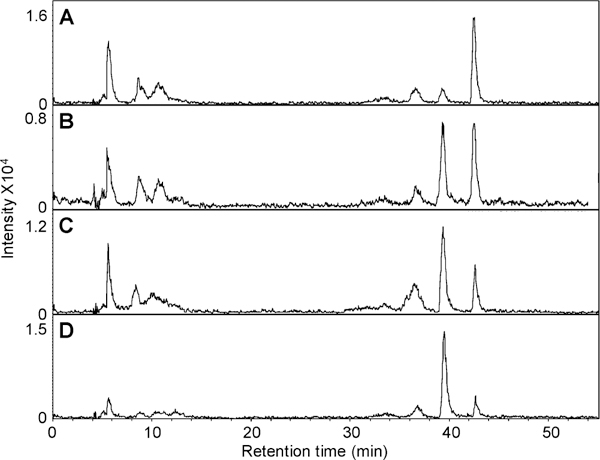
EIC of disaccharide analysis of four HS samples. The ion chromatograms were extracted based on the mass of the unlabeled disaccharides: (A) HS-L1; (B) HS-L2 both prepared from porcine liver; (C) HS-B1; (D) HS-B2 both prepared from bovine brain.
Table 3.
Quantity and Composition of HS from Porcine Liver and Bovine Brain
| quantity |
|||||||||||
|---|---|---|---|---|---|---|---|---|---|---|---|
| 0S | NS | 6S | 2S | NS6S | NS2S | 2S6S | TriS | MS (ng) | carb (ng) | ||
| HS-L1a | UV | 34.1% ± 1.4% | 38.3% ± 2.1% | 7.2% ± 0.5% | 1.9% ± 0.4% | 5.6% ± 0.3% | 2.9% ± 1.1% | 2.1% ± 0.5% | 7.9% ± 0.8% | 237 ± 12 | 250 ± 15 |
| MS | 33.0% ± 1.7% | 37.1% ± 1.9% | 7.9% ± 0.4% | 2.7% ± 0.3% | 4.3% ± 0.2% | 4.0% ± 0.5% | 2.3% ± 0.2% | 8.6% ± 0.9% | |||
| HS-L2b | UV | 30.0% ± 0.9% | 28.7% ± 1.5% | 10.1% ± 0.7% | 4.1% ± 0.5% | 4.6% ± 0.6% | 5.2% ± 0.3% | 7.9% ± 0.7% | 9.4% ± 1.5% | 131 ± 11 | 150 ± 6 |
| MS | 28.3% ± 1.2% | 29.2% ± 1.9% | 9.7% ± 0.6% | 4.3% ± 0.3% | 6.1% ± 1.0% | 5.6% ± 0.7% | 8.8% ± 0.5% | 8.1% ± 0.9% | |||
| HS-B1C | UV | 25.7% ± 0.9% | 43.9% ± 2.5% | 9.2% ± 0.4% | 4.4% ± 0.6% | 4.6% ± 0.7% | 2.9% ± 0.2% | 6.6% ± 0.8% | 2.7% ± 0.2% | 188 ± 15 | 210 ± 10 |
| MS | 23.7% ± 0.8% | 42.8% ± 1.7% | 10.0% ± 0.8% | 4.8% ± 0.8% | 3.7% ± 0.8% | 3.6% ± 0.6% | 7.3% ± 0.4% | 3.3% ± 0.4% | |||
| HS-B2d | UV | 18.6% ± 0.5% | 32.1% ± 0. 7% | 8.1% ± 0.7% | 7.2% ± 0.9% | 8.1% ± 0.5% | 7.4% ± 0.7% | 15.9% ± 0.4% | 2.6% ± 0.2% | 91 ± 5 | 100 ± 7 |
| MS | 17.7% ± 0.7% | 30.7% ± 0.9% | 7.7% ± 0.9% | 8.4% ± 0.7% | 7.7% ± 0.8% | 6.9% ± 0.9% | 16.8% ± 0.9% | 4.1% ± 0.3% | |||
The total sulfate level of HS-L1 is 0.9/disaccharides.
The total sulfate level of HS-L2 is 1.1/disaccharides.
The total sulfate level of HS-B1 is 1.0/disaccharides.
The total sulfate level of HS-B2 is 1.3/disaccharides.
CONCLUSIONS
The IPRP-Mf-HPLC–MS method demonstrated here is useful for the analysis of HS in tissue samples and is sensitive enough to be applied in the analysis of cell culture samples. With the growing interest in generating and evaluating therapeutic preparations of HS/heparin for possible clinical uses, there is need to develop fast and reliable methods for structural characterization and quantification of pharmaceutical heparin preparations and samples of native HS/heparin isolated from different biological sources. Quantitative disaccharide composition analysis is one of the most important ways to characterize the structures of HS/heparin. The complex structures of HS/heparin require such improved methodology. IPRP-Mf-HPLC–MS provides excellent separation of HS/heparin disaccharides and sensitivity of detection and quantification. The application of structurally defined, isotopically labeled, internal standards having identical physical and chemical properties as analyte disaccharides allows the accurate calibration each disaccharide in a mixture. This is a rapid, efficient, and reliable method to obtain the disaccharide composition quantitatively. This methodology should accelerate the study in GAG structures and glycobiology. Future work will examine the use of rare disaccharides and oligosaccharides with isotopic labeling.
Supplementary Material
Footnotes
SUPPORTING INFORMATION AVAILABLE
Additional information as noted in text. This material is available free of charge via the Internet at http://pubs.acs.org.
References
- (1).Capila I; Unhardt RJ Angew. Chem., Int Ed. 2002, 41, 391–412. [DOI] [PubMed] [Google Scholar]
- (2).Munoz EM; Linhardt RJ Arterioscler., Thromb., Vasc. Biol. 2004,24, 1549–1557. [DOI] [PMC free article] [PubMed] [Google Scholar]
- (3).Raman R; Sasisekharan V; Sasisekharan R Chem. Biol. 2005,12, 267–277. [DOI] [PubMed] [Google Scholar]
- (4).Hricovini M; Guerrini M; Bisio A; Torri G; Petitou M; Casu B Biochem. J. 2001, 559, 265–272. [DOI] [PMC free article] [PubMed] [Google Scholar]
- (5).Jin L; Abrahams JP; Skinner R; Petitou M; Pike RN; Carrell RW Proc. Natl. Acad. Sci. U.S.A. 1997, 94, 14683–14688. [DOI] [PMC free article] [PubMed] [Google Scholar]
- (6).Mulloy B; Linhardt RJ Curr. Opin. Struct. Biol. 2001, 11, 623–628. [DOI] [PubMed] [Google Scholar]
- (7).Casu B Adv. Carbohydr. Chem. Biochem. 1985, 43, 51–134. [DOI] [PubMed] [Google Scholar]
- (8).Linhardt RJ J. Med. Chem. 2003, 46, 2551–2564. [DOI] [PubMed] [Google Scholar]
- (9).Loganathan D; Wang HM; Mallis LM; Linhardt RJ Biochemistry 1990, 29, 4362–368. [DOI] [PubMed] [Google Scholar]
- (10).Griffin CC; Unhardt RJ; Van Gorp CL; Toida T; Hileman RE; Schubert RL II.; Brown SE Carbohydr. Res. 1995, 276, 183–197. [DOI] [PubMed] [Google Scholar]
- (11).Toida T; Huang Y; Washio Y; Maruyama T; Toyoda H; Imanari T; Linhardt RJ Anal. Biochem. 1997, 251, 219–226. [DOI] [PubMed] [Google Scholar]
- (12).Toida T; Yoshida H; Toyoda H; Koshiishi I; Imanari T; Hileman RE; Fromm JR; Linhardt RJ Biochem. J. 1997, 322 (2), 499–506. [DOI] [PMC free article] [PubMed] [Google Scholar]
- (13).Warda M; Toida T; Zhang F; Sun P; Munoz E; Xie J; Linhardt RJ Glycoconjugate J. 2006, 23, 555–563. [DOI] [PMC free article] [PubMed] [Google Scholar]
- (14).Qiu G; Toyoda H; Toida T; Koshiishi I; Imanari T Chem. Pharm. Bull. 1996, 44, 1017–1020. [DOI] [PubMed] [Google Scholar]
- (15).Mao W; Thanawiroon C; Linhardt RJ Biomed. Chromatogr. 2002,16, 77–94. [DOI] [PubMed] [Google Scholar]
- (16).Lamari FN; Militsopoulou M; Mitropoulou TN; Hjerpe A; Karamanos NK Biomed. Chromatogr. 2002, 16, 95–102. [DOI] [PubMed] [Google Scholar]
- (17).Cramer JA; Bailey LC Anal. Biochem. 1991, 196, 183–191. [DOI] [PubMed] [Google Scholar]
- (18).Deakin JA; Lyon M Glycobiology 2008, 18, 483–491. [DOI] [PubMed] [Google Scholar]
- (19).Kuberan B; Lech M; Zhang L; Wu ZL; Beeler DL; Rosenberg RD J. Am. Chem. Soc. 2002, 124, 8707–8718. [DOI] [PubMed] [Google Scholar]
- (20).Thanawiroon C; Linhardt RJJ Chromatogr., A 2003, 1014, 215–223. [DOI] [PubMed] [Google Scholar]
- (21).Thanawiroon C; Rice KG; Toida T; Linhardt RJ J. Biol. Chem. 2004, 279, 2608–2615. [DOI] [PubMed] [Google Scholar]
- (22).Saad OM; Leary JA Anal. Chem. 2003, 75, 2985–2995. [DOI] [PubMed] [Google Scholar]
- (23).Korir AK; Limtiaco JF; Gutierrez SM; Larive CK Anal. Chem. 2008, 80, 1297–1306. [DOI] [PubMed] [Google Scholar]
- (24).Camara JE; Satterfield MB; Nelson BC J. Pharm. Biomed. Anal. 2007, 43, 1706–1714. [DOI] [PubMed] [Google Scholar]
- (25).Behr JR; Matsumoto Y; White FM; Sasisekharan R Rapid. Commun. Mass. Spectrom. 2005, 19, 2553–2562. [DOI] [PubMed] [Google Scholar]
- (26).Linhardt RJ; Dordick JS; DeAngelis PL; Liu J Semin. Thromb. Hemostasis 2007, 33, 453–465. [DOI] [PMC free article] [PubMed] [Google Scholar]
- (27).Munoz E; Xu D; Avci F; Kemp M; Liu J; Linhardt RJ Biochem. Biophys. Res. Commun. 2006, 339, 597–602. [DOI] [PMC free article] [PubMed] [Google Scholar]
- (28).Weiwer M; Sherwood T; Green DE; Chen M; DeAngelis PL; Liu J; Linhardt RJ J. Org. Chem. 2008, 73, 7631–7637. [DOI] [PMC free article] [PubMed] [Google Scholar]
- (29).Zhang Z; McCallum SA; Xie J; Nieto L; Corzana F; Jimenez-Barbero J; Chen M; Liu J; Linhardt RJ J. Am. Chem. Soc. 2008, 130, 12998–13007. [DOI] [PMC free article] [PubMed] [Google Scholar]
- (30).Xu D; Moon AF; Song D; Pedersen LC; Liu J Nat. Chem. Biol. 2008, 4, 200–202. [DOI] [PMC free article] [PubMed] [Google Scholar]
- (31).Vongchan P; Warda M; Toyoda H; Toida T; Marks RM; Linhardt RJ Biochim. Biophys. Acta 2005, 1721, 1–8. [DOI] [PubMed] [Google Scholar]
- (32).Park Y; Yu G; Gunay NS; Linhardt RJ Biochem. J. 1999, 344, 723–730. [PMC free article] [PubMed] [Google Scholar]
- (33).Yang HO; Gunay NS; Toida T; Kuberan B; Yu G; Kim YS; Linhardt RJ Glycobiology 2000, 10, 1033–1039. [DOI] [PubMed] [Google Scholar]
- (34).Danishefsky I; Eiber HB; Carr JJ Arch. Biochem. Biophys. 1960, 90, 114–121. [DOI] [PubMed] [Google Scholar]
- (35).Bitter T; Muir HM Anal. Biochem. 1962, 4, 330–334. [DOI] [PubMed] [Google Scholar]
- (36).Rabenstein DL Nat. Prod. Rep. 2002, 19, 312–331. [DOI] [PubMed] [Google Scholar]
- (37).Rist W; Mayer MP; Andersen JS; Roepstorff P; Jorgensen TJ Anal. Biochem. 2005, 342, 160–162. [DOI] [PubMed] [Google Scholar]
- (38).Fujii K; Nakano T; Kanazawa M; Akimoto S; Hirano T; Kato H; Nishimura T Proteomics 2005, 5, 1150–1159. [DOI] [PubMed] [Google Scholar]
- (39).Cappiello A; Famiglini G; Fiorucci C; Mangani F; Palma P; Siviero A Anal. Chem. 2003, 75, 1173–1179. [DOI] [PubMed] [Google Scholar]
- (40).Gerlache M; Kauffmann JM Biomed. Chromatogr. 1998, 12, 147–148. [DOI] [PubMed] [Google Scholar]
- (41).Zhang Z; Xie J; Liu J; Linhardt RJ J. Am. Soc. Mass. Spectrom. 2008, 19, 82–90. [DOI] [PMC free article] [PubMed] [Google Scholar]
Associated Data
This section collects any data citations, data availability statements, or supplementary materials included in this article.


