Abstract
Ethologically relevant navigational strategies often incorporate remembered reward locations. While neurons in the medial entorhinal cortex provide a map-like representation of the external spatial world, it remains unknown if this map integrates information regarding learned reward locations. We compared entorhinal coding during a free foraging versus spatial memory task. Entorhinal spatial maps re-structured to incorporate a learned reward location, which in turn improved positional decoding near this location. This finding indicates that different navigational strategies drive the emergence of discrete entorhinal maps of space and points to a role for entorhinal codes in a diverse range of navigational behaviors.
One Sentence Summary:
Training rats to perform a spatial memory task drives the emergence of a new entorhinal spatial map that incorporates a remembered reward location and improves positional decoding at that location.
The ability to recall and navigate to a remembered reward location is essential to survival. The hippocampus and medial entorhinal cortex (MEC) contain cells that provide representations of self-location and orientation within the local spatial environment (1–5). Initial experiments suggested a dissociation between representations in these regions: spatially-modulated codes sensitive to contextual features in the hippocampus and context-independent codes for position, orientation and speed in MEC (2, 3, 5–10). In contrast, recent work has shown that MEC spatial codes are flexible and adaptive (6, 11–13). However, these MEC spatial coding features have primarily been observed during random foraging, whereas ethologically relevant strategies often employ more complex behaviors such as goal-directed navigation (14). While MEC plays a critical role in navigation (15), the degree to which remembered reward locations influence MEC neural codes remains unknown.
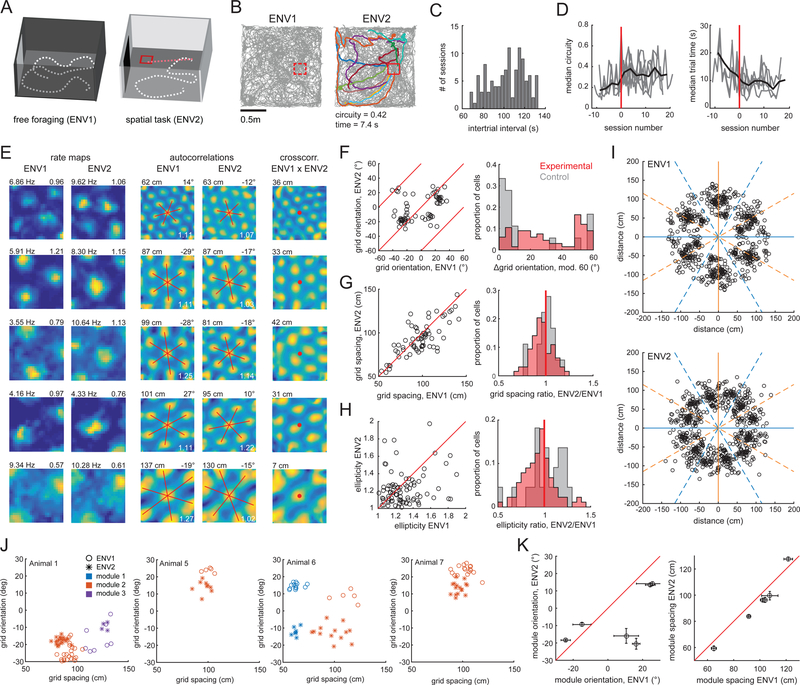
We recorded neural activity in the MEC and surrounding cortical areas of seven rats as they explored two arenas (1.5 m x 1.5 m) (Fig. S1). In environment one (ENV1; black walls, lemon scent), rats foraged for randomly scattered crushed cereal (2–5, 12). In environment two (ENV2; white walls, vanilla scent), rats navigated to a remembered, unmarked 20 cm x 20 cm zone in response to an auditory cue to receive a food reward (0.5–1 cereal units), and freely foraged for randomly scattered crushed cereal between trials (10) (Fig. 1A,B and S2). Reward trials (cue onset to reward zone entry) occurred ≥ 10 times per session (Fig. 1C). After training (mean # sessions to reach criterion = 15; range = 8–24), animals took rapid, direct paths to the reward zone upon cue onset (Fig. 1D).
Fig. 1. Performance of a task induces grid rotation and rescaling.
(A). Schematic of environments. (B) Trajectories (gray) from a paired session. Trial trajectories are highlighted. Mean trial circuity and trial time noted below ENV2. Reward zone in red. (C) Histogram of inter-trial intervals. (D) Circuity and trial time improved with training in individual animals (gray lines). Data aligned to each animal’s first post-trained session (red line). (E) (Left) Grid cell rate maps in both environments; peak firing rate and grid score noted on top. (Middle) Corresponding autocorrelations; spacing and orientation noted on top. Red lines indicate grid axes; white text indicates ellipticity. (Right) Corresponding ENV1-ENV2 cross-correlations. Distance from the cross-correlation’s center to the nearest peak noted on top. (F) (Left) Grid cell orientations, red lines indicate rotations equivalent to modulo 60. (Right) Histogram of grid orientation differences for experimental and control animals. (G) (Left) Grid cell spacing, red line indicates identical spacing. (Right) Histograms of grid spacing ratio. (H) (Left) Grid cell ellipticities, red line indicates identical ellipticity. (Right) Histograms of ellipticity ratio. (I) Scatter plots of the innermost six fields in each grid cell’s autocorrelation. Orange lines represent north-south aligned axes; blue lines represent east-west aligned axes. (J) Unpaired grid cell recordings from four animals, clustered into modules according to spacing and orientation. (K) Mean orientations (Left) and spacings (Right) in each environment for each of the six modules in (J). Error bars indicate SEM.
We considered the coding features of 778 cells recorded in both environments (Fig. S3). We identified cells as encoding position (P), head direction (H) or running speed (S), then further classified P-encoding cells as grid, border, or non-grid, non-border spatial cells (12). Between environments, we observed equal proportions of grid and border cells, and cells encoding P, H, or S (Fig. S4A). Stability, information content, average and peak firing rates did not change between environments, apart from the firing rates of grid cells (Fig. S4C-E). Multiple features of local field potential theta oscillations (6 – 10 Hz) were also similar between environments (Fig. S5).
We next asked whether task-demands alter the structure of MEC firing patterns (6, 9). Grid cells’ (n = 102) firing patterns re-organized between environments, despite their shared geometric shape and size (Fig. 1E, Table S1). First, the orientation of the grid pattern rotated (median absolute orientation change: 12.53°, p=1.12×10⁻¹², Fig. 1F). These rotations varied across animals (mean rotation range: −27° to +7°), and resulted in grid orientations that were less environmentally-aligned in ENV2 compared to ENV1 (p=0.001, Fig. 1I) (13). Second, there was a small decrease in grid spacing (p=0.015, Fig. 1G), but not in field size (p=0.85), in ENV2. Third, we observed less elliptical grid patterns in ENV2 (p=0.006, Fig. 1H). Finally, we observed a translation in the grid pattern (Fig. S6D-G) (16, 17). Co-recorded grid cells changed coherently and maintained their phase offsets (Fig. S6A). The observed grid orientation, scaling, and ellipticity changes also held for unpaired grid cell recordings clustered into modules (Fig. 1J,K) (18). Overall, 49/102 grid cells showed a statistically significant change on at least one measure (Fig. S6B), with changes largely conserved within animals (Fig. S6C-H). Critically, we observed grid pattern translation but not orientation, spacing or ellipticity changes when ENV1 and ENV2 had the same behavioral demand (random foraging, n = 3 rats), although there was no difference in the change in grid spacing between groups (Fig. 1F-H, right, Table S1) (11, 13, 16, 17).
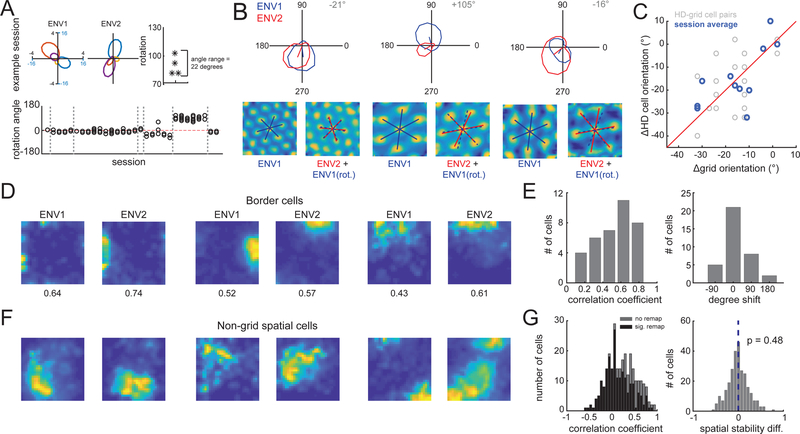
Consistent with task demands re-structuring MEC representations, head direction, border, and non-grid spatial cells reorganized between environments. Head direction (HD) cells coherently rotated their preferred direction within sessions and animals (both p < 0.002, Fig 2A, Fig. S7A-C), with 70/132 cells exhibiting significant changes in tuning. Rotations were consistent with the rotation in grid orientation (all HD-grid cell pairs: r=0.45, p=0.02; averaged within sessions: r=0.70, p=0.02; Fig. 2B-C). A majority (24/36) of border cells remapped between environments, primarily through rotations (Fig. 2D, E) (6). Lastly, 196/271 non-grid spatial cells significantly remapped between ENV1 and ENV2, with task-trained animals showing more remapping than free-foraging controls (task-trained mean correlation coefficient ± SD: 0.32 ± 0.22; control: 0.41 ± 0.27; 49/100 control cells re-mapped, proportions test p = 3×10⁻⁵) (Fig. 2G, Fig. S7E). We observed no changes in speed cells (Fig. S7F,G).
Fig. 2. Performance of a task induces remapping in head direction, border and non-grid spatial cells.
(A) Top row: Four co-recorded HD cells in each environment. Rightmost panel indicates each cell’s rotation between environments. Bottom row: rotation angles observed across sessions. Gray lines indicate boundaries between animals. (B) Co-recorded grid and HD cells. (Top) HD tuning curves. (Bottom) Grid cell autocorrelations with grid axes. Co-rotation of grid and HD signals shown by rotating the ENV1 grid axes by the rotation observed in co-recorded HD cell (blue dashed lines). (C) (Grey) HD cell orientation change (between environments) versus grid cell orientation change for all possible pairs of co-recorded HD and grid cells. (Blue) Same data, with all HD or grid cells recorded within the same session averaged together. (D) Border cell rate maps in ENV1 and ENV2. (E) Histograms of border cell rate map ENV1 versus ENV2 correlation coefficients (left) and rotation values (right). (F) Non-grid spatial cell rate maps in ENV1 and ENV2. (G) (Left) Histogram of non-grid spatial cell rate map ENV1 versus ENV2 correlation coefficients (black = cells with significant re-mapping, grey = non-significant re-mapping). (Right) Histogram of the difference in spatial stability between ENV1 and ENV2.
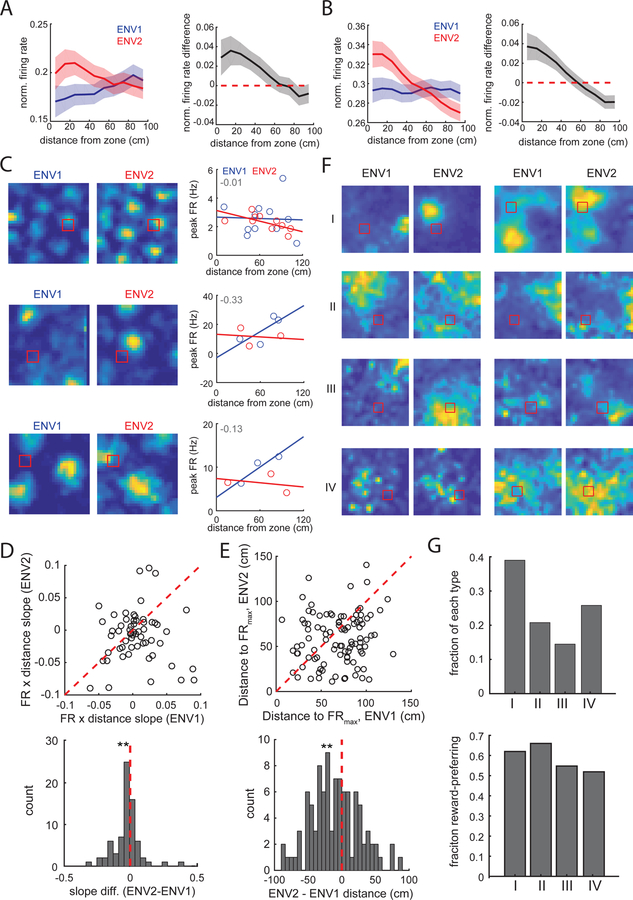
We next examined whether spatial restructuring incorporated the remembered reward location. As running speed and spatial sampling differed between environments (Fig. S2), we first down-sampled the data to match in speed and position occupancy between environments (3, 5, 12). The relative activity of grid and non-grid spatial cells increased near the reward zone in ENV2 compared to ENV1 (signed-rank test, normalized activity vs distance slopes, grid: p = 0.0025; non-grid: p = 5×10⁻⁴) (Fig. 3A,B, Fig S8A-D). The robustness of this effect was reinforced by the observation of the same effect at the level of individual animals (Fig. S8A) and was not driven by increased occupancy near the reward zone (Fig S8E-H). Directional and non-directional grid cells showed comparable reward-related firing increases (Fig. S8I,J).
Fig. 3. Grid and non-grid spatial cells have localized firing rate changes near the reward.
(A) (Left) Mean normalized grid cell firing rate as a function of distance from the reward zone. Ribbon indicates SEM. (Right) Difference in grid cell firing rate (ENV2-ENV1). (B) (Left) Mean normalized non-grid spatial cell firing rate as a function of distance from the reward zone. (Right) Difference in firing rate (ENV2-ENV1). (C) (Left) Rate maps for three grid cells recorded in both environments. (Right) Corresponding field peak firing rates, plotted as a function of the field’s distance from the reward zone. Best-fit lines shown; difference between the best-fit lines (slope ENV2 - slope ENV1) indicated in upper left. (D) (Top) Best fit slope values for each cell in ENV1 and ENV2. (Bottom) Histogram of slope differences for grid cells. (E) (Top) Distance from the reward zone to the highest FR field in each environment for each cell. (Bottom) Histogram of distance differences. (F) Non-grid spatial cells that show reward preference in ENV2 correspond to four categories of remapping; two examples/group are shown. (G) (Top) Fraction of reward-preferring cells in each remapping category (of 159 total reward-preferring cells). (Bottom) Fraction of cells in each remapping category that show reward-preference.
We next investigated how grid cells re-structure their firing toward the reward zone (Fig. S9A). Our observation of coordinated translations between simultaneously recorded grid cells (see Fig. S6A) eliminated the possibility that cells translate independently. Emergence of new grid fields, distortion of the grid pattern, and systematic re-shaping of grid fields were also eliminated, as we did not observe changes in grid score (Fig. S4B), the number of fields, or the distance between the reward zone and closest field (Fig. S9B, Table S2). Moreover, we did not observe changes in field size or eccentricity as a function of fields’ proximity to the reward zone (Fig. S9C). Finally, we examined whether grid field rate-remapping (19) shows reward specificity, such that fields near the reward zone exhibit higher firing rates. We did not observe significant changes in the overall field peak firing rates or coefficient of variation among field peak firing rates (Fig. S9D). However, the peak firing rate of grid fields closer to the reward zone was higher in ENV2 (p=0.01, Fig. 3D) and the distance from the reward zone to the grid field with the highest firing rate was smaller in ENV2 (p=0.01, Fig. 3E; see also Fig. S9E,F).
We then investigated how non-grid spatial cells (n = 271) remapped to support reward-localized changes in firing rates. Non-grid spatial cells did not extend their firing fields in a reward-specific manner as average field size, total field area, and number of fields did not change (Figure S10A). Instead, many cells (n = 159 cells) heterogeneously remapped to preferentially encode the reward location (Fig. 3F,G Table S3). First, some cells (Group I) exhibited coherent spatial tuning in both environments, with a firing field located closer to the reward zone in ENV2 (p=2×10⁻⁵). A second group of cells (Group II) exhibited coherent spatial tuning in ENV1, with the field farther from the reward than expected by chance (p=0.02). Third, a population of cells (Group III) had coherent spatial tuning only in ENV2, and this activity was closer to the reward zone than expected by chance (p=0.002). Finally, Group IV did not exhibit any coherent spatial fields but exhibited increased activity near the reward zone in ENV2. The proportion of cells exhibiting reward-preference did not depend on the group type (all p>0.05, Fig. 3G, bottom). Further, reward-preference and other coding features did not cluster (Figure S10B,C).
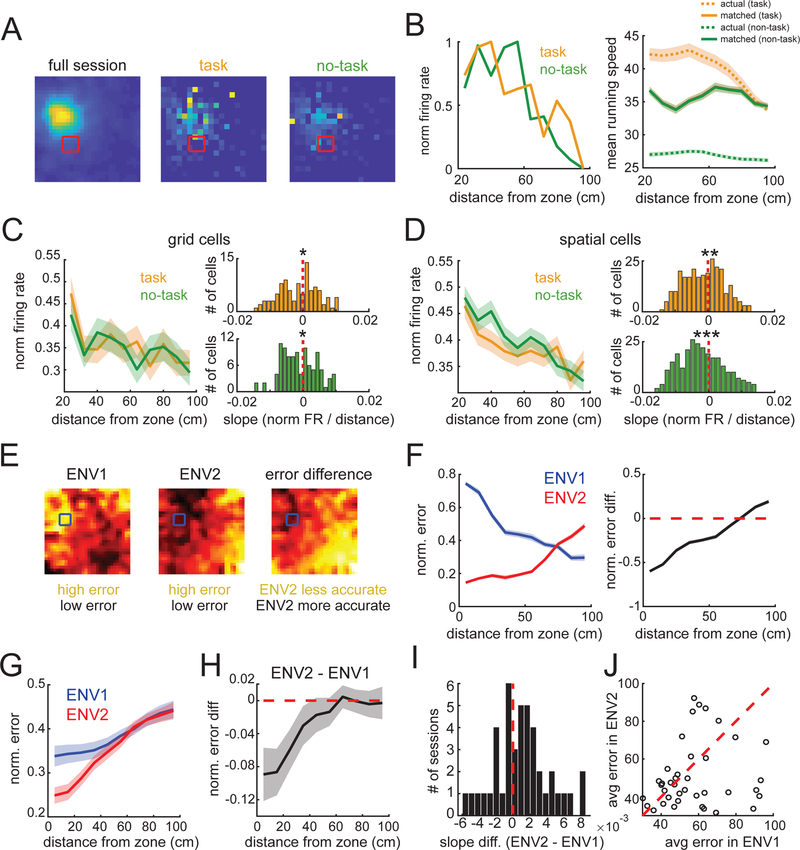
We next asked whether these changes reflected neural activity during the spatial task trials or were persistent throughout the ENV2 recordings. We analyzed two rate maps for each ENV2 session: one for task trajectories (tone onset to zone entry) and one for speed- and position-matched no-task trajectories (Fig. 4A,B). Grid cells’ average firing rate did not differ between task and no-task, though non-grid spatial cells had higher firing rates during task times (Fig. S11). Critically, task and no-task maps both exhibited significant increases in normalized activity near the reward zone (Fig. 4C,D, Table S4), indicating that the reward influence was present throughout the session.
Fig. 4. Long-term changes in the spatial map support spatial decoding near the reward.
(A) Rate maps of the full ENV2 session (left), task (middle), and no-task trajectories (right) speed-matched for each position bin. (B) (Left) The cell in (A)’s average normalized firing rate as a function of distance from the reward zone for task (orange) and no-task trajectories (green). (Right) Mean running speed during task and no-task trajectories as a function of distance from the center of the reward zone, before and after speed-matching. (C-D) (Left panels) Average normalized firing rate for grid (C) and non-grid position (D) cells as a function of distance from the reward zone. (Right panels) The slopes of both task and no-task trajectories were significantly negatively distributed for grid (C) and non-grid position (D) cells. (E) Example decoding error maps for ENV1 (left), ENV2 (middle), and the normalized difference (ENV2-ENV1, right) from a single session (ENV1 n = 6 P-encoding cells, ENV2 n = 5 cells). (F) Normalized error (Left) and ENV2-ENV1 error difference (Right) as a function of distance from the reward zone for the example in (E). (G) Normalized error versus distance from reward zone for each environment, averaged over all decoding sessions (n = 43). (H) Average difference in error (ENV2-ENV1) for all sessions. (I) Distribution of slopes of ENV2-ENV1 tuning curves across sessions. (J) Across all sessions, decoding error within 30 cm of reward zone is lower in ENV2 than ENV1 (median difference in error = −4.3 cm, signed-rank p = 0.028).
Finally, we asked how the task-associated changes in MEC representations could impact navigation. MEC representations can support vector navigation by providing unique combinations of spatial firing patterns, which downstream neurons may use to estimate the distance between an animal’s position and a goal location (20). We estimated the animal’s position using the activity from simultaneously recorded neurons in ENV1 and ENV2 (Fig. 4E,F). Using a Bayesian decoder, we observed that the decoding accuracy increased near the reward zone in ENV2 compared to ENV1 (ENV2 slope > ENV1 slope for 27/43 sessions, median slope difference = 1×10⁻³, signed-rank p = 0.042) (Fig. 4G-I, S12). Moreover, the improved position decoding was highly localized to the reward zone, with a decrease in decoding error in ENV2 observed up to 30 cm from the reward zone center (Fig. 4J, Fig S12A-C). Reward-related decoding did not consistently co-vary with fluctuations in task performance (Fig. S12E,F).
Our understanding of how remembered reward locations mediate MEC navigational codes has lagged due to a lack of task diversity. Here, we report that the firing rate and spatial pattern of MEC representations restructure in response to changes in navigational strategy. This restructuring did not reflect trajectory specific coding, as previously observed in MEC (21), suggesting task-relevant features of the two environments evoked separate long-term map representations (17). However, the precise parameters of MEC map restructuring may depend on experience and task familiarity, as recent work indicates (22). Combined, our data points to MEC as a region capable of dynamically altering its coding features to integrate relevant contextual features to support a range of navigational strategies.
Supplementary Material
Acknowledgments:
We thank A Borrayo and A Diaz for histology assistance.
Funding: LMG is a New York Stem Cell Foundation–Robertson Investigator. This work was supported by funding from the New York Stem Cell Foundation, NIMH MH106475, NIDA DA042012, Office of Naval Research N000141812690, Simons Foundation 542987SPI and the James S McDonnell Foundation awarded to LMG, and a Stanford Interdisciplinary Graduate Fellowship awarded to KH;
Footnotes
Competing interests: Authors declare no competing interests;
Data and materials availability: Data are available at https://giocomolab.weebly.com/data.htmlCode is available at http://doi.org/10.5281/zenodo.2435310
References and Notes:
- 1.O’Keefe J, Dostrovsky J, The hippocampus as a spatial map. Preliminary evidence from unit activity in the freely-moving rat. Brain Res 34, 171–175 (1971). [DOI] [PubMed] [Google Scholar]
- 2.Hafting T, Fyhn M, Molden S, Moser MB, Moser EI, Microstructure of a spatial map in the entorhinal cortex. Nature 436, 801–806 (2005). [DOI] [PubMed] [Google Scholar]
- 3.Kropff E, Carmichael JE, Moser MB, Moser EI, Speed cells in the medial entorhinal cortex. Nature 523, 419–424 (2015). [DOI] [PubMed] [Google Scholar]
- 4.Solstad T, Boccara CN, Kropff E, Moser MB, Moser EI, Representation of geometric borders in the entorhinal cortex. Science 322, 1865–1868 (2008). [DOI] [PubMed] [Google Scholar]
- 5.Sargolini F et al. , Conjunctive representation of position, direction, and velocity in entorhinal cortex. Science 312, 758–762 (2006). [DOI] [PubMed] [Google Scholar]
- 6.Diehl GW, Hon OJ, Leutgeb S, Leutgeb JK, Grid and nongrid cells in medial entorhinal cortex represent spatial location and environmental features with complementary coding schemes. Neuron 94, 83–92 (2017). [DOI] [PMC free article] [PubMed] [Google Scholar]
- 7.Anderson MI, Jeffery KJ, Heterogeneous modulation of place cell firing by changes in context. J Neurosci 23, 8827–8835 (2003). [DOI] [PMC free article] [PubMed] [Google Scholar]
- 8.Muller RU, Kubie JL, The effects of changes in the environment on the spatial firing of hippocampal complex-spike cells. J Neurosci 7, (1987). [DOI] [PMC free article] [PubMed] [Google Scholar]
- 9.Leutgeb S et al. , Independent codes for spatial and episodic memory in hippocampal neuronal ensembles. Science 309, 619–623 (2005). [DOI] [PubMed] [Google Scholar]
- 10.Kentros CG, Agnihotri NT, Streater S, Hawkins RD, Kandel ER, Increased attention to spatial context increases both place field stability and spatial memory. Neuron 42, 283–295 (2004). [DOI] [PubMed] [Google Scholar]
- 11.Krupic J, Bauza M, Burton S, Barry C, O’Keefe J, Grid cell symmetry is shaped by environmental geometry. Nature 518, 232–235 (2015). [DOI] [PMC free article] [PubMed] [Google Scholar]
- 12.Hardcastle K, Maheswaranathan N, Ganguli S, Giocomo LM, A multiplexed, heterogeneous, and adaptive code for navigation in medial entorhinal cortex. Neuron 94, 375–387 (2017). [DOI] [PMC free article] [PubMed] [Google Scholar]
- 13.Stensola T, Stensola H, Moser MB, Moser EI, Shearing-induced asymmetry in entorhinal grid cells. Nature 518, 207–212 (2015). [DOI] [PubMed] [Google Scholar]
- 14.Stephens B. a. K. J., Foraging Theory (Princeton University Press, Princeton, NJ, 1986). [Google Scholar]
- 15.Gil M et al. , Impaired path integration in mice with disrupted grid cell firing. Nature Neuroscience, (In Press). [DOI] [PubMed]
- 16.Marozzi E, Ginzberg LL, Alenda A, Jeffery KJ, Purely translational realignment in grid cell firing patterns following nonmetric context change. Cereb Cortex June 5, Epub ahead of print (2015). [DOI] [PMC free article] [PubMed] [Google Scholar]
- 17.Fyhn M, Hafting T, Treves A, Moser MB, Moser EI, Hippocampal remapping and grid realignment in entorhinal cortex. Nature 446, 190–194 (2007). [DOI] [PubMed] [Google Scholar]
- 18.Stensola H et al. , The entorhinal map is discretized. Nature 492, 72–78 (2012). [DOI] [PubMed] [Google Scholar]
- 19.Ismakov R, Barak O, Jeffery K, Derdikman D, Grid cells encode local positional information. Curr Biol 27, 2337–2343 (2017). [DOI] [PMC free article] [PubMed] [Google Scholar]
- 20.Bush D, Barry C, Manson D, Burgess N, Using grid cells for navigation. Neuron 87, 507–520 (2015). [DOI] [PMC free article] [PubMed] [Google Scholar]
- 21.Frank LM, Brown EN, Wilson M, Trajectory encoding in the hippocampus and entorhinal cortex. Neuron 27, 169–178 (2000). [DOI] [PubMed] [Google Scholar]
- 22.Boccara CN, Nardin M, Stella F, O’Neill J, Csicsvari J, The entorhinal cognitive map is attracted to goals. (Submitted) [DOI] [PubMed]
- 23.Friedman A, Keselman MD, Gibb LG, Graybiel AM, A multistage mathematical approach to automated clustering of high-dimensional noisy data. Proc Natl Acad Sci U S A 112, 4477–4482 (2015). [DOI] [PMC free article] [PubMed] [Google Scholar]
- 24.Schmitzer-Tobert N, Jackson J, Henze D, Harris K, Redish AD, Quantitative measures of cluster quality for use in extracellular recordings. Neuroscience 131, 1–11 (2005). [DOI] [PubMed] [Google Scholar]
- 25.Campbell MG et al. , Principles governing the integration of landmark and self-motion cues in entorhinal cortical codes for navigation. Nat Neurosci 21, 1096–1106 (2018). [DOI] [PMC free article] [PubMed] [Google Scholar]
- 26.Hardcastle K, Maheswaranathan N, Ganguli S, Giocomo LM, A multiplexed, heterogeneous, and adaptive code for navigation in medial entorhinal cortex. Neuron 94, 375–387 (2017). [DOI] [PMC free article] [PubMed] [Google Scholar]
- 27.Meng L, Kramer MA, Middleton SJ, Whittington MA, Eden UT, A unified approach to linking experimental, statistical and computational analysis of spike train data. PLoS One 9, e85269 (2014). [DOI] [PMC free article] [PubMed] [Google Scholar]
- 28.Solstad T, Boccara CN, Kropff E, Moser MB, Moser EI, Representation of geometric borders in the entorhinal cortex. Science 322, 1865–1868 (2008). [DOI] [PubMed] [Google Scholar]
- 29.Bassett JP, Tullman ML, Taube JS, Lesions of the tegmentomammillary circuit in the head direction system disrupt the head direction signal in the anterior thalamus. J Neurosci 27, 7564–7577 (2007). [DOI] [PMC free article] [PubMed] [Google Scholar]
- 30.Kropff E, Carmichael JE, Moser MB, Moser EI, Speed cells in the medial entorhinal cortex. Nature 523, 419–424 (2015). [DOI] [PubMed] [Google Scholar]
- 31.Langston RF et al. , Development of the spatial representation system in the rat. Science 328, 1576–1580 (2010). [DOI] [PubMed] [Google Scholar]
- 32.Skaggs WE, McNaughton BL, Wilson MA, Barnes CA, Theta phase precession in hippocampal neuronal populations and the compression of temporal sequences. Hippocampus 6, 149–172 (1996). [DOI] [PubMed] [Google Scholar]
- 33.Yartsev MM, Witter MP, Ulanovsky N, Grid cells without theta oscillations in the entorhinal cortex of bats. Nature 479, 103–107 (2011). [DOI] [PubMed] [Google Scholar]
- 34.Stensola H et al. , The entorhinal map is discretized. Nature 492, 72–78 (2012). [DOI] [PubMed] [Google Scholar]
- 35.Stensola T, Stensola H, Moser MB, Moser EI, Shearing-induced asymmetry in entorhinal grid cells. Nature 518, 207–212 (2015). [DOI] [PubMed] [Google Scholar]
- 36.Mallory CS, Hardcastle K, Bant JS, Giocomo LM, Grid scale drives the scale and long-term stability of place maps. Nature Neuroscience 21, 270–282 (2018). [DOI] [PMC free article] [PubMed] [Google Scholar]
Associated Data
This section collects any data citations, data availability statements, or supplementary materials included in this article.


