

Abstract
Advancements in chromatographic separation are critical to in-depth top-down proteomics of complex intact protein samples. Reversed-phase liquid chromatography is the most prevalent technique for top-down proteomics. However, in cases of high complexities and large dynamic ranges, 1D-RPLC may not provide sufficient coverage of the proteome. To address these challenges, orthogonal separation techniques are often combined to improve the coverage and the dynamic range of detection. In this study, a “salt-free” high-pH RPLC was evaluated as an orthogonal dimension of separation to conventional low-pH RPLC with top-down MS. The RPLC separations with low-pH conditions (pH=2) and high-pH conditions (pH=10) were compared to confirm the good orthogonality between high-pH and low-pH RPLC’s. The offline 2D RPLC-RPLC-MS/MS analyses of intact E. coli samples were evaluated for the improvement of intact protein identifications as well as intact proteoform characterizations. Compared to the 163 proteins and 328 proteoforms identified using a 1D RPLC-MS approach, 365 proteins and 886 proteoforms were identified using the 2D RPLC-RPLC top-down MS approach. Our results demonstrate that the 2D RPLC-RPLC top-down approach holds great potential for in-depth top-down proteomics studies by utilizing the high resolving power of RPLC separations and by using mass spectrometry compatible buffers for easy sample handling for online MS analysis.
Keywords: Top-down proteomics, 2D separation, proteoform
1. INTRODUCTION
Post-translational modifications (e.g., phosphorylation, glycosylation, acetylation, etc.) and other cellular biochemical processes often result in various modified proteoforms of a single protein, which are recognized as important functional molecular signatures for disease diagnosis and potential drug targets[1]. Several mass spectrometry (MS) based proteomics approaches are currently available: bottom-up proteomics, middle-down proteomics, and top-down proteomics[2]. Bottom-up proteomics offers high sensitivity, high throughput, and good sequence coverage for studying complex protein samples[2, 3]. Middle-down proteomics refers to the partial cleavage of intact proteins into a few large fragments prior to LC-MS/MS analysis[4]. However, both techniques often result in the loss of information for different proteoforms. In top-down proteomics, intact protein samples are directly analyzed using MS without any pre-treatment. Compared to bottom-up proteomics and middle-down proteomics, top-down proteomics has the advantages of the preservation of intact proteoforms[5]. Therefore, top-down proteomics is being increasingly utilized for proteome studies. Additionally, in recent years, high-speed and high-resolution MS instrument development (i.e., orbitrap and FTICR MS) has greatly advanced the field of top-down proteomics[6-8].
One of the main challenges of top-down proteomics is the lack of high-resolution separation techniques for complex protein samples[9, 10]. Reversed phase liquid chromatography (RPLC) coupled online with MS is the most prevalent approach for studying complex intact protein samples in top-down proteomics[2, 11-14]. Various approaches have been developed to improve the separation power of the RPLC analysis[15-17]. One of the major efforts is to utilize ultra-high pressure LC systems with longer columns[18] or smaller particle sizes, improving the peak capacity of the 1D RPLC separation[19]. However, due to extreme complexities, limited sample loading amounts, and large dynamic ranges of intact protein samples, 1D RPLC alone may not provide sufficient proteome coverage for top-down proteomics. Capillary electrophoresis (CE) has also been applied as a complementary separation technique to RPLC for the separation of peptides and proteins in proteomics studies. However, the application of CE has been limited for several reasons. Low concentration and ionic strength of the analytes is required to minimize peak broadening and peak distortion. Limited sample loading amounts and relatively poor reproducibility of CE have also limited its wide application[20-22]. In addition, confident intact protein and proteoform characterizations often require good quality fragmentation peaks by averaging several MS/MS scans, and this is a rate limiting step for both 1D RPLC analysis and CE based separations.
To address these challenges, various orthogonal separation techniques (i.e., 2D LC) are often combined to improve proteome coverage and increase the dynamic range of detection[23, 24]. Different separation methods have been evaluated and optimized as complimentary separation techniques to RPLC, including hydrophilic interaction chromatography (HILIC), size exclusion chromatography (SEC), hydrophobic interaction chromatography (HIC), and ion exchange chromatography (IEC), etc. [25, 26]. Electrophoresis-based separation techniques, such as gel-eluted liquid fraction entrapment electrophoresis (GELFrEE)[27], and capillary zone electrophoresis (CZE) [21] have also been used. HILIC has been successfully applied to histone proteoform analysis[28, 29], but it is not widely applicable due to poor solubility of many proteins in organic loading buffers. SEC separates proteins based on the sizes of the proteins which provides a complementary mechanism to RPLC and is useful for the identification of large proteins. However, SEC often has low peak capacity for protein separation[30, 31]. HIC is a technique that separates proteins based on the hydrophobicity with high resolution. It also provides complementary selectivity to RPLC[32, 33]. However, HIC provides inadequate protein retention and is often limited by the concentrations of salts in the mobile phase. These problems of HIC were overcome by several studies. Ge’s group developed the online HIC-MS platform with the volatile salt ammonium tartrate[10], and more recently, introduced a novel hydrophobic HIC packing material that can retain proteins with MS-compatible salts such as ammonium acetate[33]. IEC is another commonly applied pre-fractionation approach in top-down proteomics. It offers good separation power, and is highly orthogonal to the RPLC separation. However, IEC buffers contain high concentrations of non-volatile salts that are incompatible with MS, and additional desalting steps are always required prior to MS analysis[34]. Therefore, there is a general need to develop complementary separation approaches to couple with RPLC-MS for top-down analysis.
Using high-pH RPLC as the first-dimension of separation offers the possibility of retaining the high resolution of RPLC and bringing orthogonality to the second dimension of the RPLC separation[35, 36]. It has been widely applied to bottom-up MS approaches due to the good or even better performance compared to current state-of-the-art strong cation exchange (SCX)-RPLC separation. In addition, the MS compatible mobile phases simplify the sample processing because no desalting step is required for the secondary dimension of the separation. However, this approach has not been applied to intact protein separation. In this study, we evaluate the high-pH and low-pH RPLC’s for intact protein separation using standard proteins and E. coli intact proteins. The optimized 2D separation platform was further applied to the separation and the identification of E. coli intact proteins and proteoforms. Our results demonstrate that the proposed platform provides high resolving power for both RPLC separations, good orthogonality between the two dimensions, and easy sample handling with mass spectrometry compatible buffers.
2. Material and methods
2.1 Materials and Reagents
LC/MS CHROMASOLV® grade isopropanol (IPA), acetonitrile (ACN), and water were purchased from Sigma-Aldrich (St. Louis, MO). Analytical reagent (AR) grade ammonium formate (AF) and acetic acid (HAc) were also procured from Sigma-Aldrich. Pierce™ Trifluoroacetic Acid (TFA), formic acid (FA), and the Pierce™ BCA Protein Assay Kit were obtained from Thermo Scientific (Hanover Park, IL). Three standard proteins, α-Casein from bovine milk, carbonic anhydrase from bovine erythrocytes, and cytochrome c from bovine heart were obtained from Sigma-Aldrich. The packing materials for packing C5 (Jupiter particles, 5 μm diameter, 300 Å pore size) and C18 (Jupiter particles, 5 μm diameter, 300 Å pore size) columns were purchased from Phenomenex (Torrance, CA).
2.2 Sample preparation
Standard protein solutions (CAS, α-Casein from bovine milk; CAH, carbonic anhydrase from bovine erythrocytes; Cyt, cytochrome c from bovine heart) were prepared by dissolving the lyophilized proteins into the HPLC mobile phase A (0.1% TFA in water for low-pH RPLC, 20 mM AF in water for high-pH RPLC) to a final concentration of 1.0 mg/mL. Intact soluble E. coli cell lysate proteins were obtained from the BL21 strain grown in house and by a bead-beating approach described in the literature[37]. Aliquots of protein solutions were stored at −80 °C until further use.
2.3 1st dimension RPLC separation and fractionation
The first-dimension separation was performed on a Thermo Accela HPLC system (Thermo Scientific, Hanover Park, IL). An XBridge® Protein BEH C4 column (300 Å, 3.5 μm, 2.1 mm × 250 mm) from Waters, Inc. (Milford, MA) was used. For high-pH (pH=10) 1st dimension fractionation, the mobile phase A (MPA)was 20 mM ammonium formate in water and the mobile phase B (MPB) was 20 mM ammonium formate in acetonitrile. The mobile phases were adjusted to pH 10. For low-pH (pH=2) 1st dimension fractionation, the mobile phase A was 0.1 % TFA in water and the mobile phase B was 0.1 % TFA in ACN. For both approaches, the LC flow rate was 150 μL/min, and the UV absorbance detection wavelength was set at 280 nm. Five hundred micrograms of E. coli intact proteins or 50 μg of the three standard proteins were loaded onto the column. For direct comparison between the high-pH 1st dimension RPLC separation and the low-pH 1st dimension RPLC separation, the same gradient was applied and the same column was used. The LC method was set at 5 minutes for sample loading followed by a 60-minute separation gradient from 10% to 70% of MPB. The column was regenerated by running 90% of MPB over 10 minutes and equilibrated to 97% of MPA for the next run. Twenty-four fractions were collected by a fraction collector. Each fraction was vacuum dried and stored at −20 °C. Right before the analysis using second-dimension RPLC, each fraction was reconstituted by adding 100 μL of MPA for the second-dimension RPLC (0.01 % TFA, 0.585% HAc, 2.5% IPA, and 5% ACN in water). The protein content and concentration of each fraction were evaluated by SDS-PAGE gel and BCA Protein Assay Kit.
2.4 2nd dimension top-down RPLC-MS/MS analysis
An in-house packed nano-flow capillary C5 column (5 μm, 75μm × 75 cm) was used on a modified Thermo Accela HPLC system. The RPLC conditions were similar to those previously reported[38, 39]. The mobile phase A was 0.01% TFA, 0.585% HAc, 2.5% IPA and 5% ACN in water, and the mobile phase B was 0.01% TFA, 0.585% HAc, 45% IPA and 45% ACN in water. 25 μL of each reconstituted fraction (i.e., ¼ of each fraction) was loaded on an SPE column for sample trapping and cleaning. A 280-minute gradient from 10% A to 80% B at a flow rate of about 400 nL/min was applied for the separation and the column was regenerated by running 90% of MPB for 10 minutes and equilibrated to 97% of MPA. The second-dimension RPLC was coupled directly to an LTQ Orbitrap Velos Pro mass spectrometer for MS analysis. Eluents from the second-dimension RPLC were electrosprayed from a custom designed nano-ESI source into an LTQ Orbitrap Velos Pro mass spectrometer (ThermoFisher Scientific, Bremen, Germany). The electrospray voltage was set to 2.6 kV and the heated inlet capillary temperature was optimized to 300 °C. MS data were collected at the resolving power setting of 100 000 (at m/z 400) with two micro scans. Data-dependent MS/MS acquisition was performed by selecting the top five most abundant precursor ions in the MS scan with an isolation width of 3.0 and fragmenting them using collision induced dissociation (CID) with a normalized energy of 35%. The MS/MS data were obtained at a resolving power setting of 60 000 (at m/z 400) with one micro scan. Ions with less than 4 charges were rejected for the selection of MS/MS scans. The maximum injection time for a full mass scan and MS/MS scan were set to 1000 ms and 500 ms, respectively. The AGC target was set as 1 × 10⁶ for full mass scans, and 5× 10⁵ for MS/MS scans. All the data were collected with Xcalibur 3.0 software (Thermo Fisher Scientific, Bremen, Germany).
The E.coli intact proteins were also analyzed by a single-dimensional RPLC-MS/MS (1D RPLC) to compare with the 2D RPLC-RPLC-MS/MS platform. The exact same conditions for LC and MS as the 2nd dimension top-down RPLC-MS/MS analysis were applied.
2.5 Bottom-up LC-MS/MS analysis of fractions from 1st dimension RPLC
The fractions from the first-dimension RPLC separation were trypticly digested and analyzed by the bottom-up approach for the evaluation of orthogonality between the low-pH RPLC and high-pH RPLC. Briefly, the vacuum dried fractions were reconstituted in 25 mM ammonium bicarbonate (ABC) and 6 M urea. Two hundred mM dithiothreitol (DTT) was used to reduce the disulfide bonds. Two hundred mM iodoacetamide (IAA) was used to protect the thiol groups from re-forming disulfide bonds. Trypsin was added to fractions with a protein to enzyme ratio of 50:1 and the digestion was performed overnight at 37 °C. The digested fractions were desalted and loaded onto an in-house packed C18 column (5 μm, 75μm × 15 cm) for the bottom-up study. The mobile phases were 0.1% formic acid in water (MPA) and 0.1% formic acid in ACN (MPB). The gradient was from 3% MPB to 35% MPB over 40 minutes following a 15-minute sample loading step. The column was regenerated with 90% MPB for 10 minutes and equilibrated to 3% MPB for 30 minutes.
2.6 Protein and Proteoform identification
In bottom-up experiments, peptides were identified using MSGF+[40, 41] to search the mass spectra from the LC-MS/MS analysis against the annotated E coli. database and its decoy database. Peptide identifications were filtered using an MS-GF cut-off value of 1×10⁻¹⁰ (i.e., the calculated FDR<1% at the unique peptide level). The intact protein MS/MS data were subjected to data analysis and protein identification using MS-Align+ (http://bix.ucsd.edu/projects/msalign/)[42] with the following search parameters: minimal precursor mass = 2500 Da; minimal fragment peaks per scan =10; maximum number of modifications = 2; fragment mass error tolerance = 15 ppm. MS-Align+ reported only the PrSM with the best E-value for each spectrum. LC-MS/MS data were searched against the annotated E coli. database. The false discovery rate (FDR) for protein/spectrum matches was estimated by searching top-down spectra against the human Uniprot database. A final E-value cutoff of 2×10⁻⁴[40] was used to achieve an FDR of 1%. All of the identified proteins and proteoforms were further manually evaluated.
3. Results and Discussion
3.1 Evaluation of orthogonality between high-pH RPLC and low-pH RPLC
We first evaluated the orthogonality between high-pH RPLC and low pH-RPLC using three standard proteins, α-casein, carbonic anhydrase, and cytochrome c. The standard proteins were loaded on the same column with different mobile phases (low pH and high pH) individually. The elution time was normalized to the percentage of mobile phase B for direct comparison (Figure 1). Under low-pH conditions, the elution order of the three standard proteins was Cyt, Cas, and CAH, while under high-pH conditions, the elution order was CAH, Cyt, and Cas. The change in elution order of the standard proteins indicates that under different pH conditions, different proteins will have different retention behaviors which provides the possibility of achieving orthogonal separation using low-pH RPLC and high-pH RPLC. In addition, we observed that the separation window under high-pH conditions was wider than that under the low-pH conditions. The separation window under low-pH conditions was about 12% MPB, and the separation window under the high-pH conditions was about 24% MPB further indicating the differences in retention behaviors of different proteins between high-pH RPLC and low-pH RPLC.
Figure 1.
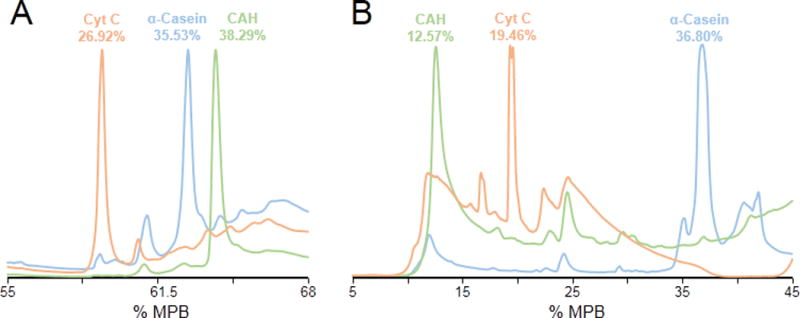
The separation of three standard proteins using (A) low pH RPLC, and (B) high pH RPLC. The retention time was normalized to the percentage of mobile phase B.
We further evaluated the performance of the high-pH RPLC and the low-pH RPLC for separating complex protein mixtures such as E. coli intact proteins. For both RPLC separations, the same elution gradient (10-70% of MPB) was employed for direct comparison. Figure 2 shows the elution profiles (UV chromatograms) of E.coli soluble intact proteins under different pH conditions. The fractions from both low-pH RPLC and high-pH RPLC were analyzed by SDS-PAGE. A significant difference between the protein elution profiles was observed on both UV chromatograms and SDS-PAGE. All fractions were analyzed by bottom-up MS for protein identification, and protein elution profiles were evaluated under different pH conditions (Figure 2). Overall, with bottom-up MS, a total of 678 unique proteins were identified using low-pH RPLC, and 840 proteins were identified using high pH RPLC with an overlap of 464 proteins between the two methods. The fraction shift was calculated to evaluate the orthogonality between different pH conditions (The fraction shift = the fraction number where the protein is most abundant under the high-pH condition – the fraction number where the protein is most abundant under the low-pH condition). Most of the identified proteins have a fraction shift larger than 2 (about 5% of the organic component), indicating good orthogonality between the two methods. Previous studies suggest that protein retention behaviors depend heavily on the composition of amino acids and their three-dimensional conformations.[43] Five amino acids (Glu, Asp, Arg, His, and Lys) can be differentially ionized under different pH conditions. These five amino acids have either acidic side chains or basic side chains of which the polarities will be reversed when the conditions change from low-pH to high-pH. Thus, the retention behavior changes under different pH conditions and depends heavily on the ratio of these five amino acids in the sequence. Other than these five charged amino acids, all other types of amino acids have higher or similar retention coefficient under high-pH condition than under low-pH condition. Therefore, proteins are often eluted in later fractions under high-pH conditions, which is consistent with our observations (Figure 2D). Compared to the separation of peptides using a high-pH and low-pH RPLC platform reported by Gilar[35], the retention time shift of intact proteins was greater than the shift of tryptic-digested peptides, which may indicate that pH conditions have greater impacts on the hydrophobicity of proteins than that of peptides. We hypothesize that the large properly folded proteins change properties more than small peptides because changing a single charge somewhere of a large protein can cause large conformational changes which will greatly affect retention behavior.
Figure 2.
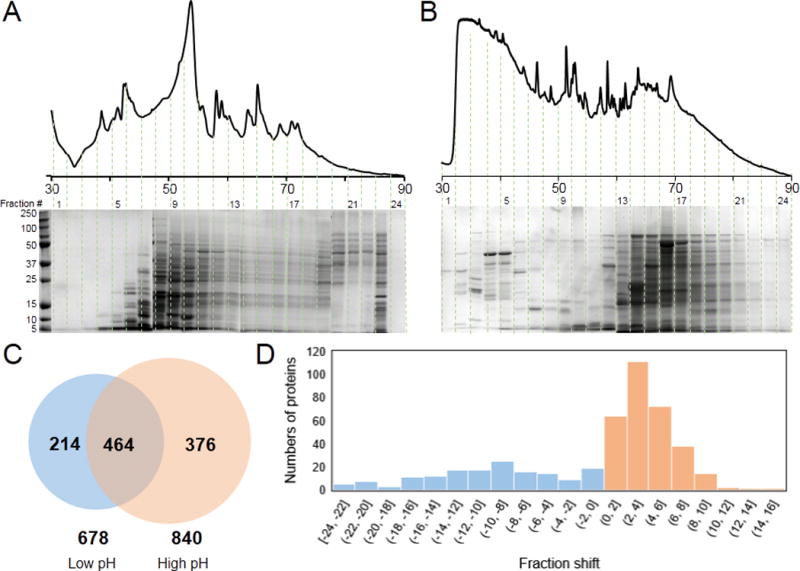
Comparison of low-pH RPLC and high-pH RPLC as the first-dimension separation. (A) UV chromatograms SDS-PAGE using low-pH RPLC; (B) UV chromatogram and SDS-PAGE using high-pH RPLC. (C) Venn diagram of unique proteins identified using bottom-up proteomics. (D) Histogram of the fraction shift from low pH RPLC to high pH RPLC.
We also compared the fraction width of each protein identified under high-pH and low-pH conditions (Fraction width refers to the number of fractions where a certain protein is identified). Fraction width under high pH is less than the fraction width under low pH, which is consistent with the greater identification number under high-pH conditions. Both the identification number and fraction width proved that RPLC with high-pH conditions provides similar or even better separation power than conventional low-pH RPLC, which shows high potential for high-pH RPLC as an orthogonal separation technique to yield high resolution 2D separations.
One interesting observation was that under high-pH conditions, the retention behaviors of proteins seem to be less molecular weight dependent. According to previous reports [44, 45], larger proteins tend to have greater retention times in RPLC due to greater hydrophobicity under low-pH conditions. One possible explanation of our observation is that protein charge distributions are different under different pH conditions. Basic amino acids such as Lys, Arg, and His are positively charged under low-pH conditions, and acidic amino acids such as Glu and Asp are negatively charged under high-pH conditions. The location of these charged groups can have effects on protein elution. It has been reported that the proteins are more positively charged at their N-terminal and C-terminal, and more negatively charged their core regions[46]. Therefore, there are less charges in the core regions under low-pH conditions and there are possibly more chain-length-dependence effects[47]. On the other hand, there are possibly more nearest-neighbor effects[48] on protein elution due to neighboring negatively charged amino acids at their core region under high-pH conditions. Still, the mechanisms of these proposed effects are unknown, and additional research is needed to further explore these observations.
Overall, our results demonstrate the good orthogonality between low-pH RPLC and high-pH RPLC, which may be combined as a 2D separation approach for top-down MS analysis. The low-pH RPLC was selected as the second-dimension separation to directly couple with MS because the protein ionization efficiency is higher under acidic conditions and proteins tend to have higher charge state distributions that can be efficiently detected under the normal Orbitrap MS scan range (i.e., 400-2000).
3.2 2D high-pH and low-pH RPLC-MS/MS analysis of E coli. intact proteins
The two-dimensional separation platform using high-pH RPLC as the first dimension and low-pH RPLC as the second dimension was applied to the identification of complex E.coli proteins. To further evaluate the orthogonality between the 1st dimension separation and 2nd dimension separation, a total of 24 sequential fractions (i.e., 1-min per fraction, Figure 1) were analyzed using the 2nd dimension RPLC-MS. For future applications, the fractionation scheme can be optimized to justify the time investment and its benefits. In addition, a targeted fraction analysis can be applied to increase the proteoform coverage of a specific protein or several proteins in a complicated background setting without significant increases in analysis time (i.e., with pre-fractionation, only several fractions need to be analyzed with 2nd RPLC-MS/MS reducing the total analysis time significantly).
To evaluate the improvement from the 1D low pH RPLC to the 2D high- and low- pH RPLC/MS platform, we analyzed E. coli intact proteins with 1D RPLC as well. Our results show that 2D pH-PRLC-RPLC separation allows better separation of protein mixtures with more proteins and proteoforms identified in the E. coli lysate. A total of 365 proteins and 886 proteoforms were identified with the 2D pH-RPLC-RPLC-MS/MS analysis, which is a significant improvement over 163 proteins and 328 proteoforms identified using the 1D RPLC method. An overlap of 121 proteins and 139 proteoforms between the 2D and 1D method was observed (Figure 3A and 3B). However, there were some proteins that were only identified in the 1D RPLC-MS/MS analysis. One possible explanation is that some proteins were unable to bind to the packing material under high pH conditions resulting in loss of identification of those proteins. A flow-through fraction will be incorporated in future studies to ensure the identification of unbound proteins.
Figure 3.
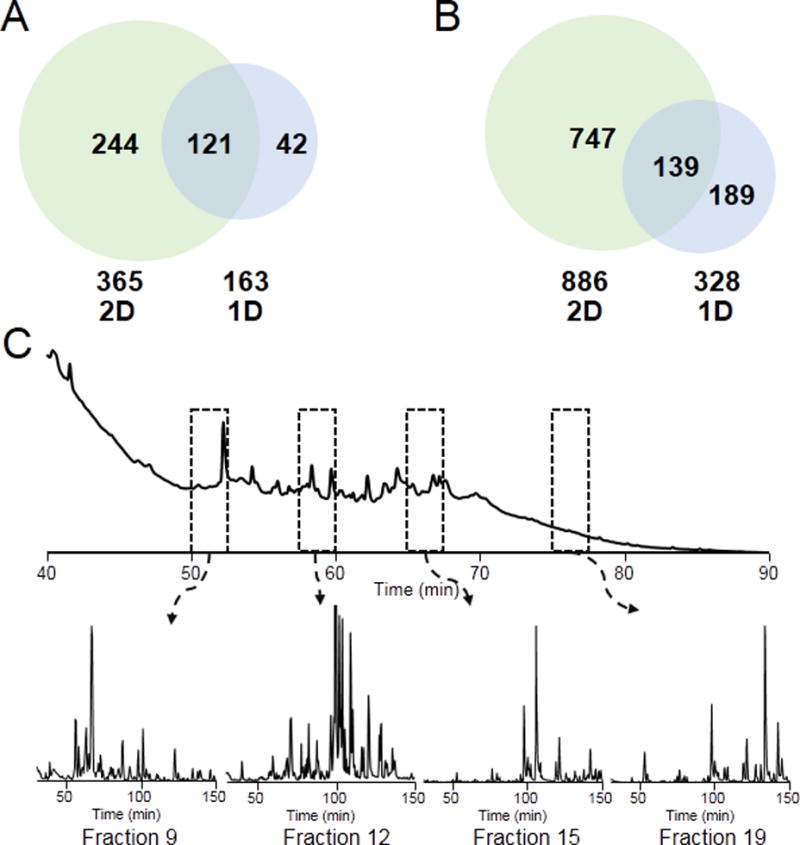
Venn diagram of numbers of (A) proteins and (B) proteoforms identified using 1D and 2D methods. (C) Base peak chromatograms of 4 representative fractions.
The base peak chromatograms (BPCs) of individual fractions in the second dimension were evaluated (i.e., the BPCs of fraction 9, 12, 15, and 19 were demonstrated in Figure 3C). Figure 4 shows the examples of three identified proteins with isotopic distributions and molecular weight from 7.7 kDa to 18 kDa. For all 4 fractions, the BPC profiles indicated good orthogonality between different pH RPLCs because most of the proteins in these fractions were eluted out over the entire separation gradient (Figure 3C). In addition, the BPCs of these 4 selected fractions have significantly different patterns as indicated in Figure 3C. These two observations further supported the good orthogonality between high pH RPLC and low pH RPLC.
Figure 4.
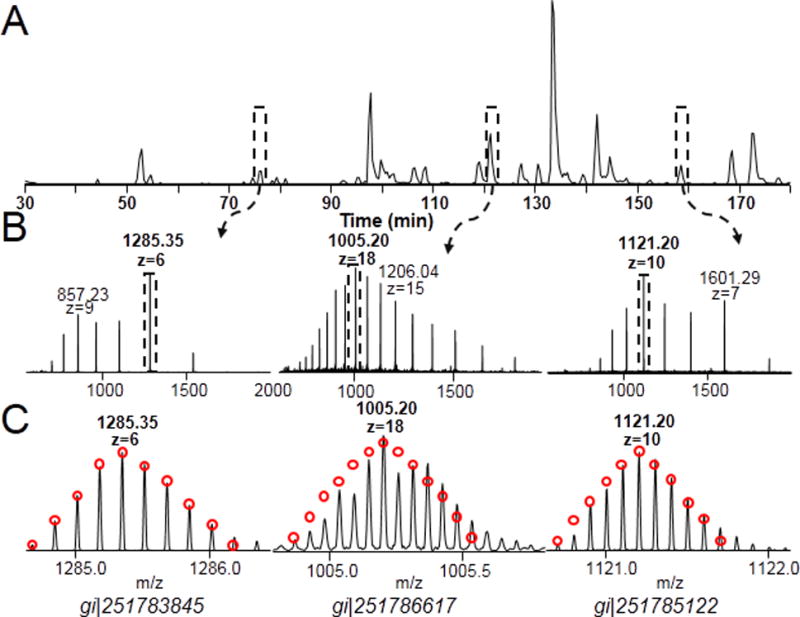
2D pH RP/RPLC/MS analysis on E.coli proteins. (A) Base peak chromatogram of second dimension top-down analysis of fraction 19. (B) Representative mass spectra of three proteins identified in fraction 19. The three proteins are periplasmic protein, peptidyl-prolyl cis-trans isomerase A, and mono-oxygenase, subunit of predicted monooxygenase. (C) Overlay of observed isotopic distrubution and theoretical isotopic distribution (red cycles).
To further evaluate the improvement of top-down MS performance using 2D pH-RPLC, the 5-minute segments (retention time from 90 minutes to 95 minutes) in the gradient of the 1D separation and the 2D separations of each fraction were compared (Figure 5). In the 1D RPLC-MS analysis, a total of 9 mass features were found in the selected 5-minute segment where6 unique proteins were identified. On the other hand, a total of 65 unique mass features were found in all the fractions in the 2D method, and 28 unique proteins were identified. Some of the identified proteins were color coded in Figure 5. A protein with the m/z of 1211.46 and charge state of 13 was identified in the 1D RPLC-MS analysis as a superoxide dismutase precursor (Cu-Zn) protein. This protein was also identified in the fraction 17 of the 2D analysis. Interestingly, with the 2D separation, another precursor ion with similar m/z (i.e., m/z=1211.57) but different charge state (i.e., z=15) was observed in the same elution window in fraction 6 of the 2D analysis, which was confirmed as gi|251785751. With 1D separation, only high-abundance proteins can be observed when the m/z of the detected ions are overlapping. Due to less sample complexity in the 2D method, more proteins can be identified, especially some low-abundance proteins or from some overlapped peaks. The identification of intact proteins benefited from the orthogonality between the different pH RPLC separations. In addition, due to the improved separation power with the 2D pH-RPLC method, more proteoforms can be identified for the same proteins. For example, only one proteoform of the stress response protein (gi|251787301) was identified with the 1D RPLC method, however, 4 different proteoforms (unmodified protein, lysine acetylation, methionine oxidation, and C-terminal degradation) were identified with the 2D method.
Figure 5.
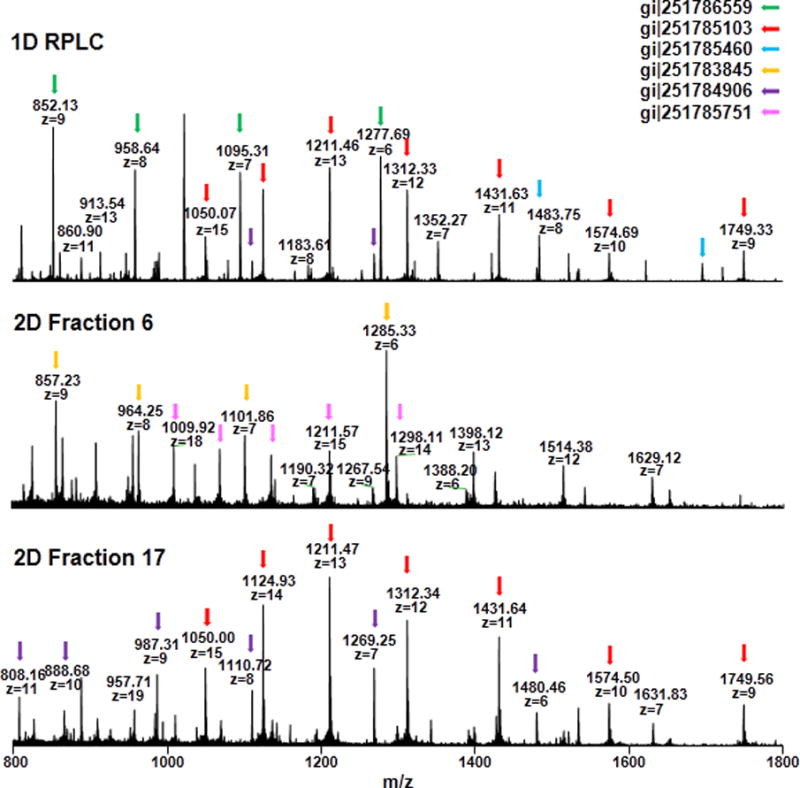
Five-minute segment (RT = 90 min to 95 min) from LC/MS runs of 1D and 2D methods.
It is known that the methionine residue can be oxidized through the interaction with molecular oxygen during sample processing steps. Therefore, we compared the identified methionine oxidized proteoforms between the 1D RPLC-MS (280 min) analysis and the 2D RPLC-MS analysis. Overall, we detected 2 methionine oxidized proteoforms in the 1D analysis, and 22 methionine oxidized proteoforms in 2D analysis. We further compared the intensities between the oxidized proteoforms and the non-oxidized proteoforms, and the average ratio was about 1:10 for both 1D and 2D. Our results do not suggest extensive oxidation arising from the additional processing steps and time in the 2D analysis. Still, the detected proteoforms with oxidized methionine are likely from sample preparation steps such as cell lysis.
Our 2D separation approach is relatively simple when compared with some other multidimensional separation approaches such as the GELFrEE[27] where an SDS removal step is necessary or and ion exchange chromatography where desalting step is often required before sample concentration. The only step after fraction collection and before sample injection is that fractions are concentrated using vacuum drying where the frozen solution sublimes under vacuum (i.e., low oxygen level).
3.3 Identification of novel intact proteoforms of apo-acyl carrier protein (ACP)
The apo-acyl carrier protein (gi|251784624) was identified in both the 1D and 2D methods. Apo-acryl carrier protein (ACP) is a unique protein working as a coenzyme in fatty acid and polyketide biosynthesis[49]. The protein is expressed in an inactive form. The phosphopantetheinyl transferase activates the protein after the expression by adding the phosphopantetheine moiety to serine 37 on ACP[50]. During the biosynthesis process, the growing fatty acid chain is tethered to the thiol group of the phosphopantetheine on serine 37. From our 2D results, we identified both inactive and active forms of ACP, namely the protein with and without phosphopantetheine modifications (short as Pho-SH in Figure 6) on serine 37 in the ACP sequence. Due to the improved separation, we were able to identify other low-abundance proteoforms, such as the proteoforms with and without N- terminal methionine, the proteoform with an oxidation on methionine 45, etc. Interestingly, we also observed several novel proteoforms with different types of oxidized thiol groups of the phosphopantetheine on serine 37. We confirmed the proteoforms with Pho-SH, Pho-SOH, Pho-SO2H, Pho-SO3H by the MS/MS results as well as by comparing the isotopic distribution of the detected peaks with the theoretical distribution (data not shown). Another oxidative proteoform was also confirmed as the glutathionylation on the thiol group of the phosphopantetheine on serine 37, which is a common non-enzymatic modification of cysteine thiol groups resulting from oxidative stress and preventing irreversible oxidation of thiol groups[51-54]. Interestingly, all of the identified oxidative forms on the thiol group of the phosphopantetheine mimic the PTMs of cysteine thiol groups, which indicates the similar reactivity of these two types of thiol groups. One thing we would like to point out is that most of the different proteoforms of ACP were observed in one fraction (i.e., fraction 12), which indicates the modifcations on the thiol group of phosphopantetheine do not greatly affect the retention times of the protein. Using the 1D method, however, we only observed one proteoform as the active apo form of ACP with the removal of the N-terminal methionine. This enhanced identification of PTMs of ACP has convincingly proven that the 2D pH-RPLC-RPLC method improved proteoform identification by simplifying the complexity of the samples. All of the identifications of PTMs were characterized by MS2 spectra generated by collision induced dissociation (supporting information).
Figure 6.
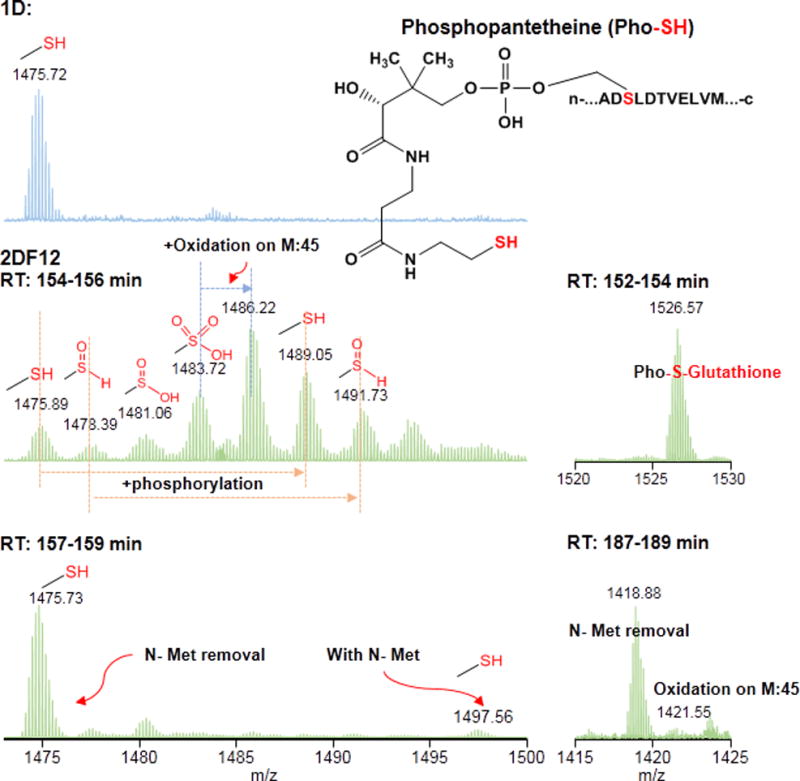
Different proteoforms of ref|YP_002998928.1 apo-acyl carrier protein (gi|251784624) identified using 1D and 2D methods.
Among all the 11 proteoforms of apo-acyl carrier protein in our study, we identified 4 oxidized forms of the thiol group. We confirmed all of the Pho-S oxidative forms by MS/MS spectra. Because the reactivity of the Pho-SH thiol group has not been studied before, it is difficult for us to conclude if the observed oxidative proteoforms are from the sample process. Interestingly, a proteoform with a free thiol group on phosphopantetheine was observed. Thiol groups normally have high reactivity in biological samples, especially with other thiol groups, forming disulfide bonds. It would be interesting to study on the function of the thiol group on the phosphopantetheine in the future.
4 CONCLUSIONS
We report the development and evaluation of a two-dimensional separation technique using a high- and low- pH RPLC/MS/MS platform for top-down proteomics. It achieves orthogonal separation by altering the pH conditions of the mobile phases while taking advantage of the high resolving power of RPLC. This allows the use of RPLC in both dimensions and offers higher resolution and better sensitivity than 1D techniques. From both the retention times of standard proteins as well as the bottom-up results of fractions from E. coli proteins using different pH RPLC’s, we have proven that altering the pH conditions of the mobile phases used in reversed phase chromatography changes the retention times of proteins in a useful manner. The platform was further applied to the identification of intact proteins in an E.coli lysate and it allowed the identification of greater numbers of proteins and showed higher proteoform coverage compared to 1D RPLC/MS top-down proteomics. This ‘salt-free’ RPLC process overcomes the disadvantage of other chromatographic methods which require complicated sample processing (i.e. buffer exchange, desalting) before MS analysis and provides the potential of easily coupling two dimensions of separation for online analysis. This is an important advance in separating complex intact protein samples for high throughput top-down proteomics.
Supplementary Material
Acknowledgments
The authors thanks Dr. Da Meng for helping with data analysis. We thank undergraduate students Jacob T. Klenke, Toni Woodard, and Iya Prytkova for helping with the sample preparation and buffer preparation. This work was partly supported by grants from NIAID CSGADP Pilot project (NIH 5U01AI101990-04, BRI no. FY15109843), NIH NIGMS R01 GM118470, and OCAST HR16-125.
References
- 1.Tran JC, et al. Mapping intact protein isoforms in discovery mode using top-down proteomics. Nature. 2011;480(7376):254–8. doi: 10.1038/nature10575. [DOI] [PMC free article] [PubMed] [Google Scholar]
- 2.Zhang Z, et al. High-throughput proteomics. Annu Rev Anal Chem (Palo Alto Calif) 2014;7:427–54. doi: 10.1146/annurev-anchem-071213-020216. [DOI] [PubMed] [Google Scholar]
- 3.Zhang Y, et al. Protein analysis by shotgun/bottom-up proteomics. Chem Rev. 2013;113(4):2343–94. doi: 10.1021/cr3003533. [DOI] [PMC free article] [PubMed] [Google Scholar]
- 4.Zhang Z, Pan H, Chen X. Mass spectrometry for structural characterization of therapeutic antibodies. Mass Spectrom Rev. 2009;28(1):147–76. doi: 10.1002/mas.20190. [DOI] [PubMed] [Google Scholar]
- 5.Soler L, et al. Data on endogenous chicken sperm peptides and small proteins obtained through Top-Down High Resolution Mass Spectrometry. Data Brief. 2016;8:1421–5. doi: 10.1016/j.dib.2016.07.050. [DOI] [PMC free article] [PubMed] [Google Scholar]
- 6.Catherman AD, Skinner OS, Kelleher NL. Top Down proteomics: facts and perspectives. Biochem Biophys Res Commun. 2014;445(4):683–93. doi: 10.1016/j.bbrc.2014.02.041. [DOI] [PMC free article] [PubMed] [Google Scholar]
- 7.Gregorich ZR, Chang YH, Ge Y. Proteomics in heart failure: top-down or bottom-up? Pflugers Arch. 2014;466(6):1199–209. doi: 10.1007/s00424-014-1471-9. [DOI] [PMC free article] [PubMed] [Google Scholar]
- 8.Bogdanov B, Smith RD. Proteomics by FTICR mass spectrometry: top down and bottom up. Mass Spectrom Rev. 2005;24(2):168–200. doi: 10.1002/mas.20015. [DOI] [PubMed] [Google Scholar]
- 9.Shishkova E, Hebert AS, Coon JJ. Now, More Than Ever, Proteomics Needs Better Chromatography. Cell Syst. 2016;3(4):321–324. doi: 10.1016/j.cels.2016.10.007. [DOI] [PMC free article] [PubMed] [Google Scholar]
- 10.Xiu L, et al. Effective protein separation by coupling hydrophobic interaction and reverse phase chromatography for top-down proteomics. Anal Chem. 2014;86(15):7899–906. doi: 10.1021/ac501836k. [DOI] [PMC free article] [PubMed] [Google Scholar]
- 11.Gregorich ZR, Ge Y. Top-down proteomics in health and disease: challenges and opportunities. Proteomics. 2014;14(10):1195–210. doi: 10.1002/pmic.201300432. [DOI] [PMC free article] [PubMed] [Google Scholar]
- 12.Camerini S, Mauri P. The role of protein and peptide separation before mass spectrometry analysis in clinical proteomics. J Chromatogr A. 2015;1381:1–12. doi: 10.1016/j.chroma.2014.12.035. [DOI] [PubMed] [Google Scholar]
- 13.Ansong C, et al. Top-down proteomics reveals a unique protein S-thiolation switch in Salmonella Typhimurium in response to infection-like conditions. Proc Natl Acad Sci U S A. 2013;110(25):10153–8. doi: 10.1073/pnas.1221210110. [DOI] [PMC free article] [PubMed] [Google Scholar]
- 14.Anderson LC, et al. Identification and Characterization of Human Proteoforms by Top-Down LC-21 Tesla FT-ICR Mass Spectrometry. J Proteome Res. 2017;16(2):1087–1096. doi: 10.1021/acs.jproteome.6b00696. [DOI] [PMC free article] [PubMed] [Google Scholar]
- 15.Tian Z, et al. Two-dimensional liquid chromatography system for online top-down mass spectrometry. Proteomics. 2010;10(20):3610–20. doi: 10.1002/pmic.201000367. [DOI] [PMC free article] [PubMed] [Google Scholar]
- 16.Vellaichamy A, et al. Size-sorting combined with improved nanocapillary liquid chromatography-mass spectrometry for identification of intact proteins up to 80 kDa. Anal Chem. 2010;82(4):1234–44. doi: 10.1021/ac9021083. [DOI] [PMC free article] [PubMed] [Google Scholar]
- 17.Catherman AD, et al. Top down proteomics of human membrane proteins from enriched mitochondrial fractions. Anal Chem. 2013;85(3):1880–8. doi: 10.1021/ac3031527. [DOI] [PMC free article] [PubMed] [Google Scholar]
- 18.Shen Y, et al. High-resolution ultrahigh-pressure long column reversed-phase liquid chromatography for top-down proteomics. J Chromatogr A. 2017 doi: 10.1016/j.chroma.2017.01.008. [DOI] [PubMed] [Google Scholar]
- 19.Jorgenson JW. Capillary liquid chromatography at ultrahigh pressures. Annu Rev Anal Chem (Palo Alto Calif) 2010;3:129–50. doi: 10.1146/annurev.anchem.1.031207.113014. [DOI] [PubMed] [Google Scholar]
- 20.Zhang W, Hankemeier T, Ramautar R. Next-generation capillary electrophoresis-mass spectrometry approaches in metabolomics. Curr Opin Biotechnol. 2017;43:1–7. doi: 10.1016/j.copbio.2016.07.002. [DOI] [PubMed] [Google Scholar]
- 21.Wojcik R, et al. Capillary electrophoresis with Orbitrap-Velos mass spectrometry detection. Talanta. 2012;88:324–9. doi: 10.1016/j.talanta.2011.10.048. [DOI] [PMC free article] [PubMed] [Google Scholar]
- 22.Fonslow BR, Yates JR., 3rd Capillary electrophoresis applied to proteomic analysis. J Sep Sci. 2009;32(8):1175–88. doi: 10.1002/jssc.200800592. [DOI] [PMC free article] [PubMed] [Google Scholar]
- 23.Roth MJ, et al. Sensitive and reproducible intact mass analysis of complex protein mixtures with superficially porous capillary reversed-phase liquid chromatography mass spectrometry. Anal Chem. 2011;83(24):9586–92. doi: 10.1021/ac202339x. [DOI] [PubMed] [Google Scholar]
- 24.Petersson P, Haselmann K, Buckenmaier S. Multiple heart-cutting two dimensional liquid chromatography mass spectrometry: Towards real time determination of related impurities of bio-pharmaceuticals in salt based separation methods. J Chromatogr A. 2016 doi: 10.1016/j.chroma.2016.09.023. [DOI] [PubMed] [Google Scholar]
- 25.Bloh AM, et al. Determination of N-formimidoylthienamycin concentration in sera from pediatric patients by high-performance liquid chromatography. J Chromatogr. 1986;375(2):444–50. doi: 10.1016/s0378-4347(00)83741-x. [DOI] [PubMed] [Google Scholar]
- 26.Yang Y, et al. Studies on the effect of column angle in figure-8 centrifugal counter-current chromatography. J Chromatogr A. 2011;1218(36):6128–34. doi: 10.1016/j.chroma.2010.11.014. [DOI] [PMC free article] [PubMed] [Google Scholar]
- 27.Melani RD, et al. CN-GELFrEE - Clear Native Gel-eluted Liquid Fraction Entrapment Electrophoresis. J Vis Exp. 2016;(108):53597. doi: 10.3791/53597. [DOI] [PMC free article] [PubMed] [Google Scholar]
- 28.Tian Z, et al. Enhanced top-down characterization of histone post-translational modifications. Genome Biol. 2012;13(10):R86. doi: 10.1186/gb-2012-13-10-r86. [DOI] [PMC free article] [PubMed] [Google Scholar]
- 29.Zhou M, et al. Profiling Changes in Histone Post-translational Modifications by Top-Down Mass Spectrometry. Methods Mol Biol. 2017;1507:153–168. doi: 10.1007/978-1-4939-6518-2_12. [DOI] [PubMed] [Google Scholar]
- 30.Wen J, Arakawa T, Philo JS. Size-exclusion chromatography with on-line light-scattering, absorbance, and refractive index detectors for studying proteins and their interactions. Anal Biochem. 1996;240(2):155–66. doi: 10.1006/abio.1996.0345. [DOI] [PubMed] [Google Scholar]
- 31.Simpson DC, et al. Using size exclusion chromatography-RPLC and RPLC-CIEF as two-dimensional separation strategies for protein profiling. Electrophoresis. 2006;27(13):2722–33. doi: 10.1002/elps.200600037. [DOI] [PMC free article] [PubMed] [Google Scholar]
- 32.Queiroz JA, Tomaz CT, Cabral JM. Hydrophobic interaction chromatography of proteins. J Biotechnol. 2001;87(2):143–59. doi: 10.1016/s0168-1656(01)00237-1. [DOI] [PubMed] [Google Scholar]
- 33.Chen B, et al. Online Hydrophobic Interaction Chromatography-Mass Spectrometry for Top-Down Proteomics. Anal Chem. 2016;88(3):1885–91. doi: 10.1021/acs.analchem.5b04285. [DOI] [PMC free article] [PubMed] [Google Scholar]
- 34.Mohammed S, Heck A., Jr Strong cation exchange (SCX) based analytical methods for the targeted analysis of protein post-translational modifications. Curr Opin Biotechnol. 2011;22(1):9–16. doi: 10.1016/j.copbio.2010.09.005. [DOI] [PubMed] [Google Scholar]
- 35.Gilar M, et al. Two-dimensional separation of peptides using RP-RP-HPLC system with different pH in first and second separation dimensions. J Sep Sci. 2005;28(14):1694–703. doi: 10.1002/jssc.200500116. [DOI] [PubMed] [Google Scholar]
- 36.Yang F, et al. High-pH reversed-phase chromatography with fraction concatenation for 2D proteomic analysis. Expert Rev Proteomics. 2012;9(2):129–34. doi: 10.1586/epr.12.15. [DOI] [PMC free article] [PubMed] [Google Scholar]
- 37.Chowdhury SM, et al. Identification of cross-linked peptides after click-based enrichment using sequential collision-induced dissociation and electron transfer dissociation tandem mass spectrometry. Anal Chem. 2009;81(13):5524–32. doi: 10.1021/ac900853k. [DOI] [PMC free article] [PubMed] [Google Scholar]
- 38.Wu S, et al. An integrated top-down and bottom-up strategy for broadly characterizing protein isoforms and modifications. J Proteome Res. 2009;8(3):1347–57. doi: 10.1021/pr800720d. [DOI] [PMC free article] [PubMed] [Google Scholar]
- 39.Wu S, et al. Integrated workflow for characterizing intact phosphoproteins from complex mixtures. Anal Chem. 2009;81(11):4210–9. doi: 10.1021/ac802487q. [DOI] [PMC free article] [PubMed] [Google Scholar]
- 40.Kim S, Gupta N, Pevzner PA. Spectral probabilities and generating functions of tandem mass spectra: a strike against decoy databases. J Proteome Res. 2008;7(8):3354–63. doi: 10.1021/pr8001244. [DOI] [PMC free article] [PubMed] [Google Scholar]
- 41.Kim S, Pevzner PA. MS-GF+ makes progress towards a universal database search tool for proteomics. Nat Commun. 2014;5:5277. doi: 10.1038/ncomms6277. [DOI] [PMC free article] [PubMed] [Google Scholar]
- 42.Liu X, et al. Protein identification using top-down. Mol Cell Proteomics. 2012;11(6):M111 008524. doi: 10.1074/mcp.M111.008524. [DOI] [PMC free article] [PubMed] [Google Scholar]
- 43.Guo DC, et al. Prediction of Peptide Retention Times in Reversed-Phase High-Performance Liquid-Chromatography .1. Determination of Retention Coefficients of Amino-Acid-Residues of Model Synthetic Peptides. Journal of Chromatography. 1986;359:499–517. [Google Scholar]
- 44.Geng X, Regnier FE. Retention model for proteins in reversed-phase liquid chromatography. J Chromatogr. 1984;296:15–30. doi: 10.1016/s0021-9673(01)96399-x. [DOI] [PubMed] [Google Scholar]
- 45.Mant CT, Zhou NE, Hodges RS. Correlation of protein retention times in reversed-phase chromatography with polypeptide chain length and hydrophobicity. J Chromatogr. 1989;476:363–75. doi: 10.1016/s0021-9673(01)93882-8. [DOI] [PubMed] [Google Scholar]
- 46.Requiao RD, et al. Protein charge distribution in proteomes and its impact on translation. PLoS Comput Biol. 2017;13(5):e1005549. doi: 10.1371/journal.pcbi.1005549. [DOI] [PMC free article] [PubMed] [Google Scholar]
- 47.Chow CC, et al. Chain length dependence of apomyoglobin folding: structural evolution from misfolded sheets to native helices. Biochemistry. 2003;42(23):7090–9. doi: 10.1021/bi0273056. [DOI] [PubMed] [Google Scholar]
- 48.Jha AK, et al. Helix, sheet, and polyproline II frequencies and strong nearest neighbor effects in a restricted coil library. Biochemistry. 2005;44(28):9691–702. doi: 10.1021/bi0474822. [DOI] [PubMed] [Google Scholar]
- 49.Vanaman TC, Wakil SJ, Hill RL. The complete amino acid sequence of the acyl carrier protein of Escherichia coli. J Biol Chem. 1968;243(24):6420–31. [PubMed] [Google Scholar]
- 50.Beld J, et al. The phosphopantetheinyl transferases: catalysis of a post-translational modification crucial for life. Nat Prod Rep. 2014;31(1):61–108. doi: 10.1039/c3np70054b. [DOI] [PMC free article] [PubMed] [Google Scholar]
- 51.Chung HS, et al. Cysteine oxidative posttranslational modifications: emerging regulation in the cardiovascular system. Circ Res. 2013;112(2):382–92. doi: 10.1161/CIRCRESAHA.112.268680. [DOI] [PMC free article] [PubMed] [Google Scholar]
- 52.Garcia-Santamarina S, Boronat S, Hidalgo E. Reversible cysteine oxidation in hydrogen peroxide sensing and signal transduction. Biochemistry. 2014;53(16):2560–80. doi: 10.1021/bi401700f. [DOI] [PubMed] [Google Scholar]
- 53.Kim HJ, et al. ROSics: chemistry and proteomics of cysteine modifications in redox biology. Mass Spectrom Rev. 2015;34(2):184–208. doi: 10.1002/mas.21430. [DOI] [PMC free article] [PubMed] [Google Scholar]
- 54.Dalle-Donne I, et al. Protein S-glutathionylation: a regulatory device from bacteria to humans. Trends Biochem Sci. 2009;34(2):85–96. doi: 10.1016/j.tibs.2008.11.002. [DOI] [PubMed] [Google Scholar]
Associated Data
This section collects any data citations, data availability statements, or supplementary materials included in this article.