

Abstract
Background
Omega‐6 fats are polyunsaturated fats vital for many physiological functions, but their effect on cardiovascular disease (CVD) risk is debated.
Objectives
To assess effects of increasing omega‐6 fats (linoleic acid (LA), gamma‐linolenic acid (GLA), dihomo‐gamma‐linolenic acid (DGLA) and arachidonic acid (AA)) on CVD and all‐cause mortality.
Search methods
We searched CENTRAL, MEDLINE and Embase to May 2017 and clinicaltrials.gov and the World Health Organization International Clinical Trials Registry Platform to September 2016, without language restrictions. We checked trials included in relevant systematic reviews.
Selection criteria
We included randomised controlled trials (RCTs) comparing higher versus lower omega‐6 fat intake in adults with or without CVD, assessing effects over at least 12 months. We included full texts, abstracts, trials registry entries and unpublished studies. Outcomes were all‐cause mortality, CVD mortality, CVD events, risk factors (blood lipids, adiposity, blood pressure), and potential adverse events. We excluded trials where we could not separate omega‐6 fat effects from those of other dietary, lifestyle or medication interventions.
Data collection and analysis
Two authors independently screened titles/abstracts, assessed trials for inclusion, extracted data, and assessed risk of bias of included trials. We wrote to authors of included studies. Meta‐analyses used random‐effects analysis, while sensitivity analyses used fixed‐effects and limited analyses to trials at low summary risk of bias. We assessed GRADE quality of evidence for 'Summary of findings' tables.
Main results
We included 19 RCTs in 6461 participants who were followed for one to eight years. Seven trials assessed the effects of supplemental GLA and 12 of LA, none DGLA or AA; the omega‐6 fats usually displaced dietary saturated or monounsaturated fats. We assessed three RCTs as being at low summary risk of bias.
Primary outcomes: we found low‐quality evidence that increased intake of omega‐6 fats may make little or no difference to all‐cause mortality (risk ratio (RR) 1.00, 95% confidence interval (CI) 0.88 to 1.12, 740 deaths, 4506 randomised, 10 trials) or CVD events (RR 0.97, 95% CI 0.81 to 1.15, 1404 people experienced events of 4962 randomised, 7 trials). We are uncertain whether increasing omega‐6 fats affects CVD mortality (RR 1.09, 95% CI 0.76 to 1.55, 472 deaths, 4019 randomised, 7 trials), coronary heart disease events (RR 0.88, 95% CI 0.66 to 1.17, 1059 people with events of 3997 randomised, 7 trials), major adverse cardiac and cerebrovascular events (RR 0.84, 95% CI 0.59 to 1.20, 817 events, 2879 participants, 2 trials) or stroke (RR 1.36, 95% CI 0.45 to 4.11, 54 events, 3730 participants, 4 trials), as we assessed the evidence as being of very low quality. We found no evidence of dose‐response or duration effects for any primary outcome, but there was a suggestion of greater protection in participants with lower baseline omega‐6 intake across outcomes.
Additional key outcomes: we found increased intake of omega‐6 fats may reduce myocardial infarction (MI) risk (RR 0.88, 95% CI 0.76 to 1.02, 609 events, 4606 participants, 7 trials, low‐quality evidence). High‐quality evidence suggests increasing omega‐6 fats reduces total serum cholesterol a little in the long term (mean difference (MD) −0.33 mmol/L, 95% CI −0.50 to −0.16, I2 = 81%; heterogeneity partially explained by dose, 4280 participants, 10 trials). Increasing omega‐6 fats probably has little or no effect on adiposity (body mass index (BMI) MD −0.20 kg/m2, 95% CI −0.56 to 0.16, 371 participants, 1 trial, moderate‐quality evidence). It may make little or no difference to serum triglycerides (MD −0.01 mmol/L, 95% CI −0.23 to 0.21, 834 participants, 5 trials), HDL (MD −0.01 mmol/L, 95% CI −0.03 to 0.02, 1995 participants, 4 trials) or low‐density lipoprotein (MD −0.04 mmol/L, 95% CI −0.21 to 0.14, 244 participants, 2 trials, low‐quality evidence).
Authors' conclusions
This is the most extensive systematic assessment of effects of omega‐6 fats on cardiovascular health, mortality, lipids and adiposity to date, using previously unpublished data. We found no evidence that increasing omega‐6 fats reduces cardiovascular outcomes other than MI, where 53 people may need to increase omega‐6 fat intake to prevent 1 person from experiencing MI. Although benefits of omega‐6 fats remain to be proven, increasing omega‐6 fats may be of benefit in people at high risk of MI. Increased omega‐6 fats reduce serum total cholesterol but not other blood fat fractions or adiposity.
Plain language summary
Omega‐6 fats to prevent and treat heart and circulatory diseases
Review question
We reviewed randomised trials (participants had an equal chance to be assigned to either treatment) examining effects of higher omega‐6 fats compared to lower omega‐6 fats on deaths and heart and circulatory diseases (cardiovascular diseases (CVD), which include heart attacks and strokes).
Background
Omega‐6 fats are essential, we must obtain some from food. They are important for regulating energy production (part of metabolism), bone, skin and hair health. Many foods contain omega‐6 fats, particularly vegetable oils and nuts. Omega‐6 fats include linoleic acid (LA), gamma‐linolenic acid (GLA), dihomo‐gamma‐linolenic acid (DGLA) and arachidonic acid (AA).
Some evidence suggests that a higher intake of omega‐6 fats, along with a lower intake of saturated fat (from animal sources such as meat and cheese) can reduce coronary heart disease. In contrast, there is concern that high levels of omega‐6 fats may worsen cardiovascular risk by increasing inflammation. Overall, there is no conclusive evidence on the benefits or harms of omega‐6 fat intake on heart and circulatory diseases or on other health outcomes.
Study characteristics
Evidence in this review is current to May 2017. We found 19 studies recruiting 6461 adults. These studies assessed the effects of higher compared to lower omega‐6 fat intake on heart and circulatory diseases as well as deaths. We found that three trials were highly trustworthy (with good designs that produce reliable evidence). Studies took place in North America, Asia, Europe and Australia, and eight were funded only by national or charitable agencies. Participants increased their omega‐6 fats or maintained their usual fats for at least one year and up to eight years.
Key results
We found that increasing omega‐6 fats may make little or no difference to deaths or cardiovascular events but may reduce risk of heart attacks (low‐quality evidence). Evidence was weakened by study design problems, small numbers of events, low numbers of participants from developing countries, and few women.
Evidence suggests that increasing omega‐6 fats reduces blood cholesterol (high‐quality evidence), probably has little or no effect on body weight adjusted for height (all moderate‐quality evidence), and may make little or no difference to triglycerides, high‐density lipoprotein (HDL, the 'good' cholesterol) or low‐density lipoprotein (LDL, the 'bad' cholesterol, low‐quality evidence).
Summary of findings
Background
Description of the condition
Cardiovascular diseases (CVDs) are a group of conditions that affect the heart and blood vessels (WHO 2017), and they include cerebrovascular disease, coronary heart disease (CHD), and peripheral arterial disease (PAD). One mechanism thought to cause CVD is atherosclerosis, which is when a person's arteries become narrowed by plaques or atheroma (NHS 2016). This narrowing can lead to angina. Atherosclerosis can cause myocardial infarction (MI) or stroke when part of the plaque breaks off and blocks a smaller vessel, or when a blood clot is formed on the rough plaque surface, blocking the vessel. A narrowed or blocked artery restricts blood flow limiting the amount of blood and oxygen reaching organs or tissue (BHF 2017). Arteries may narrow and become less elastic with age, and the atherosclerotic process may accelerate under conditions including smoking, high cholesterol, hypertension, obesity, sedentary lifestyle, and specific ethnicity (NHS 2016). Rupture of unstable plaques may also cause CVD by activating an inflammatory response. This causes the atherosclerotic plaque structure to weaken and rupture further, leading to superimposed thrombosis (blood clots, Spagnoli 2007).
CVDs are the leading causes of death worldwide (WHO 2017). In 2015 an estimated 31% of all global deaths were due to CVD (WHO 2017). The burden of CVD also varies substantially between regions (Müller‐Nordhorn 2008), with low‐ and middle‐income countries (LMICs) disproportionally affected (WHO 2017). In 2001, three‐quarters of global deaths from CHD took place in LMICs (Gaziano 2010), and in 2015 37% of premature deaths (deaths before 70 years of age) in LMICs were from CVD (WHO 2017). Gaziano 2010 suggested that this rapid increase in CHD burden is attributable to increased lifespan, socioeconomic changes and acquisition of behavioural risk factors.
Targeting modifiable risk factors, including dietary factors, for CVD prevention is a key public health priority. Studies have found a number of diet and dietary factors to be associated with CVD risk, including low consumption of potassium, fruit and vegetables (Aburto 2013b; AIHW 2016), as well as high intake of salt and saturated fat (Aburto 2013a; Hooper 2015). Such risk factors are extremely important since their modification has the potential to lower CVD risk, making them a main target for CVD primary prevention.
Description of the intervention
Polyunsaturated fatty acids (PUFAs) are characterised by the presence of at least two carbon‐carbon double bonds. Omega‐6 (n‐6) and omega‐3 (n‐3) fats are both PUFAs. The distinction between omega‐6 and omega‐3 fats is based on the position and distance of this double bond from the methyl group end of the fatty acid molecule (Calder 2013; Hall 2009). For omega‐6 fats, the double bond pair is sixth from the methyl terminus while for omega‐3 fats, it is third (Calder 2013; Harris 2009). Linoleic acid (LA) (18:2n6), one of the omega‐6 fats, is an essential fatty acid because the human body is unable to synthesise it, so people must obtain it through diet (Groff 1995). Gamma‐linolenic acid (GLA, 18:3n6), another omega‐6 fat, may become conditionally essential in the event of reduced activity of delta‐6‐desaturase (the enzyme that converts LA into GLA, Rincón‐Cervera 2009).
Other members of the omega‐6 fats group include dihomo‐gamma‐linolenic acid (DGLA) (20:3n6) and arachidonic acid (AA) (20:4n6), which can be derived from LA and synthesised in the healthy human body (though synthesis is minimal, Hussein 2005). LA is widely available in the diet from a variety of sources, such as vegetable oils, nut oils, nuts, poultry, meat, egg, milk, margarines and spreads (Russo 2009), while DGLA is not found in the diet.
Omega‐6 fats play a vital role in many physiological functions, stimulating skin and hair growth, regulating metabolism and maintaining bone health (Baylink 1993). However, evidence on the effect of omega‐6 fats on CVD risk remains controversial.
How the intervention might work
Dietary fat modification may improve CVD risk and risk factors. Mensink 2003 searched for trials between 1979 to 1999 examining effects of individual fatty acids on blood lipids.They included 60 trials randomising 1672 participants and suggested a beneficial effect of PUFAs (including omega‐6 fats) on blood lipids (Mensink 2003). Other studies suggest that a proportionally higher intake of omega‐6 fats along with a low intake of saturated fat is associated with significant reductions in CHD (Katan 2009).
A meta‐analysis of observational studies aimed to evaluate studies assessing the relationship between blood/tissue omega‐6 fat content and CHD events and was based on 25 case‐control studies with 1998 cases and 6913 controls. Harris 2007 found that LA content of blood and tissues was inversely associated with CHD risk, while AA was not related to CHD risk. A more recent meta‐analysis included only prospective cohort studies that provided multivariate‐adjusted risk estimates for dietary LA consumption on CHD endpoints (Farvid 2014). The search identified 13 cohort studies that included 310,602 individuals and 12,479 CHD events, including 5882 CHD deaths. Farvid 2014 reported an inverse relationship between LA intake and CHD events and deaths. They estimated that replacing 5% of energy (5% E) from saturated fat intake with LA would be associated with 9% lower risk of CHD events and a 13% lower risk of CHD deaths (Farvid 2014).
These observational data are supported by a meta‐analysis of eight RCTs including 13,614 participants, which found that replacing saturated fatty acids by increasing PUFA consumption, including omega‐6 fats, reduced the occurrence of CHD events (Mozaffarian 2010). A Cochrane Review of RCTs investigated the effect of reducing or modifying dietary fats on total CVD mortality and morbidity over at least six months. The findings suggest that modifying dietary fat by replacing saturated fats with monounsaturated fatty acids or PUFAs reduces CVD risk (Hooper 2011). The American Heart Association recommends replacing saturated and trans fats with monounsaturated or polyunsaturated fats, stating that "consumption of at least 5% to 10% of energy from omega‐6 PUFAs reduces the risk of CHD relative to lower intakes" (Eckel 2014; Harris 2009).
However, there is concern that consuming a relatively high proportion of dietary omega‐6 fats compared with omega‐3 fats increases production of 2‐series prostaglandins and 4‐series leukotrienes to the detriment of 3‐series prostaglandins and 5‐series leukotrienes. As the 2‐series prostaglandins and 4‐series leukotrienes exert a more potent pro‐inflammatory effect, and inflammation leads to increased blood clotting, omega‐6 fats may theoretically worsen cardiovascular risk (Russo 2009; Siriwardhana 2012; Tortosa‐Caparós 2017). This relationship is disputed, but it has led to the concept that the ratio between omega‐6 and omega‐3 fats, rather than absolute intakes, may be crucial (Bibus 2015). Increasing omega‐3 fat intake may have different effects than reducing omega‐6 fat intakes, even though their effect on the ratio may be identical (Bibus 2015). There is also concern that highly unsaturated fatty acids such as AA may increase the susceptibility of lipoproteins such as low‐ and very low‐density lipoproteins to oxidation, making them more atherogenic (Russo 2009).
Some studies have found no association between omega‐6 fat intake and risk of CVD. Earlier prospective cohort studies found no association between dietary intakes of omega‐6 fats and stroke (He 2003), CHD (McGee 1984; Pietinen 1997), and CHD mortality (Esrey 1996). Chowdhury 2014 conducted a systematic review of prospective, observational studies and RCTs, reporting non‐significant associations between omega‐6 fat supplementation and coronary disease or outcomes.
Why it is important to do this review
Omega‐6 fats are essential fatty acids that play a vital role in many physiological functions, and everyone consumes some. There is controversy concerning the effect of increasing the amount people eat on cardiovascular risk. Although data tend to support a protective role for omega‐6 fats in CVD, results from clinical trials and observational studies are inconsistent. There is a need to review the current evidence from randomised controlled trials (RCTs). An up‐to‐date systematic review is required to clarify the association between CVD risk and omega‐6 fat intake. This can underpin guidance for national and international agencies, practitioners, and members of the public.
The World Health Organization (WHO) is currently updating its guidance on polyunsaturated fatty acid intake in adults and children. The update and extension of scope of this review was commissioned by WHO in order to inform and contribute to the development of updated WHO recommendations. The results of this review including GRADE assessments were discussed and reviewed by the WHO Nutrition Guidance Expert Advisory Group (NUGAG) Subgroup on Diet and Health as part of WHO’s guideline development process. This review updates Al‐Khudairy 2015 and forms a set with Abdelhamid 2018a (assessing effects of omega‐3 fats), Abdelhamid 2018b (which overviews health effects of increasing polyunsaturated fats generally), reviews of diabetes and glucose tolerance (Brown 2017), inflammatory bowel disease (IBD) (Thorpe 2017), cognition (Jimoh 2017), depression (Hanson 2017a), bone and muscle health (Abdelhamid 2017), and cancers (Hanson 2017b). This review systematically assessed effects of omega‐6 fats on cardiovascular outcomes, mortality, lipids and body fatness.
We undertook this Cochrane Review to assess the current evidence. The review extends Al‐Khudairy 2015 in that it includes studies on participants with or without CVD at baseline and slightly extends the outcomes of interest. We included RCTs that stated an intention to increase omega‐6 fats by following dietary advice, omega‐6 fat supplementation, or a provided diet, compared to usual diets or diets providing fewer omega‐6 fats. We examined effects over longer time periods (at least 12 months) as these are most relevant for public health interventions and assessing effects on CVD events, deaths and adiposity.
Objectives
To assess the effects of increasing omega‐6 fats (linoleic acid (LA), gamma‐linolenic acid (GLA), dihomo‐gamma‐linolenic acid (DGLA) and arachidonic acid (AA)) for CVD and all‐cause mortality.
Methods
Criteria for considering studies for this review
Types of studies
We included randomised controlled trials (RCTs) that compared higher versus lower omega‐6 fat intake and assessed effects over at least 12 months of continuous involvement. We included studies reported as full texts, those published as abstracts only, as trials registry entries and/or unpublished data. We did not include cross‐over studies (unless we could use data from the first part of the cross‐over only), as this design is inappropriate for outcomes such as CVD events or mortality, but we did include cluster‐randomised studies, as long as there were at least six clusters (to facilitate appropriate statistical testing, MRC 2002).
Types of participants
We included studies in adults (18 years of age and above) regardless of whether they were healthy, at increased risk of cancer, undergoing – or had undergone – coronary artery bypass grafting or angioplasty, or if they had current or previous CVD, diabetes mellitus, rheumatoid arthritis, depression, cognitive impairment or multiple sclerosis. We were interested in both primary and secondary prevention, so we included people with or without a history of CVD.
We excluded participants who were pregnant or acutely ill, defining acute illness as having a current diagnosis of cancer, HIV or AIDS; undergoing heart or renal transplantation; on haemodialysis; with immunoglobulin A (IgA) glomerulonephritis; or having any other renal problem except diabetic nephropathy. Our reasoning was to exclude people with conditions that may affect the relationship between polyunsaturated fats and CVD events.
Where trials included some adults and some people under 18 years of age, we included the study if at least 90% of the participants were aged 18 years or over at baseline, or where outcomes for adults could be separated from those for younger people.
Types of interventions
Eligible trials compared higher versus lower omega‐6 fat (including LA, GLA, DGLA, AA, or any combination) intakes. The intervention had to be dietary supplementation, a provided diet, or advice on diet. The advice, foodstuffs or supplements had to aim to increase or decrease intake of omega‐6 fats, or a dietary component high in omega‐6 fats such as sunflower oil, or, if no clear aim was stated (but implied, such as aiming to provide a 'heart health' or 'Mediterranean' diet) then the intervention had to achieve an increase or decrease of at least 10% of the baseline omega‐6 fat level. Energy replacement for changes in omega‐6 fat intake could be by carbohydrates, saturated fats, protein, alcohol, or monounsaturated fats.
Supplementation had to be in oil or capsule form, or as foodstuffs provided to be consumed by mouth (we excluded enteral and parenteral feeds and enemas).
We excluded studies that included multiple risk factor intervention on lifestyle factors such as weight reduction, smoking or physical activity, or differential dietary interventions not involving dietary fats (except where that other intervention was a direct replacement for polyunsaturated fats, or the effect of diet or supplementation could be separated out from the other interventions).
Studies were eligible if they compared the effect of this intervention versus usual diet, no advice, no supplementation or placebo (as appropriate) with a lower omega‐6 fat intake. We excluded studies that aimed to increase both omega‐6 and omega‐3 fats (these were included in Abdelhamid 2018a).
Types of outcome measures
We included studies where data on any primary or secondary outcome had been collected by the investigators.
Where it was clear that no participants experienced a particular primary or secondary outcome (and data were not available on other primary or secondary outcomes), we included the trial or study arm in the review for comprehensiveness, but these did not contribute data.
Primary outcomes
All‐cause mortality
CVD mortality
CVD events (all available data on fatal and non‐fatal myocardial infarction, angina and/or stroke)
Coronary heart disease events: myocardial infarction (fatal or non‐fatal) or angina
Major adverse cardiac and cerebrovascular events (MACCEs), used where we could assess the numbers of participants experiencing fatal and non‐fatal myocardial infarction, unstable angina and stroke
Stroke (total, fatal and non‐fatal, ischaemic and haemorrhagic)
We assessed dichotomous outcomes at the latest point of available follow‐up within the RCT and continuous outcomes at the latest point available in the trial (and after at least 12 months).
Secondary outcomes
Myocardial infarction (MI, total, fatal and non‐fatal)
Angina
Sudden cardiac death
Atrial fibrillation (AF) (new or recurrent, ventricular tachycardia and/or ventricular fibrillation)
Heart failure
Revascularisation (angioplasty or coronary artery bypass grafting)
Peripheral arterial disease (PAD)
Serum lipids (including total cholesterol, fasting triglycerides, high‐ (HDL) and low‐density lipoprotein (LDL) cholesterol)
Body mass index (BMI), body weight and other measures of adiposity
Tertiary outcomes
Blood pressure (systolic and diastolic)
Quality of life measures (such as self‐reported health and time off work)
Economic costs
Serious adverse events (including breast cancer, all cancers, inflammatory bowel disease, diabetes, depression, and neurocognitive outcomes such as dementia)
We collated data on tertiary outcomes where they were present in included trials (so we did not truly systematically review them in this paper). Data on cancers (Hanson 2017b), inflammatory bowel disease (Thorpe 2017), neurocognitive outcomes including dementia (Jimoh 2017), diabetes (Brown 2017), bone and functional outcomes (Abdelhamid 2017), and depression (Hanson 2017a) are reported fully and systematically in associated reviews within this series.
Key outcomes
When the World Health Organization (WHO) Nutrition Guidance Expert Advisory Group (NUGAG) requested this review update they named the following as key outcomes to inform their planned dietary guidance:
All‐cause mortality
CVD mortality
CVD events
CHD events
Stroke
Myocardial infarction
Serum lipids including total cholesterol, fasting triglycerides, HDL and LDL
Measures of adiposity (body weight and BMI)
We were not able make all of these key outcomes into primary outcomes. However, because WHO NUGAG Subgroup on Diet and Health will use these outcomes to underpin guidance, we carried out sensitivity analyses, subgroup analyses and GRADE assessment of quality of evidence for them, even when they were not primary outcomes. We explained this change to our methods in Differences between protocol and review.
Search methods for identification of studies
Electronic searches
We searched the following electronic databases on 2 May 2017 to identify reports of relevant randomised clinical trials.
Cochrane Central Register of Controlled Trials (CENTRAL; 2017 Issue 4) in the Cochrane Library.
Epub Ahead of Print, In‐Process & Other Non‐Indexed Citations, MEDLINE Daily and MEDLINE Ovid (1946 to 2 May 2017).
Embase Classic and Embase Ovid (1947 to 1 May 2017).
We adapted the search strategy for MEDLINE (Ovid) from the search strategy in Al‐Khudairy 2015 (Appendix 1), and we used the single search strategy to locate trials for this review and for Abdelhamid 2018b. We adapted this complex strategy for use in the other databases (Appendix 2). We applied the Cochrane sensitivity and precision‐maximising RCT filter to MEDLINE (Ovid) and Embase, applying terms recommended in the Cochrane Handbook for Systematic Reviews of Interventions (Lefebvre 2011).
As we were also running searches in April 2017 for a concurrent Cochrane Review of the effects of omega‐3 fats on health outcomes (Abdelhamid 2018a), and there was a great deal of overlap between the searches, the results of these searches were de‐duplicated with the results from the searches for this review and all the titles and abstracts assessed as a single set. We created a dataset of RCTs that compared higher versus lower omega‐6 fats, omega‐3 fats or total PUFA in adults with a duration of at least six months. We used this dataset as the wider study pool from which to select studies for all reviews (Abdelhamid 2018a; Abdelhamid 2018b; Abdelhamid 2017; Al‐Khudairy 2015; Brown 2017; Hanson 2017a; Hanson 2017b; Jimoh 2017; Thorpe 2017).
We searched two clinical trials registers, ClinicalTrials.gov (www.ClinicalTrials.gov) and the WHO International Clinical Trials Registry Platform (ICTRP, www.who.int/ictrp/en), in September 2016 for registry entries of relevant completed and ongoing studies.
Searching other resources
We checked included trials of relevant systematic reviews and wrote to authors of included studies for additional studies and trial data (including unpublished outcome data).
We attempted to obtain full‐text translations and/or evaluations of all relevant non‐English articles. Where these were not available we translated papers ourselves using our existing language skills and language translation software.
Data collection and analysis
Selection of studies
All authors carried out screening, with each record being independently screened by two review authors. We initially screened titles and abstracts of all the potential studies identified as a result of the searches and coded them as 'retrieve' (eligible or potentially eligible/unclear) or 'do not retrieve'. We retrieved the full text of all records that either reviewer had coded for retrieval. Two review authors (LH and one other reviewer) independently screened the full texts, assessed studies for inclusion, and identified and recorded reasons for exclusion of ineligible studies. We resolved any disagreement through discussion or consulted a third reviewer (AA). Where a study fit all our inclusion criteria except the reporting of any relevant outcomes, we wrote to the study author to ask whether they had measured but not reported any outcomes relevant to our review. Where we learnt that no primary or secondary outcome events had occurred (for example no deaths or CVD events occurred and no continuous outcomes measured), we included the study, but it did not contribute data to the meta‐analyses.
We identified and excluded duplicates and collated multiple reports of the same study (as each study – rather than each report – was the unit of interest in the review). We recorded the selection process in sufficient detail to complete a PRISMA flow diagram and Characteristics of excluded studies table.
Data extraction and management
We developed a draft data collection form for collating study characteristics and outcome data, then all reviewers piloted the form on a single included study to standardise data extraction and improve the data extraction form. All authors took part in data extraction. Two review authors each extracted the following study characteristics from included studies, independently and in duplicate.
Bibliographic details.
Trial registration database and number.
Methods: study design, total duration of study, details of any 'run‐in' period, number of study centres and location, study setting, withdrawals and date of study.
Participants: number randomised in each arm, number analysed in each arm, mean age, age range, sex, health status, baseline CVD risk and a brief description of participants. We categorised baseline CVD risk as low (no specific CVD risk factors in the inclusion criteria), moderate (people recruited on the basis of hyperlipidaemia, diabetes, metabolic syndrome, familial risk, high blood pressure, obesity or a high CVD risk score) or high (those with existing CVD such as angina or a previous stroke or myocardial infarction).
Interventions: intervention (including composition and dose of omega‐6 intake advised or supplement used), comparison, concomitant medications and excluded medications.
Outcomes: primary and secondary outcomes specified in trial registry, data on outcomes reported in publications and by contact with authors, time points reported.
Process data: mean and standard deviation (SD) of total PUFA, omega‐3 fat, omega‐6 fat, total fat, saturated fat (SFA), monounsaturated fat (MUFA) and trans fat intake plus erythrocyte, serum or adipose tissue fatty acid status data in intervention and control groups at latest point available during RCT.
Trial funding and notable conflicts of interest of trial authors.
We resolved disagreements between data extractions by consensus and/or by involving a third reviewer (LH or AA). One review author (AA or LH) transferred data into the Review Manager 5 file (RevMan 2014). We double‐checked that data were entered correctly from the agreed data extraction by comparing the data presented in the systematic review with data extraction (AA, JB, TB or LH).
Assessment of risk of bias in included studies
Two review authors independently assessed risk of bias for each study, alongside data extraction, using the criteria outlined in the Cochrane Handbook for Systematic Reviews of Interventions (Higgins 2011, all review authors carried out data extraction and assessment of risk of bias). We resolved disagreements by discussion or by involving another author (LH or AA). We assessed the risk of bias according to the following domains.
Random sequence generation (selection bias).
Allocation concealment (selection bias).
Blinding of participants and personnel (performance bias).
Blinding of outcome assessment (detection bias).
Incomplete outcome data (attrition bias).
Selective outcome reporting (reporting bias).
Attention bias (another aspect of performance bias, where the intervention or control groups receive more time and/or attention from study or health personnel during the trial).
Compliance bias (we considered studies to be at low risk of compliance bias when they assessed and clearly reported compliance for both intervention and control arms, and where most participants appeared to have taken at least 64% of the intended PUFA dose).
Other risk of bias.
These are the domains of the Cochrane Risk of Bias tool, with the exceptions of attention and compliance bias, which were specific to our review. We followed recommendations in Higgins 2011, recording funding data in the Characteristics of included studies but not using them as a separate issue for assessing risk of bias.
We graded each potential source of bias as conferring high, low or unclear risk of bias and provided details from the study and/or a quotation from the study report together with a justification for our judgment in the 'Risk of bias' tables. We summarised the risk of bias judgements across different studies for each of the domains listed. Where information on risk of bias related to unpublished data or correspondence with a trialist, we noted this in the 'Risk of bias' tables. Table 3 presents further details of how we interpreted the risk of bias elements across studies.
1. Risk of bias assessment ‐ detailed assessment methods.
| Risk of bias element | Criteria for low risk of bias | Criteria for unclear | Criteria for high risk of bias |
| Selection bias: random sequence generation | The study authors needed to have described the method used to generate the allocation sequence in sufficient detail to allow an assessment of whether it should produce comparable groups. For example "the randomisation sequence was computer generated". We allowed that a good method of randomisation was strongly implied if the authors discussed stratification and/or blocking. Therefore, if the authors were not explicit about their randomisation method but did describe stratification or blocking we assessed this as low risk. | The study authors have not described their method in sufficient detail for the assessment of whether it would produce comparable groups. For example, the authors state "the trial was randomised" and provide no further information. | The randomisation method was assessed as not truly random and may not produce comparable groups. |
| Selection bias: allocation concealment | The study authors needed to have described the method used to conceal allocation sequence in sufficient detail to determine whether the allocations could have been foreseen in advance of, or during, enrolment. Good methods included putting allocation codes in opaque sealed envelopes (ideally prepared by someone outside the treatment or assessment teams and sequentially numbered), using a telephone allocation system after the participants had consented to participate or providing a random number that links to a specific set of capsules prepared and distributed centrally or by an arms‐length pharmacist. | The authors gave insufficient detail as to method. | The allocation was known in advance of participants consenting to take part in the study. |
| Performance bias: blinding of participants and personnel | The study authors needed to have described all measures used, if any, to blind study participants and personnel from knowledge of which intervention a participant received. Ideally, they should also have provided information relating to whether the intended blinding was effective. For example, the authors could say "both the intervention and placebo capsules looked and tasted the same." However, if the study authors did not provide information on whether the blinding was effective, but sufficient detail was given on a good method of blinding, then it was assumed that the blinding was effective and the risk of bias was low. | Insufficient methodological details were provided e.g. "the study was blinded." | The study was unblinded or where blinding was broken, e.g. "the capsules were visually identical but the participants reported a strong fishy flavour in the intervention group only." |
| Detection bias: blinding of outcome assessment | Study authors needed to have described measures used, if any, to blind outcome assessors from knowledge of which intervention a participant received. Ideally, they should also have provided information relating to whether the intended blinding was effective. For example, the authors could say "the outcome assessors had no knowledge of the group allocation, and both the intervention and placebo capsules looked and tasted the same so the self‐assessment scales were also blinded." However, if the study authors did not provide information on whether the blinding was effective, but sufficient detail was given on a good method of blinding of the assessors, then we assumed that the blinding was effective and the risk of bias is low. All biochemical assessment (lipids, glucose, CRP, insulin, PSA etc.) were considered at low risk of detection bias if outcome assessor blinding or double‐blinding was stated. | Insufficient methodological details were provided e.g. "the study was blinded." | The study was unblinded or blinding was broken, e.g. for a self‐assessment measure "the capsules were visually identical but the participants reported a strong fishy flavour in the intervention group only." Because the level of blinding could vary by outcome, assessment of risk of bias was based on blinding of the review's primary outcome(s). Where primary outcomes had different assessments, we opted for the higher risk of bias but noted that that risk of bias was lower for other outcomes. |
| Attrition bias: incomplete outcome data | The study authors needed to describe the completeness of outcome data for each main outcome, including attrition and exclusions from the analysis. They needed to report the number of attrition/exclusions, the numbers in each group at each time point, reasons for attrition/exclusion and any re‐inclusions in analyses. Ideally, they would report how they imputed any missing data e.g. last observation carried forward. There needed to be a reasonable balance of attrition/exclusions between study arms and ≤ 20% of the sample should be lost over a year. | The authors didn't state reasons for attrition/exclusion or were unclear about the numbers lost to attrition/exclusion in each study arm. | The authors demonstrated a substantial difference in the rates of attrition/exclusions between the study arms and/or > 20% of the baseline sample was lost over a year (> 10% over 6 months). |
| Reporting bias: selective outcome reporting | The study authors needed to have published their trial protocol or trials registry entry before the end of the study's recruitment period i.e. prospectively. They needed to have reported on all of the primary and secondary outcomes listed in the protocol/registry entry. Reporting additional secondary outcomes in the results paper(s), although not ideal, was deemed to still be low risk. | No trial protocol or trials registry entry was found, it was registered retrospectively, or the dates of registration and participant recruitment were unclear. | The study authors did not report at least one primary or secondary outcome listed in the protocol/registry entry OR the results paper(s) reported a primary outcome that was not listed at all in the protocol or not listed as a primary outcome in the protocol. |
| Other sources of bias: attention bias | The study authors needed to have reported that participants in all study arms received the same amount of attention and time from researchers and clinical teams. For example, "All participants attended the clinic for a baseline assessment which took 2 hours. They were then followed with monthly telephone calls, and finally attended for a 6 month assessment at the clinic which took 1 hour." If the study only differed by the content of the capsules, and the assessment schedule was not stated to differ between the two arms, it was assumed to be at low risk. | The authors did not state the attention each arm received. | Participants in different arms received different amounts of attention. For example "The intervention group only attended for additional assessments at months 2, 4, and 6" or "the rates of relapse differed substantially between the groups which led to differing amounts of treatment time and attention," or "the intervention group received a 40 minute dietary education session." |
| Other sources of bias: limited compliance | The study authors needed to have reported on the level of compliance in all arms in sufficient detail to determine whether the study results were robust. We followed a flow chart to make this determination. A statistically significant difference between the intervention and control groups in a body measure of at least 50% of the text fatty acids. Where no body measures were reported, then estimated compliance needed to be greater than 64% (proportion complying multiplied by compliance threshold). | Compliance not reported or not in a way that could be interpreted | Measures of compliance were reported but fell below the appropriate thresholds. |
| Other sources of bias: other | In the absence of any additional issues this item was coded "low risk of bias" | — | If fraud concerns had been raised and the paper had been withdrawn, or the author had been found guilty of fraud by a legal or medical entity the paper was excluded from the review. However if fraud concerns were raised, but the journal had not withdrawn the paper, and the author had not been formally sanctioned; then the study was included in the review, but concerns were raised here, and the risk of bias for this item was high. |
Summary risk of bias
Schultz 1995 found that poorly concealed allocation was associated with a 40% greater effect size, so randomisation and allocation concealment are core issues for all trials. Lack of blinding is associated with bias, though smaller levels of bias than lack of allocation concealment (Savovic 2012), especially in studies with objectively measured outcomes (Wood 2008). Most of our outcomes were objectively measured. Although we originally planned to assess summary risk of bias for all included trials in the same way across this review (Al‐Khudairy 2015), the omega‐3 review (Abdelhamid 2018a), and the total PUFA review (Abdelhamid 2018b), we adopted a different approach after discussing the different nature of supplement trials compared to dietary advice or food provision trials with the NUGAG Subgroup on Diet and Health. Discussion centred on blinding for supplement‐type trials and on compliance for dietary advice type trials.
We considered supplement or capsule type trials to be at low summary risk of bias where we judged randomisation, allocation concealment, blinding of participants and personnel and blinding of outcome assessors (selection, performance and detection bias) to be adequate. All other trials were considered at moderate or high risk of bias (a single category).
We considered dietary advice or all‐food‐provided type trials to be at low summary risk of bias where we judged randomisation, allocation concealment, and blinding of outcome assessors (selection and detection bias) to be adequate. We considered all other trials to be at moderate or high risk of bias (a single category).
Assessment of bias in conducting the systematic review
We conducted this Cochrane Review according to the methods used in Al‐Khudairy 2015 and reported deviations from it in the Differences between protocol and review section.
Measures of treatment effect
We analysed dichotomous data as risk ratios (RRs) with 95% confidence intervals (CIs) and continuous data as mean difference (MD) with 95% CIs. We presented continuous data with a consistent direction of effect (as a smaller reading is generally beneficial), with the exception of HDL cholesterol, where an increase was beneficial.
We used change data (change from baseline to latest point in study in each arm) for continuous data where available with appropriate variance data. When change data were not available and baseline data were comparable between arms, we used absolute data from the latest point in each study arm. We considered absolute data too different to use when the change in both arms (from baseline to end data) was smaller than the baseline difference between arms. Where continuous data were too different to use, we noted this in the 'Outcomes' section of Characteristics of included studies but did not add data to meta‐analyses.
We intended a narrative description of skewed data reported as medians and interquartile ranges or as medians without variance data. We added these data to forest plots to enable visual comparison of findings (though we did not include these data in meta‐analysis). We intended to use standardised mean differences (SMD) to combine data where trials used different scales to measure the same variable (such as quality of life). We found no such data so did not use SMDs.
Unit of analysis issues
Studies with multiple intervention groups
Within this review, most included studies with more than two intervention arms also had separate control arms relevant to each of the intervention arms, so we used the relevant control arm for each of the intervention arms. We never had to use the same control group twice. For the exceptions (NDHS Faribault 1968; NDHS Open 1st 1968), we combined the intervention arms and compared them with the single control arm. This meant there were no problems with study participants appearing more than once in any forest plot.
Cluster‐RCTs
For cluster‐randomised trials, we planned to account for unit of analysis issues by extracting a direct estimate of the required effect measure (for example, a risk ratio with its confidence interval) from an analysis that accounted for the cluster design properly (for example, an analysis based on a 'multilevel model', a 'variance components analysis' or that used 'generalised estimating equations (GEEs)'). Where these data were available, we would have used them in meta‐analysis using the generic inverse‐variance method (Higgins 2011). Where no such correct analysis of the cluster‐randomised data were available, we planned to use approximate analyses using intracluster correlation coefficient (ICC) analysis as outlined in the Cochrane Handbook for Systematic Reviews of Interventions (Higgins 2011, section 16.3.4). We identified no such cluster randomised trials, so did not need this methodology.
Dealing with missing data
We contacted (or attempted to contact) the authors of all potentially included, included and ongoing RCTs to request available data on all of the study outcomes relevant to our set of reviews and key information on risk of bias. We sent an email and a posted letter to the corresponding author at the latest address we were able to obtain (tracking latest publications in MEDLINE). Where data on at least one review outcome were available, we included the RCT and asked the authors to provide any additional data about study methodology or risk of bias.
Where papers reported continuous results as change from baseline, we used these data, otherwise we used data at the latest point available. We did not impute change data.
Assessment of heterogeneity
We used the I2 statistic to measure heterogeneity among the trials in each analysis. Where we identified substantial heterogeneity (assumed when I2 was greater than 60%, as 30% to 60% represents moderate heterogeneity and we were allowing for the varied dietary interventions included as well as potential dose‐response effects) we reported it and explored possible causes by prespecified subgroup analysis.
Assessment of reporting biases
We assessed reporting biases using a funnel plot where we were able to pool at least 10 trials. We ran a funnel plot for all‐cause mortality and serum total cholesterol because these analyses included 10 trials. We did not create funnel plots for other outcomes, as fewer than 10 trials were available for meta‐analyses. We noted where we were aware of missing data. This occurred where trialists noted measuring but not reporting an outcome (or not reporting it by study arm), where continuous data were unbalanced at baseline, or where trialists presented data as medians or as means but without variance information.
Data synthesis
We undertook meta‐analyses only where we considered this meaningful, i.e. where the treatments, participants and the underlying clinical question were similar enough for pooling to make sense. We carried out statistical analysis using RevMan 2014. We used a random‐effects model, as dietary interventions are complex and somewhat heterogeneous by nature (more so than most medical treatments), but we compared the results of random‐effects and fixed‐effect meta‐analyses in sensitivity analyses. As the random‐effects model assigns more weight to smaller studies, it is more conservative and may lead to imprecise estimates of effect. We also carried out sensitivity analyses to assess the effects of methodological rigour, removing studies at moderate to high summary risk of bias (for other sensitivity analyses see below).
When we judged evidence from dichotomous outcomes to be low, moderate or high GRADE quality, we calculated the number needed to treat for an additional beneficial outcome (NNTB) and its 95% confidence interval using standard equations (Evidence Based Medicine Toolkit 2008).
Subgroup analysis and investigation of heterogeneity
We explored the effects of omega‐6 fat intake on all primary review outcomes and also key review outcomes where these were secondary outcomes in our review and included at least six studies by subgroup. The planned subgroup analyses were by:
omega‐6 fat type (primarily LA vs GLA);
intervention type (dietary advice, supplements (capsules), supplemental foods or all foods provided);
replacement of SFA, MUFA, carbohydrate, protein or alcohol with omega‐6 fat;
baseline risk of CVD (low or moderate risk, equivalent to primary prevention, or secondary prevention);
omega‐6 fat dose (and dose‐response, < 4% E from omega‐6 fats, 4% to 12% E from omega‐6 fats and > 12% E from omega‐6 fats in the intervention compared with control). We added the > 12% E subgroup post hoc to provide some separation between studies with a wide range of higher doses. The original 4% E cut‐off was suggested when the PICO question for the review was set out as part of a 2016 WHO NUGAG Subgroup on Diet and Health meeting;
trial duration: studies with medium follow‐up (12 to 23 months), medium to long follow‐up (24 to 47 months), and long follow‐up (48 months or more). There was some discussion within WHO NUGAG Subgroup on Diet and Health about whether to limit trials to those of at least two years' duration, but as some proposed omega‐6 fat mechanisms may affect cardiovascular health more quickly (anti‐thrombotic and anti‐inflammatory mechanisms for example), we agreed to include trials of at least 12 months, subgrouping to assess for duration effects;
statin use (at least 50% of control group on statins versus fewer than 50% on statins);
baseline omega‐6 fat intake (we used omega‐6 fat intake where available, but otherwise used baseline PUFA intake, usually mostly LA, where this was available): < 5% E from omega‐6 fats, 5% to < 8% E from omega‐6 fats, ≥ 8% E from omega‐6 fats, with cut‐offs based on recommendations that populations should consume 5% to 8% of dietary energy from omega‐6 fats (WHO 2003); and
participants' sex.
We also planned to subgroup by change in the omega‐3/omega‐6 fat ratio (assessing whether the intervention primarily increased omega‐3 fats (putting up the ratio) or omega‐6 fats (lowering the ratio)). However, we rarely had enough information to calculate this ratio so did not carry out the subgroup analysis.
WHO NUGAG Subgroup on Diet and Health requested these analyses to better help them understand the data. The danger of having so many subgroup analyses is over‐interpretation, increasing the risk of a type 1 error. We used the formal test for subgroup interactions in RevMan 2014 to minimise this risk.
Meta‐regression
We used meta‐regression to further explore effects of omega‐6 fat dose (looking for evidence of dose response), baseline omega‐6 fat dose and duration on primary outcomes. We used the dataset of all included trials (of at least 12 months' duration) that reported each outcome from this review and its sister reviews (omega‐6 fat trials from this review, omega‐3 fat trials from Abdelhamid 2018a, and total PUFA trials from Abdelhamid 2018b) to assess effects of omega‐6 fat dose. We also used the set of trials within this review alone to assess relationships between omega‐6 fat dose, baseline omega‐6 dose and duration with each of the dichotomous primary outcomes with at least seven included trials.
We carried out random‐effects meta‐regression, as described in Berkley 1995, using the STATA command metareg (Sharp 1998): log(e) relative risk vs (dose or primary/secondary prevention or type of intervention or risk of bias or duration), weighted by the standard error of the log(e) relative risk. Where there were no events in one arm we added 0.1 to the numbers for both groups (so we would have entered a trial with 10 people experiencing stroke in one arm but none in the other arm as 10.1 and 0.1).
Sensitivity analysis
We carried out the following sensitivity analyses on all primary outcomes (regardless of the number of included trials) as well as on secondary outcomes that were key outcomes and where at least six trials provided data. These were our main sensitivity analyses.
Using fixed‐effect meta‐analysis.
Limiting analyses to studies at low summary risk of bias.
These were additional sensitivity analyses.
Only including all studies up to 2010, plus studies post‐2010 that were registered on a trials register (Roberts 2015).
Only including studies with no industry funding (where funding was stated, but did not include any commercial funds or gifts).
Only including studies with less than 10% difference in intake of trans fats between study arms during the intervention (trans fats are formed when solidifying polyunsaturated oils so may have been given at increased doses in early diets high in omega‐6 fats where those fats were solidified to use in margarines and baking – however, we now know that they are likely to increase our risk of CVD so may confound any beneficial effects of increasing omega‐6 fats).
Only including studies with a low risk of attention bias.
Only including studies that randomised at least 250 participants, or at least 100 participants.
Unfortunately almost no data on trans fats were available, so we did not perform sensitivity analyses around this variable.
'Summary of findings' tables
Outcome data were interpreted as follows:
Is there an effect? (options were ‘increased risk’, ‘decreased risk’, or ‘little or no effect’). Our main outcome measure was RR so we decided on existence of an effect using RR. RR <8% (RR <0.92 or >1.08) for the highest quality evidence suggested increased or decreased risk (otherwise little or no effect). The presence or not of an effect was decided on the RR for the main analysis and sensitivity analyses.
For continuous outcomes increasing PUFA was considered to have little or no effect unless effect sizes represented at least 5% change from baseline (or 2% in the case of cumulative outcomes such as adiposity).
Quality of evidence was assessed using GRADE assessment for key outcomes. We used the five GRADE considerations (study limitations, consistency of effect, imprecision, indirectness and publication bias) to assess the quality of the body of evidence as it related to the studies that contributed data to the meta‐analyses for the prespecified outcomes. We used methods and recommendations described in Section 8.5 and Chapter 12 of the Cochrane Handbook for Systematic Reviews of Interventions (Higgins 2011), plus GRADEpro GDT software (GRADEpro GDT 2015). We justified all decisions to downgrade the quality of studies using footnotes and made comments to aid reader's understanding of the review.
Where there was a suggested effect the size of effect was assessed using the NNT or ARR.
We created a 'Summary of findings' table for the primary outcomes.
All‐cause mortality
CVD mortality
CVD events
Coronary heart disease events
Major adverse cardiac and cerebrovascular events
Stroke
To enable readers to easily access data on the key outcomes that were secondary outcomes in this review, and which were also formally systematically reviewed, we created a second 'Summary of findings' table for key secondary outcomes.
Myocardial infarction
Total serum cholesterol
Serum triglycerides
Low‐density lipoprotein
High‐density lipoprotein
Body weight
Body mass index
Results
Description of studies
Results of the search
The electronic searches for the full set of reviews (populating the dataset of all trials that assessed effects of higher versus lower omega‐6 fats, omega‐3 fats or PUFA over at least six months) generated 37,810 titles and abstracts, or 19,772 unique records after de‐duplication. We assessed these along with 53 previously included studies (from Al‐Khudairy 2015 and Abdelhamid 2018a, to reassess for inclusion), 986 potentially relevant trials registry entries and 35 new references gained from other systematic review reference lists, so that we assessed a total of 20,846 titles and abstracts in duplicate to decide on potential inclusion. We retrieved 2155 full texts, including 226 systematic reviews and 1929 papers whose full text we assessed in duplicate for inclusion and to group into studies. Of these, we included 364 RCTs of omega‐3 fats, omega‐6 fats or total PUFA interventions with a duration of at least 24 weeks, regardless of what outcomes were reported in our wider study pool. This was the database of trials we used for the full set of reviews. Of this dataset, 28 studies assessed the effects of omega‐6 fats, and of these, 19 were of at least 12 months' duration, had collected relevant outcome data and are included in this review.
We identified a single ongoing trial, which we describe in Characteristics of ongoing studies. Figure 1 presents details of the flow of studies.
1.
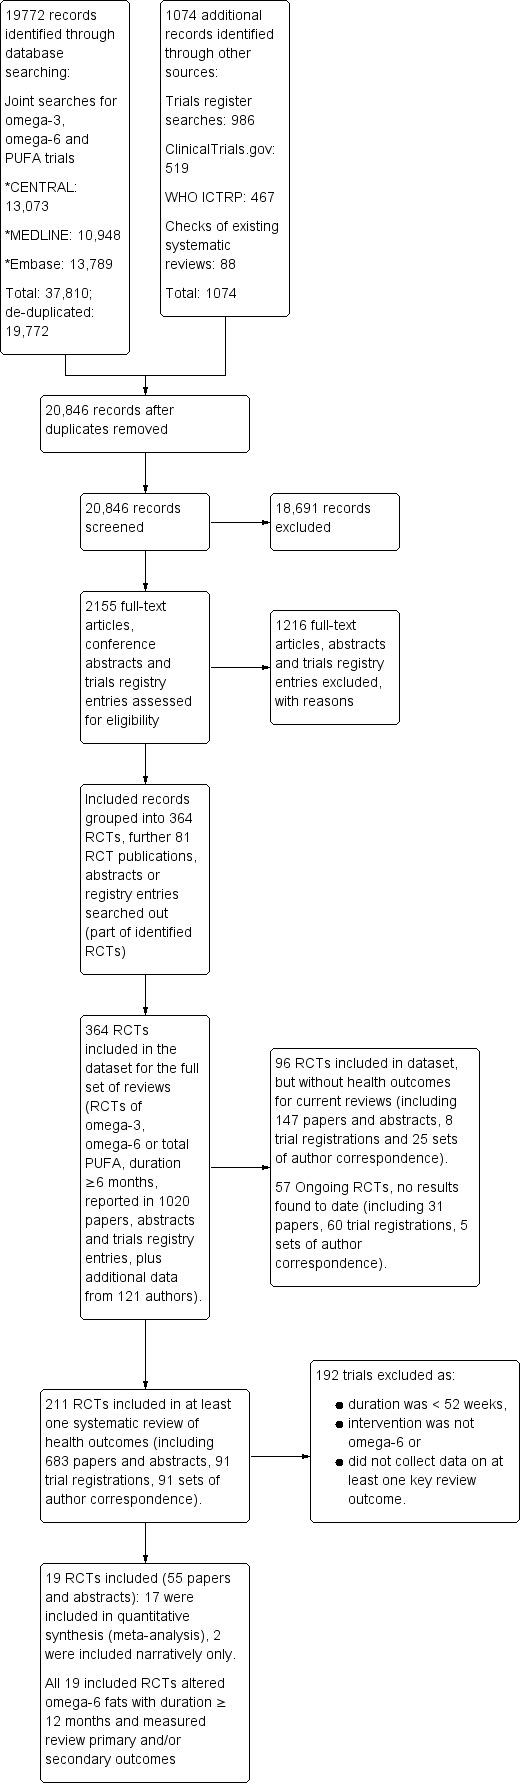
Study flow diagram.
Included studies
Details of methods, participants, intervention, comparison, and outcome measures for each included trial are shown in Characteristics of included studies. We found that 19 trials including 6461 randomised participants met the inclusion criteria. Trial duration varied from one year (our minimum for inclusion) up to eight years (Veterans Admin 1969), with a median of 24 months and mean duration of over 31 months (for the 17 trials that provided data for the review). However, the mean duration of participants experiencing the intervention was slightly shorter (as participants dropped out over time).
Participants in 17 of the 19 included trials had experienced at least one outcome event or had a relevant continuous outcome measured. We included two other trials in the review as we are fairly certain that no deaths or CVD events occurred in participants, and none of our continuous outcomes were assessed (Belch 1988; Mansel 1990). One trial provided data on two useful comparisons (Bates 1977); however, although mortality appears to have occurred in several arms, the numbers of deaths are no longer available to the authors (for this reason we included both arms but they constitute missing data that could not be used in the all‐cause mortality meta‐analysis). Another trial ran two comparisons (Bates 1978), but no deaths or other events occurred in one comparison (so the relevant intervention and control arms are included but not represented in the analyses); only the other comparison is included in meta‐analyses. The 2 × 2 × 2 factorial trial only provided one comparison relevant to this review (DART 1989), and we combined several smaller arms into a single comparison for NDHS Faribault 1968 and NDHS Open 1st 1968. All in all, we included 19 trials, 17 of which contributed data to 18 comparisons. No cluster‐RCTs met the inclusion criteria.
Ten trials recruited both men and women, but DART 1989, MRC 1968, NDHS Faribault 1968,NDHS Open 1st 1968,Sydney Diet‐Heart 1978 and Veterans Admin 1969 recruited only men, one trial recruited 94% women (Belch 1988), and one trial only women (Mansel 1990). One trial did not specify the sex of its participants (Rose 1965). Participants were generally of early to late middle age, but some studies included a few older adults (aged 65 years or more). Mean age of study participants ranged from 33 years in Bates 1978 to 65 years in Veterans Admin 1969, with a median mean age of 50 years in the 13 trials that reported mean age (estimated as 50 years in NDHS Faribault 1968 and NDHS Open 1st 1968, which included participants aged 45 to 54 years). Bates 1977 and Houtsmuller 1979 did not report age details, while Mendis 2001 recruited participants aged 22 to 55 years; Mansel 1990, women aged 36 to 60 years; and MRC 1968, participants aged less than 60 years.
The trials varied in the types of participants recruited and their level of CVD risk. Participants in 10 trials were at low risk of CVD. Bates 1977 and Bates 1978 recruited people with multiple sclerosis; NDHS Faribault 1968, men living in mental hospitals; Veterans Admin 1969, men living in a Veterans Administration Centre; Schirmer 2007, healthy adults following weight loss; Mendis 2001, healthy adults; McIllmurray 1987, people following treatment for colorectal cancer; Black 1994, people with non‐melanoma skin cancer; Mansel 1990, women with breast cysts; Belch 1988, people with rheumatoid arthritis; and NDHS Open 1st 1968, free‐living men without particular CVD risk or other disease. Three trials included people at moderate CVD risk (GLAMT 1993 recruited people with mild diabetic neuropathy; Dullart 1992, people with diabetes; and Houtsmuller 1979, people with newly diagnosed diabetes), while five trials included those with existing CVD (DART 1989, MRC 1968 and Sydney Diet‐Heart 1978 recruited men following myocardial infarction; Vijayakumar 2014, people with stable coronary artery disease; and Rose 1965, people with ischaemic heart disease).
Five trials took place in North America (Black 1994; NDHS Faribault 1968; NDHS Open 1st 1968; Schirmer 2007; Veterans Admin 1969), 1 in Australia (Sydney Diet‐Heart 1978), 2 in Asia (Mendis 2001; Vijayakumar 2014), and 11 in Europe (Bates 1977; Bates 1978; Belch 1988, DART 1989; Dullart 1992; GLAMT 1993; Houtsmuller 1979; Mansel 1990; McIllmurray 1987; MRC 1968; Rose 1965).
The interventions and controls varied. Seven trials assessed effects of GLA: providing supplementary capsules, of GLA plus LA vs oleic acid (both comparisons of Bates 1977 and the single included comparison of Bates 1978), GLA versus monounsaturated fats (Schirmer 2007), GLA capsules versus paraffin (Belch 1988; GLAMT 1993; Mansel 1990), or GLA versus an 'inert placebo' that was not described further (McIllmurray 1987). Twelve trials altered LA intake, most increasing LA in the intervention arm, but Black 1994 aimed to reduce total fat intake in the intervention arm, reducing LA intake in the process (this trial was entered in meta‐analysis with the control arm as the higher omega‐6 fat arm). In some trials the LA mainly replaced a single dietary component, but in others LA replaced several components (the description below is not additive). No studies assessed effects of DGLA or AA. The omega‐6 fat dose delivered was the difference between omega‐6 fats in the intervention and the control. Doses ranged from 0.8% of energy intake (% E) from omega‐6 fats in Schirmer 2007 to 20.6% E in Rose 1965. Eight trials provided a dose of less than 4% E from omega‐6 fats (Bates 1977; Bates 1978; Belch 1988; Black 1994; DART 1989; McIllmurray 1987; Mendis 2001; Schirmer 2007); six trials, 4% to 12% E (Dullart 1992; GLAMT 1993; Houtsmuller 1979; NDHS Open 1st 1968; Sydney Diet‐Heart 1978; Veterans Admin 1969); and four trials, a dose of over 12% E omega‐6 fats (MRC 1968; NDHS Faribault 1968; Rose 1965; Vijayakumar 2014). Baseline omega‐6 fat intake was less than 5% E in three trials (NDHS Faribault 1968; NDHS Open 1st 1968; Veterans Admin 1969), 5% to < 8% E in three trials (DART 1989; Dullart 1992; Sydney Diet‐Heart 1978), and at least 8% E in one trial (Black 1994). The remaining 12 trials did not report baseline intake.
As the omega‐6 fat LA rose, saturated fat intake fell in nine trials (DART 1989; Dullart 1992; Houtsmuller 1979; MRC 1968; NDHS Faribault 1968; NDHS Open 1st 1968; Sydney Diet‐Heart 1978; Veterans Admin 1969; Vijayakumar 2014), MUFA fell in five (NDHS Faribault 1968; NDHS Open 1st 1968; Rose 1965; Sydney Diet‐Heart 1978; Veterans Admin 1969), both carbohydrates and protein intake fell in one (Black 1994), and carbohydrates fell in one other (Houtsmuller 1979). For Mansel 1990, Mendis 2001 and Belch 1988 the replacement for omega‐6 LA was unclear, and in MRC 1968, while LA partially replaced SFA the remainder of the replacement was unclear. Readers should keep in mind that we have assessed these effects from either the trial's intentions or reported intakes in both arms, but papers frequently omit the mention of important dietary components; replacement can be considered our best understanding, but it is not definitive.
Included trials were published over 50 years between 1965 and 2014, with five published during the 1960s, four during the 1970s, three during the 1980s, four during the 1990s, two during the 2000s and one in 2014.
Mansel 1990 and Rose 1965 did not report funding sources. Funding appeared to be purely from national or charitable agencies in eight trials (Black 1994; Dullart 1992; Houtsmuller 1979; Mendis 2001; MRC 1968; NDHS Faribault 1968; NDHS Open 1st 1968; Sydney Diet‐Heart 1978). A further six trials had funding from mixed national or charitable sources, with some products or funding appearing to come from commercial sources (Bates 1977; Bates 1978; Belch 1988; DART 1989; Veterans Admin 1969; Vijayakumar 2014). Three trials acknowledged only commercial funding sources or sources of intervention products (GLAMT 1993; McIllmurray 1987; Schirmer 2007).
The single ongoing trial we identified was in people with pre‐diabetes, comparing a low fat diet with raised PUFA to SFA ratio versus a control diet over three years (Chandrakala 2010). The authors have presented this study in several conference abstracts, without usable outcome data. They confirmed that it is not yet fully published and declined to provide further information (Characteristics of ongoing studies).
Excluded studies
We have presented details and reasons for exclusion of the studies that most closely missed the inclusion criteria in the Characteristics of excluded studies table. Appendix 3 lists studies of less than 12 months' duration (as there were so many). Other than short duration, the most common reasons for exclusion of studies were a non‐RCT design or an inappropriate intervention or comparison.
Risk of bias in included studies
We have provided details regarding the risk of bias judgements for the included trials in the 'Risk of bias' tables in Characteristics of included studies, with details of how we made specific judgements in Table 3. We have presented a 'Risk of bias' summary in Figure 2.
2.
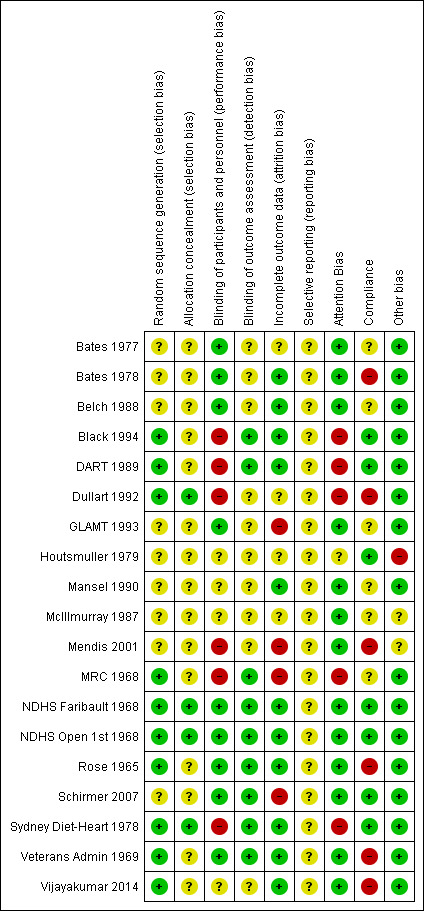
'Risk of bias' summary: review authors' judgements about each 'Risk of bias' item for each included study.
We judged three studies to be at low summary risk of bias (NDHS Faribault 1968; NDHS Open 1st 1968; Sydney Diet‐Heart 1978). All three were dietary advice trials, so they were at low risk of bias from random sequence generation, allocation concealment and blinding of outcome assessors. We considered the remaining 16 trials to be at moderate to high risk of bias.
Allocation
We judged 10 of the 19 studies to be at low risk of bias for random sequence generation, while the remainder were at unclear risk (often simply described as "randomised" in the Methodology sections). We considered only four trials to be at low risk of bias for allocation concealment (Dullart 1992; NDHS Faribault 1968; NDHS Open 1st 1968; Sydney Diet‐Heart 1978), with the rest providing too few details of the randomisation process to make a judgement. This was despite trying to elicit information on the process of randomisation from authors. When asking open questions about the randomisation process, many authors quoted or referred to their published papers or stated that they did not remember. We did not push further with these questions, as asking closed questions was likely to elicit inappropriate answers.
Blinding
Blinding of participants and personnel is often very difficult in dietary trials, but we considered 9 of the 19 studies to be at low risk of performance bias. This included five capsule‐supplemented trials (Bates 1977; Bates 1978; Belch 1988; GLAMT 1993; Schirmer 2007), three institutional or shop‐based studies where participants received all or most food (NDHS Faribault 1968; NDHS Open 1st 1968; Veterans Admin 1969), and one study providing oils to both intervention and control groups (Rose 1965). Lack of blinding of participants and/or personnel put six trials at high risk of bias (Black 1994; DART 1989; Dullart 1992; Mendis 2001; MRC 1968; Sydney Diet‐Heart 1978), while the remaining studies were at unclear risk. We considered nine studies to be at low risk of detection bias for blinding of outcome assessors (Black 1994; DART 1989; MRC 1968; NDHS Faribault 1968; NDHS Open 1st 1968; Rose 1965; Schirmer 2007; Sydney Diet‐Heart 1978; Veterans Admin 1969), while this domain was unclear in the remainder.
Incomplete outcome data
We judged 11 trials to be at low risk of attrition bias (Bates 1978; Black 1994; Belch 1988; DART 1989; Mansel 1990; NDHS Faribault 1968; NDHS Open 1st 1968; Rose 1965; Sydney Diet‐Heart 1978; Veterans Admin 1969; Vijayakumar 2014), 4 at high risk (GLAMT 1993; Mendis 2001; MRC 1968; Schirmer 2007), and the remainder at unclear risk.
Selective reporting
We did not find a pre‐published trials registry entry or protocol for any of the included studies (most were published many years before trials registries became available), so we found all to be at unclear risk of reporting bias.
Other potential sources of bias
We assessed risk of bias from differences in trialists' attention or time between arms (attention bias) and compliance problems, as well as noting any other sources of bias.
We noted high risk of attention bias for five dietary advice trials where the control participants were told to consume their normal diets (Black 1994; DART 1989; Dullart 1992; MRC 1968; Sydney Diet‐Heart 1978). The remaining 14 trials were judged at low risk of attention bias.
We judged compliance adequate (at low risk of causing bias) for seven trials (Black 1994; DART 1989; Houtsmuller 1979; NDHS Faribault 1968; NDHS Open 1st 1968; Schirmer 2007; Sydney Diet‐Heart 1978), poor in six where biomarkers suggested that dietary goals had not altered omega‐6 fats appreciably (Bates 1978; Dullart 1992; Mendis 2001; Rose 1965; Veterans Admin 1969; Vijayakumar 2014), and unclear in the remaining six.
We did not note sources of other bias in 16 trials (resulting in low risk of other bias), but McIllmurray 1987 did not specify the composition of their placebo capsules, and Mendis 2001 did not state the form or composition of the intervention or control fats, resulting in unclear risk of other bias. We found Houtsmuller 1979 to be at high risk of other bias as concerns about fraud of the first author were raised around his later research (on cancer diets), and numbers of events were unclear by arm and had to be assessed across several unclear publications. Additionally, this study was extremely vague across all publications about its methods.
Effects of interventions
Summary of findings for the main comparison. Higher versus lower omega‐6: primary outcomes.
| Higher versus lower omega‐6 for adults with or without CVD | ||||||
|
Patient or population: adults with or without existing CVD
Setting: includes free‐living participants and those living in institutions. Includes participants from North America, Australia, Asia and Europe but most events occurred in studies carried out in Europe or North America
Intervention: higher omega‐6
Comparison: lower omega‐6 Eligible trials compared higher with lower omega‐6 fat (including LA, GLA, DGLA, AA, or any combination) intakes. The intervention had to be dietary supplementation, or a provided diet, or advice on diet | ||||||
| Outcomes | Anticipated absolute effects* (95% CI) | Relative effect (95% CI) | № of participants (studies) | Certainty of the evidence (GRADE) | Comments | |
| Risk with lower omega‐6 | Risk with higher omega‐6 | |||||
| All‐cause mortality Study duration range 12‐96 months Omega‐6 dose range 1.5%‐24.5% E |
Study population | RR 1.00 (0.88 to 1.12) | 4506 (10 RCTs) | ⊕⊕⊝⊝ Lowa | Increasing omega‐6 fats may make little or no difference to risk of all‐cause mortality. Downgraded once each for risk of bias and imprecision. As there was no suggestion of benefit or harm the number needed to treat (NNTB) was infinite (NNTB ∞, 95% CI NNTH 50 to NNTB 50) | |
| 167 per 1000 | 167 per 1000 (147 to 187) | |||||
| Cardiovascular mortality Study duration range 24‐96 months Omega‐6 dose range 2.8%‐24.5% E |
Study population | RR 1.09 (0.76 to 1.55) | 4019 (7 RCTs) | ⊕⊝⊝⊝ Very lowb | We are uncertain whether increasing omega‐6 fats affects CVD mortality risk. Downgraded for risk of bias, imprecision and inconsistency | |
| 114 per 1000 | 125 per 1000 (87 to 177) | |||||
| Cardiovascular events: any Study duration range 12‐96 months Omega‐6 dose range 2.8%‐24.5% E |
Study population | RR 0.97 (0.81 to 1.15) | 4962 (7 RCTs) | ⊕⊕⊝⊝ Lowc | Increasing omega‐6 fats may make little or no difference to risk of cardiovascular events. Downgraded once each for risk of bias and imprecision. 100 people would need to increase the amount of omega‐6 fat in their diet to prevent 1 person having a CVD event (NNTB 100, 95% CI −21 to 17) | |
| 311 per 1000 | 301 per 1000 (252 to 357) | |||||
| CHD events: myocardial infarction (fatal or non‐fatal) or angina Study duration range 12‐96 months Omega‐6 dose range 2.8%‐24.5% E |
Study population | RR 0.88 (0.66 to 1.17) | 3997 (7 RCTs) | ⊕⊝⊝⊝ Very lowd | We are uncertain whether increasing omega‐6 fats affects CHD risk. Downgraded for risk of bias, imprecision and inconsistency | |
| 277 per 1,000 | 244 per 1000 (183 to 324) | |||||
| MACCEs Study duration range 24‐96 months Omega‐6 dose range 2.8%‐12.0% E |
Study population | RR 0.84 (0.59 to 1.20) | 2879 (2 RCTs) | ⊕⊝⊝⊝ Very lowe | We are uncertain whether increasing omega‐6 affects MACCE risk. Downgraded for risk of bias, inconsistency and imprecision | |
| 295 per 1000 | 248 per 1000 (174 to 354) | |||||
| Stroke: fatal or non‐fatal Study duration range 24‐96 months Omega‐6 dose range 2.8%‐21.9% E |
Study population | RR 1.36 (0.45 to 4.11) | 3730 (4 RCTs) | ⊕⊝⊝⊝ Very lowf | We are uncertain whether increasing omega‐6 fats affects stroke risk. Downgraded once for risk of bias, twice for imprecision | |
| 14 per 1000 | 20 per 1000 (7 to 59) | |||||
| *The risk in the intervention group (and its 95% confidence interval) is based on the assumed risk in the comparison group and the relative effect of the intervention (and its 95% CI). AA: arachidonic acid; CI: confidence interval; CHD: coronary heart disease; CVD: cardiovascular disease; DGLA: dihomo‐gamma‐linolenic acid; GLA: gamma‐linolenic acid; LA: linoleic acid; MACCE: major adverse cardiovascular or cerebrovascular event; NNTB: number needed to treat for an additional beneficial outcome; NNTH: number needed to treat for an additional harmful outcome; RCT: randomised controlled trial; RR: risk ratio; % E: percentage of energy intake from this nutrient. | ||||||
| GRADE Working Group grades of evidence High certainty: we are very confident that the true effect lies close to that of the estimate of the effect. Moderate certainty: we are moderately confident in the effect estimate: the true effect is likely to be close to the estimate of the effect, but there is a possibility that it is substantially different. Low certainty: our confidence in the effect estimate is limited: the true effect may be substantially different from the estimate of the effect. Very low certainty: we have very little confidence in the effect estimate: the true effect is likely to be substantially different from the estimate of effect. | ||||||
aAll‐cause mortality
- Risk of bias: two included trials were at low summary risk of bias, including 682 participants reporting 69 deaths. Limiting analyses to these trials suggested that increasing omega‐6 fats may increase mortality risk, as did limiting to studies with no commercial funding. Other sensitivity analyses suggested little or no effect. It was further noted by the WHO NUGAG Subgroup on Diet and Health that most studies did not report on allocation concealment or otherwise had unclear risk of bias for allocation concealment. Although low risk of bias in other elements of bias assessment (e.g. randomisation, blinding of outcome assessment) might suggest that the trials were well‐conducted and thus allocation concealment may have been maintained, many of the trials are older and detailed information on the conduct of the trials can be scarce. Therefore, a conservative approach was taken. Downgraded once.
- Inconsistency: there was little or no indication of heterogeneity between trials (I2 < 30%). Not downgraded.
- Indirectness: Most data related to high‐income countries, and trials of men, but included people with and without CVD at baseline. Not downgraded.
- Imprecision: the 95% CI crossed the null and did not exclude important benefits or harms. Downgraded once.
- Publication bias: no suggestion of publication or small study bias in the funnel plot. Not downgraded.
bCardiovascular mortality
- Risk of bias: one included study with 458 participants, 62 of whom died of CVD, was at low summary risk of bias. Limiting analyses to this trial suggested that increasing omega‐6 fats may increase risk of CVD death, as did limiting to studies without commercial funding, while trials at low risk of attention bias suggested benefit from increasing omega‐6 fats. WHO NUGAG Subgroup on Diet and Health notes: "Most studies did not report on allocation concealment or otherwise had unclear risk of bias for allocation concealment. Although low risk of bias in other elements of bias assessment (e.g. randomisation, blinding of outcome assessment) might suggest that the trials were well‐conducted and thus allocation concealment may have been maintained, many of the trials are older, and detailed information on the conduct of the trials can be scarce. Therefore, a conservative approach was taken. Downgraded once.
- Inconsistency: I2 > 60%. Downgraded for inconsistency.
- Indirectness: Most data related to high‐income countries, and trials of men, but included people with and without CVD at baseline. Not downgraded.
- Imprecision: the 95% CI crossed the null and did not exclude important benefits or harms. Downgraded once.
- Publication bias: fewer than 10 included studies so no funnel plot run. Not downgraded.
cCardiovascular events
- Risk of bias: two included trials in 1525 participants, 68 of whom experienced at least 1 CVD event, were at low summary risk of bias. This sensitivity analysis, limiting to trials of low summary risk of bias, suggested that increasing omega‐6 fats increased risk of experiencing CVD events, as did limiting to studies with no commercial funding, while limiting to studies at low risk of bias from attention differences suggested benefit from increasing omega‐6 fats. It was further noted by the WHO NUGAG Subgroup on Diet and Health that most studies did not report on allocation concealment or otherwise had unclear risk of bias for allocation concealment. Although low risk of bias in other elements of bias assessment (e.g. randomisation, blinding of outcome assessment) might suggest that the trials were well‐conducted and thus allocation concealment may have been maintained, many of the trials are older and detailed information on the conduct of the trials can be scarce. Therefore, a conservative approach was taken. Downgraded once.
- Inconsistency: I2 was between 30 and 60%. Not downgraded.
- Indirectness: Most data related to high‐income countries, and trials of men, but included people with and without CVD at baseline. Not downgraded.
- Imprecision: the 95% CI crossed the null and did not exclude important benefits or harms.Downgraded once.
- Publication bias: fewer than 10 included studies so no funnel plot run. Not downgraded.
dCoronary heart disease events
- Risk of bias: one included study in 458 participants, 58 of whom experienced at least 1 CHD event, was at low summary risk of bias. This study suggested an increased risk with higher omega‐6 intake (RR 1.63, 95% CI 1.00 to 2.67), though this was not mirrored in any other sensitivity analysis. Limiting to pre‐2010 or trials registry registered trials, those with no commercial funding, those at low risk of attention bias and those that randomised at least 100 participants all suggested some benefit of increasing omega‐6 fats. It was further noted by the WHO NUGAG Subgroup on Diet and Health that most studies did not report on allocation concealment or otherwise had unclear risk of bias for allocation concealment. Although low risk of bias in other elements of bias assessment (e.g. randomisation, blinding of outcome assessment) might suggest that the trials were well‐conducted and thus allocation concealment may have been maintained, many of the trials are older and detailed information on the conduct of the trials can be scarce. Therefore, a conservative approach was taken. Downgraded once.
- Inconsistency: I2 > 60%. Downgraded once.
- Indirectness: Most data related to high‐income countries, and trials of men, but included people with and without CVD at baseline. Not downgraded.
- Imprecision: the 95% CI crossed the null and did not exclude important benefits or harms. Downgraded once.
- Publication bias: fewer than 10 included studies so no funnel plot run. Not downgraded.
eMajor adverse cardiac and cerebrovascular events
- Risk of bias: no included studies were at low summary risk of bias or were without commercial funding. All other sensitivity analyses suggested benefits from increasing omega‐6 fats. Downgraded once.
- Inconsistency: I2 > 60%. Downgraded once.
- Indirectness: Most data related to high‐income countries, and trials of men, but included people with and without CVD at baseline. Not downgraded.
- Imprecision: the 95% CI crossed the null and did not exclude important benefits or harms. Downgraded once.
- Publication bias: fewer than 10 included studies so no funnel plot run. Not downgraded.
fStroke
- Risk of bias: one included study with 458 participants, 4 of whom experienced a stroke, was at low summary risk of bias. Sensitivity analyses including pre‐2010 or trials registry registered trials, only trials without commercial funding and larger trials all suggested that increasing omega‐6 fats increased stroke risk, while the single study at low risk of attention bias suggested reduced stroke risk, and fixed‐effect analysis suggested little or no effect of increasing omega‐6 fats. It was further noted by the WHO NUGAG Subgroup on Diet and Health that most studies did not report on allocation concealment or otherwise had unclear risk of bias for allocation concealment. Although low risk of bias in other elements of bias assessment (e.g. randomisation, blinding of outcome assessment) might suggest that the trials were well‐conducted and thus allocation concealment may have been maintained, many of the trials are older and detailed information on the conduct of the trials can be scarce. Therefore, a conservative approach was taken. Downgraded once.
- Inconsistency: I2 was between 30 and 60%. Not downgraded.
- Indirectness: Most data related to high‐income countries, and trials of men, but included people with and without CVD at baseline. Not downgraded.
- Imprecision: the 95% CI crossed the null and included large benefits (RR < 0.5) and large harms (RR > 2.0) from omega‐6 fats. Downgraded twice.
- Publication bias: fewer than 10 included studies so no funnel plot run. Not downgraded.
Summary of findings 2. Higher versus lower omega‐6: additional key outcomes.
| Higher versus lower omega‐6 for adults with or without CVD | ||||||
|
Patient or population: adults with or without existing CVD
Setting: includes free‐living participants and those living in institutions. Includes participants from North America, Australia, Asia and Europe, but most events occurred in studies carried out in Europe or North America
Intervention: higher omega‐6
Comparison: lower omega‐6 Eligible trials compared higher with lower omega‐6 fat (including LA, GLA, DGLA, AA, or any combination) intakes. The intervention had to be dietary supplementation, or a provided diet, or advice on diet. | ||||||
| Outcomes | Anticipated absolute effects* (95% CI) | Relative effect (95% CI) | № of participants (studies) | Certainty of the evidence (GRADE) | Comments | |
| Risk with lower omega‐6 | Risk with higher omega‐6 | |||||
| MI Study duration range 12‐96 months Omega‐6 dose range 2.8%‐24.5% E |
Study population | RR 0.88 (0.76 to 1.02) | 4606 (7 RCTs) | ⊕⊕⊝⊝ Lowa | Increasing omega‐6 fats may reduce risk of myocardial infarction. Downgraded once each for risk of bias and imprecision. 53 people would need to increase the amount of omega‐6 fat in their diet to prevent one person having a myocardial infarction (NNTB 53, 95% CI −334 to 28). | |
| 154 per 1000 | 135 per 1000 (117 to 157) | |||||
| Serum TC Study duration range 12‐96 months Omega‐6 dose range 2.0%‐24.5% E |
The mean serum total cholesterol was 5.88 mmol/L | MD 0.33 mmol/L lower (0.5 lower to 0.16 lower) | — | 4280 (10 RCTs) | ⊕⊕⊕⊕ Highb | Increasing omega‐6 fats reduces serum total cholesterol over at least 1 year; not downgraded |
| Serum TG Study duration range 12‐72 months Omega‐6 dose range 2.0%‐15.0% E |
The mean serum triglycerides was 1.45 mmol/L | MD 0.01 mmol/L lower (0.23 lower to 0.21 higher) | — | 834 (5 RCTs) | ⊕⊕⊝⊝ Lowc | Increasing omega‐6 fats may make little or no difference to serum triglycerides over at least one year. Downgraded once for imprecision, and once for inconsistency and risk of bias combined |
| LDL Study duration range 12‐24 months Omega‐6 dose range 2.0%‐15.0% E |
The mean low density lipoprotein was 2.35 mmol/L | MD 0.04 mmol/L lower (0.21 lower to 0.14 higher) | — | 244 (2 RCTs) | ⊕⊕⊝⊝ Lowd | Increasing omega‐6 fats may make little or no difference to LDL over at least one year. Downgraded for risk of bias and imprecision |
| HDL Study duration range 12‐24 months Omega‐6 dose range 2.0%‐15.0% E |
The mean high density lipoprotein was 1.15 mmol/L | MD 0.01 mmol/L lower (0.03 lower to 0.02 higher) | — | 1995 (4 RCTs) | ⊕⊕⊝⊝ Lowe | Increasing omega‐6 fats may have little or no effect on HDL over at least one year. Downgraded once each for risk of bias and imprecision |
| Body weight (kg) Study duration range 12‐48 months Omega‐6 dose range 0.8%‐2.8% E |
The mean body weight was 77.9 kg | MD 3.12 kg lower (12.6 lower to 6.36 higher) | — | 358 (4 RCTs) | ⊕⊝⊝⊝ Very lowf | We are uncertain whether increasing omega‐6 fats alters body weight as the evidence is of very low quality. Downgraded for risk of bias, imprecision and publication bias |
| BMI Study duration 51 months Omega‐6 dose 6.6% E |
The mean body mass index was 24.5 kg/m2 | MD 0.2 kg/m2 lower (0.56 lower to 0.16 higher) | — | 371 (1 RCT) | ⊕⊕⊕⊝ Moderateg | Increasing omega‐6 fats probably has little or no effect on body mass index over at least one year. Downgraded for imprecision |
| *The risk in the intervention group (and its 95% confidence interval) is based on the assumed risk in the comparison group and the relative effect of the intervention (and its 95% CI). AA: arachidonic acid; BMI: body mass index; CI: confidence interval; DGLA: dihomo‐gamma‐linolenic acid; GLA: gamma‐linolenic acid; HDL: high‐density lipoprotein; LA: linoleic acid; LDL: low‐density lipoprotein; MD: mean difference; MI: myocardial infarction; NNTB: number needed to treat for an additional beneficial outcome; RCT: randomised controlled trial; RR: risk ratio; TC: total cholesterol; TG: triglycerides; % E: percentage of energy intake from this nutrient. | ||||||
| GRADE Working Group grades of evidence High certainty: We are very confident that the true effect lies close to that of the estimate of the effect Moderate certainty: We are moderately confident in the effect estimate: The true effect is likely to be close to the estimate of the effect, but there is a possibility that it is substantially different Low certainty: Our confidence in the effect estimate is limited: The true effect may be substantially different from the estimate of the effect Very low certainty: We have very little confidence in the effect estimate: The true effect is likely to be substantially different from the estimate of effect | ||||||
aMyocardial infarction
- Risk of bias: only one trial with fewer than 10 participants experiencing events was at low summary risk of bias. All other sensitivity analyses suggested that increasing omega‐6 fats reduced risk of MI. It was further noted by the WHO NUGAG Subgroup on Diet and Health that most studies did not report on allocation concealment or otherwise had unclear risk of bias for allocation concealment. Although low risk of bias in other elements of bias assessment (e.g. randomisation, blinding of outcome assessment) might suggest that the trials were well‐conducted and thus allocation concealment may have been maintained, many of the trials are older and detailed information on the conduct of the trials can be scarce. Therefore, a conservative approach was taken. Downgraded once.
- Inconsisency: I2 = 0%, not downgraded.
- Indirectness: Most events occurred in men living in high‐income countries, but included people with and without CVD at baseline. Not downgraded.
- Imprecision: the 95% CI crossed the null. Downgraded once.
- Publication bias: fewer than 10 trials were included so funnel plot not useful. Not downgraded.
bSerum total cholesterol
- Risk of bias: reductions in total serum cholesterol were greater in studies with low summary risk of bias, and all sensitivity analyses suggested that increasing omega‐6 fats reduced serum total cholesterol. Not downgraded.
- Inconsistency: I2 > 60% but partly explained by dose effects in subgrouping. There was a suggestion of greater reductions in TC with greater increases in omega‐6 fats in subgrouping. Not downgraded.
- Indirectness: data came from men and women with and without baseline CVD, and from low‐ to middle income and high‐income countries. Not downgraded.
- Imprecision: 95% CI did not cross the null and included only benefits (reductions in total serum cholesterol with increased omega‐6 fats). Not downgraded.
- Publication bias: the funnel plot did not suggest small study bias. Not downgraded.
cSerum triglycerides
- Risk of bias: the one study at low summary risk of bias included 458 participants and found that omega‐6 fats caused a small reduction in TG (MD −0.10mmol/L, 95% CI −0.26 to 0.06), but single study. Sensitivity analyses not conducted. Downgraded once (in combination with inconsistency).
- Inconsistency: I2 > 60%. Downgraded once (in combination with risk of bias).
- Indirectness: data came from men and women with and without baseline CVD, and from low‐ to middle income and high‐income countries. Not downgraded.
- Imprecision: the 95% CI included small benefits and harms of omega‐6. Downgraded once.
- Publication bias: fewer than 10 trials were included so funnel plot not useful. Not downgraded.
dLow‐density lipoprotein
- Risk of bias: no included studies were at low summary risk of bias. Sensitivity analyses not conducted. Downgraded once.
- Inconsistency: I2 = 0%, not downgraded.
- Indirectness: only trials of men and women living in developing countries were included. Not downgraded.
- Imprecision: the 95% CI crossed the null and included small benefits and harms of omega‐6. Downgraded once.
- Publication bias: fewer than 10 trials were included so funnel plot not useful. Not downgraded.
eHigh‐density lipoprotein
- Risk of bias: No included studies were at low summary risk of bias. Sensitivity analyses not conducted. Downgraded once.
- Inconsistency: I2 = 0%, not downgraded.
- Indirectness: data came from men and women with and without baseline CVD, and from low‐ to middle income and high‐income countries. Not downgraded.
- Imprecision: the 95% CI crossed the null and included small benefits and harms of omega‐6. Downgraded once.
- Publication bias: fewer than 10 trials were included so funnel plot not useful. Not downgraded.
fBody weight
- Risk of bias: no included studies were at low summary risk of bias. Sensitivity analyses not conducted. It was further noted by the WHO NUGAG Subgroup on Diet and Health that most studies did not report on allocation concealment or otherwise had unclear risk of bias for allocation concealment. Although low risk of bias in other elements of bias assessment (e.g. randomisation, blinding of outcome assessment) might suggest that the trials were well‐conducted and thus allocation concealment may have been maintained, many of the trials are older and detailed information on the conduct of the trials can be scarce. Therefore, a conservative approach was taken. Downgraded once.
- Inconsistency: I2 = 30 to 60%. Not downgraded.
- Indirectness: Most data related to men and women without existing CVD living in high‐income countries. Not downgraded.
- Imprecision: 95% CI crossed the null and included important harms and benefits of omega‐6. Downgraded once.
- Publication bias: fewer than 10 trials so funnel plot not attempted. However we are aware of at least 2 studies with data that could not be added to the meta‐analysis. Downgraded once.
gBody mass index
- Risk of bias: the single included trial was at low summary risk of bias. Sensitivity analyses not conducted. Not downgraded.
- Inconsistency: only one trial included. Not downgraded.
- Indirectness: only one trial included, of men with previous MI and in a developed country. Not downgraded.
- Imprecision: the 95% CI crossed the null and included small benefits and harms of omega‐6. Downgraded once.
- Publication bias: fewer than 10 trials were included so funnel plot not useful. Not downgraded.
Primary outcomes
See Table 1.
All‐cause mortality
Increasing omega‐6 fats may make little or no difference to the risk of all‐cause mortality (low‐quality evidence, downgraded for risk of bias and imprecision, Table 1). This section reports the data and gives the reasoning for this assessment.
Ten trials contributed data to assess effects of increasing omega‐6 fats on all‐cause mortality, with 740 deaths in 4506 participants (Figure 3; Analysis 1.1). We found little or no effect of increasing omega‐6 fats on mortality (RR 1.00, 95% CI 0.88 to 1.12) and this lack of effect was consistent across trials (I2 = 0%). The funnel plot for all‐cause mortality did not suggest serious small study bias (not shown), but we are aware of some missing data on all‐cause mortality. Some deaths occurred in Bates 1977, but the trialists no longer have access to this information (7 of 76 randomised participants died or withdrew in the two intervention arms and 11 of 76 in the two control arms). There were also deaths in Houtsmuller 1979, but we know only numbers of CHD deaths. We were unable to establish contact with authors of two trials (that randomised 111 participants between them), which appeared eligible for inclusion but where no deaths or other relevant outcomes were reported, so these may include some further missing data (Harbige 2007; Millar 1973).
3.
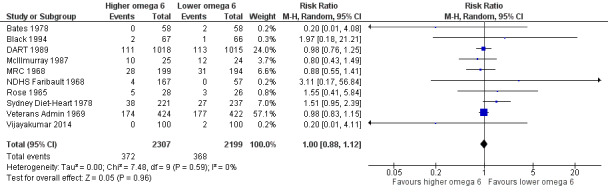
Forest plot of comparison: 1 Primary outcomes ‐ higher omega‐6 vs lower omega‐6, outcome: 1.1 All‐cause mortality (overall).
1.1. Analysis.
Comparison 1 Primary outcomes ‐ higher omega‐6 vs lower omega‐6, Outcome 1 All‐cause mortality (overall).
Sensitivity analyses limited to studies at low risk of summary bias (RR 1.54, 95% CI 0.98 to 2.41, 69 deaths in two trials; Analysis 1.3) or using fixed‐effect meta‐analysis did not alter this lack of effect (RR 1.00, 95% CI 0.89 to 1.13; Analysis 1.2). Other sensitivity analyses, limited to studies: up to 2010, plus studies post‐2010 that were registered on a trials register (Roberts 2015); with no industry funding; with a low risk of attention bias; randomising at least 250 participants, or at least 100 participants; all concurred in suggesting little or no effect of omega‐6 fats on all‐cause mortality (Analysis 1.3). We intended another sensitivity analysis with studies reporting less than 10% difference in intake of trans fats between study arms during the intervention, but as information on trans fats was almost completely lacking we did not attempt it.
1.3. Analysis.
Comparison 1 Primary outcomes ‐ higher omega‐6 vs lower omega‐6, Outcome 3 All‐cause mortality ‐ sensitivity analyses.
1.2. Analysis.
Comparison 1 Primary outcomes ‐ higher omega‐6 vs lower omega‐6, Outcome 2 All‐cause mortality ‐ sensitivity analysis by fixed‐effect analysis.
None of the subgroup analyses, by omega‐6 fat type (Analysis 1.4), intervention type (Analysis 1.5), energy replacement (Analysis 1.6), primary or secondary prevention of CVD (Analysis 1.7), omega‐6 fat dose (Analysis 1.8), trial duration (Analysis 1.9), statin use (Analysis 1.10), baseline omega‐6 fat intake (Analysis 1.11) or participant sex (Analysis 1.12) suggested important differences between subgroups or any effect of omega‐6 fats on all‐cause mortality. Trials often failed to report baseline omega‐6 fat intake, and where feasible we estimated this from omega‐6 fat or PUFA goals or dietary intake data. Replacement data were also unclear, but we considered dietary factors that reduced as omega‐6 fat intake went up (or vice versa) to be replacements, and we assessed them separately from other dietary changes aimed at or assessed. The extent in the change in omega‐3/omega‐6 fat ratio was generally unclear, so we did not use this subgrouping.
1.4. Analysis.
Comparison 1 Primary outcomes ‐ higher omega‐6 vs lower omega‐6, Outcome 4 All‐cause mortality ‐ subgroup by LA or GLA.
1.5. Analysis.
Comparison 1 Primary outcomes ‐ higher omega‐6 vs lower omega‐6, Outcome 5 All‐cause mortality ‐ subgroup by intervention type.
1.6. Analysis.
Comparison 1 Primary outcomes ‐ higher omega‐6 vs lower omega‐6, Outcome 6 All‐cause mortality ‐ subgroup by replacement.
1.7. Analysis.
Comparison 1 Primary outcomes ‐ higher omega‐6 vs lower omega‐6, Outcome 7 All‐cause mortality ‐ subgroup by baseline CVD risk.
1.8. Analysis.
Comparison 1 Primary outcomes ‐ higher omega‐6 vs lower omega‐6, Outcome 8 All‐cause mortality ‐ subgroup by omega‐6 dose.
1.9. Analysis.
Comparison 1 Primary outcomes ‐ higher omega‐6 vs lower omega‐6, Outcome 9 All‐cause mortality ‐ subgroup by duration.
1.10. Analysis.
Comparison 1 Primary outcomes ‐ higher omega‐6 vs lower omega‐6, Outcome 10 All‐cause mortality ‐ subgroup by statin use.
1.11. Analysis.
Comparison 1 Primary outcomes ‐ higher omega‐6 vs lower omega‐6, Outcome 11 All‐cause mortality ‐ subgroup by baseline omega‐6.
1.12. Analysis.
Comparison 1 Primary outcomes ‐ higher omega‐6 vs lower omega‐6, Outcome 12 All‐cause mortality ‐ subgroup by sex.
There was no suggestion of any effect of omega‐6 fats on all‐cause mortality or heterogeneity among studies (RR 1.0 and I2 = 0%), and meta‐regression did not suggest any relationships between risk of all‐cause mortality and omega‐6 fat dose in trials across the omega‐6, omega‐3 and total PUFA reviews, or from this review alone (P = 0.82); baseline omega‐6 intake (P = 0.68); or trial duration (P = 0.87).
More than half of the weight of the meta‐analysis came from one study, Veterans Admin 1969, with a further 24% from DART 1989. Veterans Admin 1969 and DART 1989 both included a substantial number of person‐years (Veterans Admin 1969 included 846 men for an average of 4 years, or 3384 person‐years, while DART 1989 included 2033 men for an average of 1.79 years, or 3639 person‐years). Veterans Admin 1969 had longer follow‐up, allowing more time for effects of the intervention to be expressed. The death rate in Veterans Admin 1969 was 10% per year while in DART 1989 it was 6% per year, perhaps reflecting socioeconomic and age differences. Veterans Admin 1969 participants were older, so more likely to die, with a mean age of 65 (up to 88 years) compared to DART 1989 with a mean age of 56 (all aged < 70 years).
In GRADE assessment, we downgraded the data for risk of bias (there was a suggestion that increasing omega‐6 fats increased risk of death in the two trials at low summary risk of bias) and imprecision (the 95% CI crossed the null). Increasing omega‐6 fats may make little or no difference to risk of all‐cause mortality (low‐quality evidence, Table 1). As there is no suggestion of protection or harm the number needed to treat for an additional beneficial outcome (NNTB) is infinitely large – an infinite number of people would need to increase the amount of omega‐6 fat in their diet to prevent one person dying of any cause (NNTB ∞, 95% CI NNTH (number needed to treat for an additional harmful outcome) 50 to NNTB 50).
Cardiovascular mortality (CVD mortality)
We are uncertain whether increasing omega‐6 fats alters risk of CVD mortality, as the quality of evidence was very low (downgraded for risk of bias, imprecision and inconsistency, Table 1).
There was important heterogeneity between trials increasing omega‐6 fats when assessing effects on CVD mortality (RR 1.09, 95% CI 0.76 to 1.55, I2 = 61%, 472 CVD deaths in 4019 participants randomised into 7 trials, Analysis 1.13). Effects in included trials varied from statistically significantly protective (Veterans Admin 1969, 138 CVD deaths, taking 26% of the weight of the meta‐analysis) to almost statistically significantly harmful (Sydney Diet‐Heart 1978, 62 CVD deaths and DART 1989 with 205 CVD deaths, taking 20% and 28% of the weight in the meta‐analysis, respectively). This variation in effects in different trials results in a high level of heterogeneity (I2 = 61%). Effects in sensitivity (Analysis 1.14; Analysis 1.15) and subgroup analyses appear to depend on which of these trials we included in each analysis or subgroup. This heterogeneity led to downgrading for inconsistency in GRADE assessment. As there were only seven trials we did not create a funnel plot.
1.13. Analysis.
Comparison 1 Primary outcomes ‐ higher omega‐6 vs lower omega‐6, Outcome 13 Cardiovascular mortality (overall).
1.14. Analysis.
Comparison 1 Primary outcomes ‐ higher omega‐6 vs lower omega‐6, Outcome 14 CVD mortality ‐ sensitivity analysis by fixed‐effect analysis.
1.15. Analysis.
Comparison 1 Primary outcomes ‐ higher omega‐6 vs lower omega‐6, Outcome 15 CVD mortality ‐ sensitivity analyses.
One included trial was at low summary risk of bias (RR 1.59, 95% CI 0.99 to 2.55, 62 people died of CVD). Because this trial suggested that increasing omega‐6 intake may increase risk of CVD deaths, we downgraded for risk of bias in GRADE, Analysis 1.15). No included trials had published protocols or trials register entries, but all were published before 2010. Almost all CVD deaths occurred in men and in high‐income countries.
All included trials increased LA, and all were in low statin use trials. Subgrouping by baseline omega‐6 fat intake reduced heterogeneity and suggested significant differences between subgroups (Analysis 1.21), though there were few trials in each subgroup. The data suggested that in populations with low omega‐6 fat intake (< 5% E) additional omega‐6 fats may be beneficial, but as baseline omega‐6 fat intake increases there is suggestion that adding more leads to harm. Subgroup analysis by intervention type suggested a significant difference between subgroups, with harmful effects of omega‐6 fat suggested in four dietary advice trials (RR 1.33, 95% CI 0.86 to 2.05, I2 = 38%), and beneficial effects in the single trial where all foods were provided (RR 0.70, 95% CI 0.51 to 0.96), with a statistically significant difference between subgroups (P = 0.04, Analysis 1.16). Subgrouping by primary or secondary prevention of CVD did not suggest important differences between subgroups but did reduce heterogeneity and suggested harmful effects of omega‐6 fat in secondary prevention trials (Analysis 1.18). None of the other subgroup analyses, by energy replacement (Analysis 1.17) or participant sex (Analysis 1.22) suggested significant differences between subgroups.
1.21. Analysis.
Comparison 1 Primary outcomes ‐ higher omega‐6 vs lower omega‐6, Outcome 21 CVD mortality ‐ subgroup by baseline omega‐6.
1.16. Analysis.
Comparison 1 Primary outcomes ‐ higher omega‐6 vs lower omega‐6, Outcome 16 CVD mortality ‐ subgroup by intervention type.
1.18. Analysis.
Comparison 1 Primary outcomes ‐ higher omega‐6 vs lower omega‐6, Outcome 18 CVD mortality ‐ subgroup by baseline CVD risk.
1.17. Analysis.
Comparison 1 Primary outcomes ‐ higher omega‐6 vs lower omega‐6, Outcome 17 CVD mortality ‐ subgroup by replacement.
1.22. Analysis.
Comparison 1 Primary outcomes ‐ higher omega‐6 vs lower omega‐6, Outcome 22 CVD mortality ‐ subgroup by sex.
We did not note dose‐response or duration effects; higher omega‐6 fat dose and longer duration appeared to cause smaller effects of omega‐6 fats on CVD mortality (Analysis 1.19; Analysis 1.20), which is counterintuitive. Meta‐regression did not suggest any relationships between risk of CVD mortality and: omega‐6 fat dose in the wider set of trials (P = 0.81), omega‐6 fat dose in trials of this review alone (P = 0.64), baseline omega‐6 intake (P = 0.29) or trial duration (P = 0.13). However, as there were only seven included trials in this review we had very little power to see any potential relationships, and this lack of power was exacerbated with regard to omega‐6 baseline intake, as several studies did not report this measure.
1.19. Analysis.
Comparison 1 Primary outcomes ‐ higher omega‐6 vs lower omega‐6, Outcome 19 CVD mortality ‐ subgroup by omega‐6 dose.
1.20. Analysis.
Comparison 1 Primary outcomes ‐ higher omega‐6 vs lower omega‐6, Outcome 20 CVD mortality ‐ subgroup by duration.
We found that effects of omega‐6 fats on CVD deaths were unclear, as results were imprecise, inconsistent and at risk of bias, so we assessed evidence as being of very low quality (Table 1).
Cardiovascular events (CVD events)
Increasing omega‐6 fats may make little or no difference to risk of CVD events (low‐quality evidence, downgraded for risk of bias and imprecision, Table 1).
There was little or no effect of increasing omega‐6 fats on CVD events in seven trials including 4962 participants, 1404 of whom experienced a CVD event (RR 0.97, 95% CI 0.81 to 1.15, I2 = 45%, Figure 4; Analysis 1.23). This lack of effect was not altered in any sensitivity analyses apart from the one for risk of bias (Analysis 1.24; Analysis 1.25). Meta‐analysis of the two studies at low summary risk of bias suggested harm from increased omega‐6 (RR 1.62, 95% CI 1.02 to 2.57, 68 people experienced at least one CVD event). As this effect was distinct from the lack of effect seen overall we downgraded for risk of bias in GRADE assessment. Almost all CVD events occurred in men and in high‐income countries.
4.
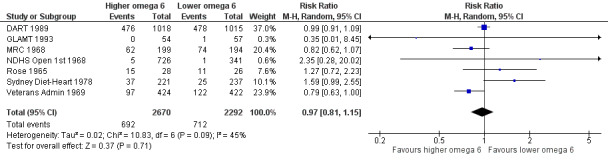
Forest plot of comparison: 1 Primary outcomes ‐ higher omega‐6 vs lower omega‐6, outcome: 1.23 Any cardiovascular event (overall).
1.23. Analysis.
Comparison 1 Primary outcomes ‐ higher omega‐6 vs lower omega‐6, Outcome 23 Any cardiovascular event (overall).
1.24. Analysis.
Comparison 1 Primary outcomes ‐ higher omega‐6 vs lower omega‐6, Outcome 24 CVD events ‐ sensitivity analysis by fixed‐effect analysis.
1.25. Analysis.
Comparison 1 Primary outcomes ‐ higher omega‐6 vs lower omega‐6, Outcome 25 CVD events ‐ sensitivity analyses.
There were no statistically significant differences for any subgroup (Analysis 1.26; Analysis 1.27; Analysis 1.28; Analysis 1.29; Analysis 1.30; Analysis 1.31; Analysis 1.32; Analysis 1.33; Analysis 1.34). All trials used low levels only of statins. There was no suggestion of greater effect with higher omega‐6 fat dose or longer study duration. Meta‐regression within the wider set of trials did not suggest any effect of omega‐6 fat dose on CVD events (P = 0.34), or omega‐6 fat dose in trials of this review alone (P = 0.55), baseline omega‐6 intake (P = 0.63) or trial duration (P = 0.37). As there were only seven included trials in this review, we had very little power to see any potential relationships, and this lack of power was exacerbated with regard to omega‐6 baseline intake, as several studies did not report this measure.
1.26. Analysis.
Comparison 1 Primary outcomes ‐ higher omega‐6 vs lower omega‐6, Outcome 26 CVD events ‐ subgroup by LA or GLA.
1.27. Analysis.
Comparison 1 Primary outcomes ‐ higher omega‐6 vs lower omega‐6, Outcome 27 CVD events ‐ subgroup by intervention type.
1.28. Analysis.
Comparison 1 Primary outcomes ‐ higher omega‐6 vs lower omega‐6, Outcome 28 CVD events ‐ subgroup by replacement.
1.29. Analysis.
Comparison 1 Primary outcomes ‐ higher omega‐6 vs lower omega‐6, Outcome 29 CVD events ‐ subgroup by baseline CVD risk.
1.30. Analysis.
Comparison 1 Primary outcomes ‐ higher omega‐6 vs lower omega‐6, Outcome 30 CVD events ‐ subgroup by primary vs secondary prevention.
1.31. Analysis.
Comparison 1 Primary outcomes ‐ higher omega‐6 vs lower omega‐6, Outcome 31 CVD events ‐ subgroup by omega‐6 dose.
1.32. Analysis.
Comparison 1 Primary outcomes ‐ higher omega‐6 vs lower omega‐6, Outcome 32 CVD events ‐ subgroup by duration.
1.33. Analysis.
Comparison 1 Primary outcomes ‐ higher omega‐6 vs lower omega‐6, Outcome 33 CVD events ‐ subgroup by baseline omega‐6.
1.34. Analysis.
Comparison 1 Primary outcomes ‐ higher omega‐6 vs lower omega‐6, Outcome 34 CVD events ‐ subgroup by sex.
We found that increasing omega‐6 fats may make little or no difference to risk of CVD events (low‐quality evidence, downgraded due to risk of bias and imprecision, Table 1). One hundred people would need to increase the amount of omega‐6 fat in their diet to prevent one person having a CVD event (the NNTB is 100, 95% CI −21 to 17, or from treating 21 people to cause one additional person to experience a cardiovascular event to treating 17 people to prevent one person having a CVD event).
Coronary heart disease events (CHD events, including MI or angina)
We are uncertain whether increasing omega‐6 fats alters the risk of CHD events, as the quality of evidence was very low (downgraded for risk of bias, imprecision and inconsistency, Table 1).
Seven trials in 3997 participants, 1059 of whom experienced coronary heart disease events, assessed whether increasing omega‐6 fats alters the risk of CHD events. The meta‐analysis was highly heterogeneous (RR 0.88, 95% CI 0.66 to 1.17, I2 = 71%, Analysis 1.35, GRADE downgraded for inconsistency). Heterogeneity only fell below I2 = 50% in one sensitivity analysis, limited to studies at low risk of attention bias (RR 0.83, 95% CI 0.62 to 1.09, I2 = 0%, 160 of 1011 participants experienced a CHD event in 3 trials, Analysis 1.37). One study was at low summary risk of bias (RR 1.63, 95% CI 1.00 to 2.67, 58 people experienced CHD events, P = 0.05), and the suggested increase in CHD event risk with increased omega‐6 fats led to us downgrade the quality of evidence for risk of bias in GRADE assessment. CHD events almost all occurred in men and in high‐income countries. Fixed‐effect analysis suggested similar effect size to random‐effects analysis (Analysis 1.36).
1.35. Analysis.
Comparison 1 Primary outcomes ‐ higher omega‐6 vs lower omega‐6, Outcome 35 Coronary heart disease events (overall): myocardial infarction (fatal or non‐fatal) or angina.
1.37. Analysis.
Comparison 1 Primary outcomes ‐ higher omega‐6 vs lower omega‐6, Outcome 37 CHD events ‐ sensitivity analyses.
1.36. Analysis.
Comparison 1 Primary outcomes ‐ higher omega‐6 vs lower omega‐6, Outcome 36 CHD events ‐ sensitivity analysis by fixed‐effect analysis.
Subgrouping did not explain the high levels of heterogeneity (Analysis 1.38; Analysis 1.39; Analysis 1.41; Analysis 1.42; Analysis 1.43; Analysis 1.44; Analysis 1.45), but there were significant differences in subgroup analyses by CVD risk at baseline, sex and replacement. Where omega‐6 fat replaced MUFA, there was an increased risk of CHD events, while omega‐6 fat replacing carbohydrates appeared to reduce CHD event risk (Analysis 1.40). Illogically there were effects in subgroups of men and women, but not of men or women alone (Analysis 1.45), and effects in people with moderate CVD risk but not high or low baseline CVD risk (Analysis 1.41). All trials used low levels only of statins. However there were only one to three trials in each relevant subgroup, so caution is warranted when drawing conclusions.
1.38. Analysis.
Comparison 1 Primary outcomes ‐ higher omega‐6 vs lower omega‐6, Outcome 38 CHD events ‐ subgroup by LA or GLA.
1.39. Analysis.
Comparison 1 Primary outcomes ‐ higher omega‐6 vs lower omega‐6, Outcome 39 CHD events ‐ subgroup by intervention type.
1.41. Analysis.
Comparison 1 Primary outcomes ‐ higher omega‐6 vs lower omega‐6, Outcome 41 CHD events ‐ subgroup by baseline CVD risk.
1.42. Analysis.
Comparison 1 Primary outcomes ‐ higher omega‐6 vs lower omega‐6, Outcome 42 CHD events ‐ subgroup by omega‐6 dose.
1.43. Analysis.
Comparison 1 Primary outcomes ‐ higher omega‐6 vs lower omega‐6, Outcome 43 CHD events ‐ subgroup by duration.
1.44. Analysis.
Comparison 1 Primary outcomes ‐ higher omega‐6 vs lower omega‐6, Outcome 44 CHD events ‐ subgroup by baseline omega‐6.
1.45. Analysis.
Comparison 1 Primary outcomes ‐ higher omega‐6 vs lower omega‐6, Outcome 45 CHD events ‐ subgroup by sex.
1.40. Analysis.
Comparison 1 Primary outcomes ‐ higher omega‐6 vs lower omega‐6, Outcome 40 CHD events ‐ subgroup by replacement.
There were no statistically significant differences between subgroups for dose (Analysis 1.42) or duration (Analysis 1.43). As meta‐regression did not suggest any effect of omega‐6 fat dose on coronary heart disease events in the wider set of trials (P = 0.76) or only in trials in this review (P = 0.79), we assumed these effects were likely to be spurious. Meta‐regression did not suggest any relationships between baseline omega‐6 intake (P = 0.66) or trial duration (P = 0.39) and risk of CHD events, but as there were only seven included trials in this review we had little power to see potential relationships.
We found that effects of omega‐6 fats on coronary heart disease events were unclear, as evidence was very low quality (downgraded for risk of bias, imprecision and inconsistency, Table 1).
Major adverse cardiac and cerebrovascular events (MACCEs)
We are uncertain whether increasing omega‐6 fats alters risk of MACCEs, as the quality of evidence was very low (downgraded for risk of bias, imprecision and inconsistency, Table 1).
Only two trials in 2879 participants, 817 of whom experienced a MACCE, provided data on this outcome (RR 0.84, 95% CI 0.59 to 1.20, I2 = 79%, Analysis 1.46; wide confidence intervals did not exclude important benefits or harms, so we downgraded for imprecision). The two trials provided highly heterogeneous results (so were downgraded for inconsistency). There was a suggestion of reduced risk of MACCEs in the single trial at low risk of attention bias, but no trials were at low summary risk of bias (downgraded for risk of bias) and no other sensitivity analyses suggested important effects of omega‐6 fats on MACCEs (Analysis 1.48; Analysis 1.47). Both included studies were in men only, studied increased LA, and had low levels of statin use. There were only two included trials, but these were very different, so that there were significant differences in subgroup analyses with more than one subgroup (Analysis 1.49; Analysis 1.50; Analysis 1.51; Analysis 1.52; Analysis 1.53; Analysis 1.54), and there were insufficient data to carry out meta‐regression. Both included trials were in men living in developed countries.
1.46. Analysis.
Comparison 1 Primary outcomes ‐ higher omega‐6 vs lower omega‐6, Outcome 46 Major adverse cardiac and cerebrovascular events (MACCEs), overall.
1.48. Analysis.
Comparison 1 Primary outcomes ‐ higher omega‐6 vs lower omega‐6, Outcome 48 MACCEs ‐ sensitivity analyses.
1.47. Analysis.
Comparison 1 Primary outcomes ‐ higher omega‐6 vs lower omega‐6, Outcome 47 MACCEs ‐ sensitivity analysis by fixed‐effect analysis.
1.49. Analysis.
Comparison 1 Primary outcomes ‐ higher omega‐6 vs lower omega‐6, Outcome 49 MACCEs ‐ subgroup by intervention type.
1.50. Analysis.
Comparison 1 Primary outcomes ‐ higher omega‐6 vs lower omega‐6, Outcome 50 MACCEs ‐ subgroup by replacement.
1.51. Analysis.
Comparison 1 Primary outcomes ‐ higher omega‐6 vs lower omega‐6, Outcome 51 MACCEs ‐ subgroup by baseline CVD risk.
1.52. Analysis.
Comparison 1 Primary outcomes ‐ higher omega‐6 vs lower omega‐6, Outcome 52 MACCEs ‐ subgroup by omega‐6 dose.
1.53. Analysis.
Comparison 1 Primary outcomes ‐ higher omega‐6 vs lower omega‐6, Outcome 53 MACCEs ‐ subgroup by duration.
1.54. Analysis.
Comparison 1 Primary outcomes ‐ higher omega‐6 vs lower omega‐6, Outcome 54 MACCEs ‐ subgroup by baseline omega‐6.
We are uncertain whether increasing omega‐6 fats affects risk of MACCEs, as the quality of evidence has been assessed as very low (downgraded for risk of bias, imprecision and inconsistency, Table 1).
Stroke (fatal or non‐fatal)
We are uncertain whether increasing omega‐6 fats alters risk of stroke, as the quality of evidence was very low (downgraded for once for risk of bias, twice for imprecision, Table 1).
Only four trials provided stroke data, and only 54 of 3730 included participants experienced a stroke (Analysis 1.55). These studies suggested that omega‐6 fats increase stroke risk (RR 1.36, 95% CI 0.45 to 4.11, I2 = 56%), but studies were heterogeneous and confidence intervals very wide (as important benefits and harms were not excluded, we downgraded for imprecision). One study with only four people experiencing a stroke was at low summary risk of bias (RR 1.07, 95% CI 0.15 to 7.55; we downgraded for risk of bias as there were almost no data from studies at low summary risk of bias). The single study at low risk of attention bias suggested a reduction in stroke risk with increased omega‐6 fats (Analysis 1.57). Fixed‐effect analysis suggested little or no effect of omega‐6 fats (RR 1.0, 95% CI 0.59 to 1.68, Analysis 1.56), while other sensitivity analyses suggested increased risk of stroke with increased omega‐6 fat (Analysis 1.57).
1.55. Analysis.
Comparison 1 Primary outcomes ‐ higher omega‐6 vs lower omega‐6, Outcome 55 Stroke: fatal or non‐fatal (overall).
1.57. Analysis.
Comparison 1 Primary outcomes ‐ higher omega‐6 vs lower omega‐6, Outcome 57 Stroke ‐ sensitivity analyses.
1.56. Analysis.
Comparison 1 Primary outcomes ‐ higher omega‐6 vs lower omega‐6, Outcome 56 Stroke ‐ sensitivity analysis by fixed‐effect analysis.
All included studies were of LA rather than GLA, in men only, and none were in populations using statins. None were from low‐ and middle‐income countries. Subgrouping by intervention type (Analysis 1.58: dietary advice was harmful, and providing all foods had a protective effect), baseline CVD risk (Analysis 1.60: increasing omega‐6 fat was protective in primary prevention and harmful in people with existing CVD), omega‐6 fat dose (Analysis 1.61: a low omega‐6 fat dose was harmful and a higher dose protective), duration (Analysis 1.62: in trials under four years duration omega‐6 fats were harmful and in longer trials protective) and baseline omega‐6 dose ( Analysis 1.63: omega‐6 fat supplementation is useful when baseline dose is low) appeared to reduce heterogeneity, but with only four trials contributing, this appeared to relate to whether DART 1989 and Veterans Admin 1969 were in the same or different subgroups. Other analyses were not informative (Analysis 1.60; Analysis 1.63; Analysis 1.64; Analysis 1.65).
1.58. Analysis.
Comparison 1 Primary outcomes ‐ higher omega‐6 vs lower omega‐6, Outcome 58 Stroke ‐ subgroup by intervention type.
1.60. Analysis.
Comparison 1 Primary outcomes ‐ higher omega‐6 vs lower omega‐6, Outcome 60 Stroke ‐ subgroup by baseline CVD risk.
1.61. Analysis.
Comparison 1 Primary outcomes ‐ higher omega‐6 vs lower omega‐6, Outcome 61 Stroke ‐ subgroup by omega‐6 dose.
1.62. Analysis.
Comparison 1 Primary outcomes ‐ higher omega‐6 vs lower omega‐6, Outcome 62 Stroke ‐ subgroup by duration.
1.63. Analysis.
Comparison 1 Primary outcomes ‐ higher omega‐6 vs lower omega‐6, Outcome 63 Stroke ‐ subgroup by baseline omega‐6.
1.64. Analysis.
Comparison 1 Primary outcomes ‐ higher omega‐6 vs lower omega‐6, Outcome 64 Stroke ‐ subgroup by stroke type.
1.65. Analysis.
Comparison 1 Primary outcomes ‐ higher omega‐6 vs lower omega‐6, Outcome 65 Stroke ‐ subgroup by fatality.
Effects of dose and duration were counter‐intuitive (as above) and meta‐regression did not suggest any effect of omega‐6 fat dose on stroke (P = 0.19) in the wider set of trials. There were insufficient trials to carry out meta‐regression on data from trials within this review only.
We are uncertain whether increasing omega‐6 fats affects stroke risk, as the quality of evidence was very low (GRADE assessment was downgraded once for risk of bias and twice for imprecision, Table 1).
Secondary outcomes
We formally systematically reviewed secondary outcomes, including all relevant studies that assessed any of these outcomes in the review, so results below are systematic review results for effects of omega‐6 fats on these outcomes over at least one year duration. Table 2 presents results for key outcomes.
We carried out sensitivity and subgroup analyses for key outcomes that were secondary outcomes in this review when the main forest plot included at least six trials contributing data to the analysis. These outcomes were myocardial infarction, lipids and adiposity, but only myocardial infarction and total cholesterol included enough studies for us to run sensitivity analyses and subgroups.
Other CVD events
Myocardial infarction (MI)
Increasing omega‐6 fats may reduce risk of myocardial infarction. Seven included studies reported on risk of a new or recurrent MI, and meta‐analysis suggested a 12% reduction in risk of MI with increased omega‐6 fat from 15.4% to 13.5% (RR 0.88, 95% CI 0.76 to 1.02, 609 events, I2 = 0%, Figure 5; Analysis 2.1). Few reported MIs (only 49) were fatal, and the effect on non‐fatal MIs appeared protective (RR 0.76, 95% CI 0.58 to 1.01, 189 people experiencing non‐fatal MI, data not shown). Sensitivity analyses included one trial (with 5 participants having an MI) at low summary risk of bias (downgraded for risk of bias as most event data were from trials at moderate to high summary risk of bias). All the other sensitivity analyses suggested reduction in MI risk with increasing omega‐6 fats (Analysis 2.3; Analysis 2.2).
5.
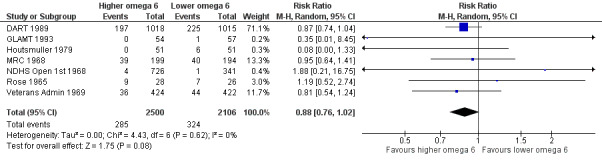
Forest plot of comparison: 2 Secondary outcomes ‐ higher omega‐6 vs lower omega‐6, outcome: 2.1 Myocardial infarction (MI), overall.
2.1. Analysis.
Comparison 2 Secondary outcomes ‐ higher omega‐6 vs lower omega‐6, Outcome 1 Myocardial infarction (MI), overall.
2.3. Analysis.
Comparison 2 Secondary outcomes ‐ higher omega‐6 vs lower omega‐6, Outcome 3 MI ‐ sensitivity analyses.
2.2. Analysis.
Comparison 2 Secondary outcomes ‐ higher omega‐6 vs lower omega‐6, Outcome 2 MI ‐ sensitivity analysis by fixed‐effect analysis.
There were no statistically significant differences between subgroups for intervention type (Analysis 2.4), replacement (Analysis 2.5), CVD risk (Analysis 2.6), omega‐6 dose (Analysis 2.7), duration (Analysis 2.8), statin use (Analysis 2.9), baseline omega‐6 intake (Analysis 2.10) or sex (Analysis 2.11). Almost all MIs in included trials occurred in men living in high‐income countries.
2.4. Analysis.
Comparison 2 Secondary outcomes ‐ higher omega‐6 vs lower omega‐6, Outcome 4 MI ‐ subgroup by intervention type.
2.5. Analysis.
Comparison 2 Secondary outcomes ‐ higher omega‐6 vs lower omega‐6, Outcome 5 MI ‐ subgroup by replacement.
2.6. Analysis.
Comparison 2 Secondary outcomes ‐ higher omega‐6 vs lower omega‐6, Outcome 6 MI ‐ subgroup by baseline CVD risk.
2.7. Analysis.
Comparison 2 Secondary outcomes ‐ higher omega‐6 vs lower omega‐6, Outcome 7 MI ‐ subgroup by omega‐6 dose.
2.8. Analysis.
Comparison 2 Secondary outcomes ‐ higher omega‐6 vs lower omega‐6, Outcome 8 MI ‐ subgroup by duration.
2.9. Analysis.
Comparison 2 Secondary outcomes ‐ higher omega‐6 vs lower omega‐6, Outcome 9 MI ‐ subgroup by statin use.
2.10. Analysis.
Comparison 2 Secondary outcomes ‐ higher omega‐6 vs lower omega‐6, Outcome 10 MI ‐ subgroup by baseline omega‐6.
2.11. Analysis.
Comparison 2 Secondary outcomes ‐ higher omega‐6 vs lower omega‐6, Outcome 11 MI ‐ subgroup by sex.
We found that increasing omega‐6 fats may reduce risk of myocardial infarction (low‐quality evidence, GRADE downgraded for risk of bias and imprecision, Table 2). Fifty‐three people would need to increase the amount of omega‐6 fat in their diet to prevent one person having a myocardial infarction (the NNTB is 53, 95% CI −334 to 28, or from 334 people increasing their omega‐6 fats to cause one additional person to have an MI to 28 people increasing their omega‐6 fats to prevent one person experiencing an MI).
Angina
Trials reported few cases of new or worsening angina, but there was a suggestion of protection against angina with omega‐6 fats (RR 0.61, 95% CI 0.27 to 1.40, 63 events in 4 trials, I2 = 51%, Analysis 2.12). We are uncertain whether increasing omega‐6 fats affects risk of angina as the quality of evidence was very low.
2.12. Analysis.
Comparison 2 Secondary outcomes ‐ higher omega‐6 vs lower omega‐6, Outcome 12 Angina.
Sudden cardiac death
Three trials reported sudden cardiac death, including 65 sudden cardiac deaths. Meta‐analysis suggested reduced risk of sudden cardiac death with omega‐6 fats (RR 0.79, 95% CI 0.49 to 1.29, I2 = 0%, Analysis 2.13). We are uncertain whether omega‐6 fats alter the risk of sudden cardiac death as the evidence is of very low quality.
2.13. Analysis.
Comparison 2 Secondary outcomes ‐ higher omega‐6 vs lower omega‐6, Outcome 13 Sudden cardiac death.
New or recurrent arrhythmia, including atrial fibrillation (AF), ventricular tachycardia (VT) and ventricular fibrillation (VF)
No included trials reported any of these events.
Heart failure
With only 10 heart failure diagnoses (in two trials) the effect of omega‐6 fats on heart failure was unclear (RR 0.66, 95% CI 0.19 to 2.35, I2 = 0%, Analysis 2.14). We are uncertain whether omega‐6 fats alter the risk of heart failure, as the evidence is of very low quality.
2.14. Analysis.
Comparison 2 Secondary outcomes ‐ higher omega‐6 vs lower omega‐6, Outcome 14 Heart failure.
Revascularisation
Only four participants in a single trial reported on revascularisation (RR 1.00, 95% CI 0.14 to 6.96, Analysis 2.15). We are uncertain whether omega‐6 fats alter the risk of revascularisation as the evidence is of very low quality.
2.15. Analysis.
Comparison 2 Secondary outcomes ‐ higher omega‐6 vs lower omega‐6, Outcome 15 Revascularisation ‐ angioplasty or coronary artery bypass grafting.
Peripheral arterial disease (PAD) events
Three studies reported 53 PAD events, with no suggestion of any effect of omega‐6 fats (RR 1.01, 95% CI 0.60 to 1.70, I2 = 0%, Analysis 2.16) .We are uncertain whether omega‐6 fats alter the risk of PAD, as the evidence is of very low quality.
2.16. Analysis.
Comparison 2 Secondary outcomes ‐ higher omega‐6 vs lower omega‐6, Outcome 16 Peripheral arterial disease events.
Risk factors
Serum lipids
Increasing omega‐6 fats reduces serum total cholesterol (high‐quality evidence, not downgraded), and may make little or no difference to serum triglycerides (TG), LDL or HDL (low‐quality evidence, TG downgraded once for imprecision and once for inconsistency and risk of bias (combined), LDL and HDL both downgraded for risk of bias and imprecision, Table 2).
There was a 6% reduction in total serum cholesterol in participants who increased omega‐6 fats compared to control (MD −0.33 mmol/L, 95% CI −0.50 to −0.16, I2 = 81%, including data from 4280 participants in 10 trials, Figure 6; Analysis 2.17). As serum total cholesterol was a key outcome, we ran sensitivity and subgroup analyses. All sensitivity analyses showed reduced total serum cholesterol with increased omega‐6 fats, including the trials at low summary risk of bias (MD −0.53 mmol/L, 95% CI −0.82 to −0.26, 1179 participants, Analysis 2.19; Analysis 2.18).
6.
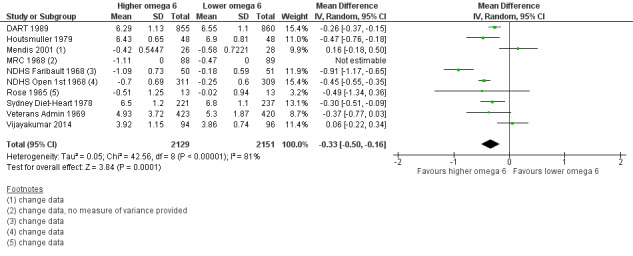
Forest plot of comparison: 2 Secondary outcomes ‐ higher omega‐6 vs lower omega‐6, outcome: 2.17 Serum total cholesterol (TC), mmol/L.
2.17. Analysis.
Comparison 2 Secondary outcomes ‐ higher omega‐6 vs lower omega‐6, Outcome 17 Serum total cholesterol (TC), mmol/L.
2.19. Analysis.
Comparison 2 Secondary outcomes ‐ higher omega‐6 vs lower omega‐6, Outcome 19 TC, mmol/L ‐ sensitivity analyses.
2.18. Analysis.
Comparison 2 Secondary outcomes ‐ higher omega‐6 vs lower omega‐6, Outcome 18 TC, mmol/L ‐ sensitivity analysis by fixed‐effect analysis.
All included studies increased LA, rather than GLA. There were statistically significant differences between subgroups by intervention type, replacement and statin use. Subgroup analyses by intervention type suggested reduced serum total cholesterol with dietary advice and interventions providing all food, but not with supplementary foods or advice plus supplementary foods (Analysis 2.20). There was reduced total cholesterol when omega‐6 fat replaced saturated fat, monounsaturated fat and carbohydrate, but not in the subgroup analysis where the replacement was unclear (Analysis 2.21). Subgroup analyses by statin use suggested greater reductions in TC in people not taking statins (only one trial included most people on statins, Analysis 2.25). There were no statistically significant differences between subgroups by baseline omega‐6 fat intake (Analysis 2.26), sex (Analysis 2.27), baseline CVD risk (Analysis 2.22), duration (Analysis 2.24) or omega‐6 fat dose (Analysis 2.23).
2.20. Analysis.
Comparison 2 Secondary outcomes ‐ higher omega‐6 vs lower omega‐6, Outcome 20 TC, mmol/L ‐ subgroup by intervention type.
2.21. Analysis.
Comparison 2 Secondary outcomes ‐ higher omega‐6 vs lower omega‐6, Outcome 21 TC, mmol/L ‐ subgroup by replacement.
2.25. Analysis.
Comparison 2 Secondary outcomes ‐ higher omega‐6 vs lower omega‐6, Outcome 25 TC, mmol/L ‐ subgroup by statin use.
2.26. Analysis.
Comparison 2 Secondary outcomes ‐ higher omega‐6 vs lower omega‐6, Outcome 26 TC, mmol/L ‐ subgroup by baseline omega‐6.
2.27. Analysis.
Comparison 2 Secondary outcomes ‐ higher omega‐6 vs lower omega‐6, Outcome 27 TC, mmol/L ‐ subgroup by sex.
2.22. Analysis.
Comparison 2 Secondary outcomes ‐ higher omega‐6 vs lower omega‐6, Outcome 22 TC, mmol/L ‐ subgroup by baseline CVD risk.
2.24. Analysis.
Comparison 2 Secondary outcomes ‐ higher omega‐6 vs lower omega‐6, Outcome 24 TC, mmol/L ‐ subgroup by duration.
2.23. Analysis.
Comparison 2 Secondary outcomes ‐ higher omega‐6 vs lower omega‐6, Outcome 23 TC, mmol/L ‐ subgroup by omega‐6 dose.
The funnel plot did not suggest any publication or small study bias (not shown). We are aware of missing data on total cholesterol in MRC 1968, as the provided data lacked any information on variance, but data clearly corroborated the greater reductions in total cholesterol in the higher omega‐6 fat arm in meta‐analysis (data shown in Analysis 2.17). Total cholesterol data in Dullart 1992 were too different between study arms at baseline to include in analysis.
We found that increasing omega‐6 fats reduces serum total cholesterol over at least one year (high‐quality evidence, inconsistency partially explained by dose effects, Table 2).
Data on serum triglycerides (MD −0.01 mmol/L, 95% CI −0.23 to 0.21, I2 = 72%, 834 participants in 5 trials, Analysis 2.28), HDL (MD −0.01 mmol/L, 95% CI −0.03 to 0.02, I2 = 0%, 1995 participants in 4 trials, Analysis 2.30), and LDL cholesterol (MD −0.04 mmol/L, 95% CI −0.21 to 0.14, I2 = 0%, 244 participants in 2 trials, Analysis 2.29) were much more limited, without any clear suggestion of alteration with increased omega‐6 fats. Due to the limited numbers of trials for these outcomes, we did not run sensitivity or subgroup analyses. We are aware of missing data on TGs from NDHS Faribault 1968 and NDHS Open 1st 1968, and missing data on LDL in Dullart 1992. In NDHS Faribault 1968 the percentage change for TG from baseline to 44 week was −6.4% in the control group and −12.7% in intervention group B, −7.1% in C, −16.9% in E, but data were less clear for NDHS Open 1st 1968. LDL data in Dullart 1992 were too different between study arms at baseline to include in analysis.
2.28. Analysis.
Comparison 2 Secondary outcomes ‐ higher omega‐6 vs lower omega‐6, Outcome 28 Serum triglycerides (TG), mmol/L.
2.30. Analysis.
Comparison 2 Secondary outcomes ‐ higher omega‐6 vs lower omega‐6, Outcome 30 High‐density lipoprotein (HDL), mmol/L.
2.29. Analysis.
Comparison 2 Secondary outcomes ‐ higher omega‐6 vs lower omega‐6, Outcome 29 Low‐density lipoprotein (LDL), mmol/L.
We found that increasing omega‐6 fat may have little or no effect on serum HDL or LDL (both low‐quality evidence, downgraded for risk of bias and imprecision), or triglycerides (low‐quality evidence, downgraded once for imprecision and once for inconsistency and risk of bias combined, Table 2).
Adiposity
Only two small trials in 66 participants fully reported on body weight (MD −3.12 kg, 95% CI −12.6 to 6.36, I2 = 58%, Analysis 2.31), and one trial in 371 participants on body mass index (MD −0.20 kg/m2, 95% CI −0.56 to 0.16, Analysis 2.32; this study was at low summary risk of bias). Both outcomes suggested slightly lower adiposity associated with higher omega‐6 fat intake (though body weight was higher in the omega‐6 fat arms of the two trials that could not be included in body weight assessment due to lack of variance information, suggesting possible publication bias, Analysis 2.31). One small trial (30 participants) suggested that omega‐6 fats resulted in lower fat weight (MD −7.7 kg, 95% CI −14.6 to −0.8, Analysis 2.33) – a surprisingly large suggested effect. Weight data were measured but not included in analyses for Black 1994 and MRC 1968 (shown in Analysis 2.31 but not included in meta‐analysis because variance data were missing), as well as NDHS Faribault 1968 and NDHS Open 1st 1968, so publication bias may be an issue for this outcome.
2.31. Analysis.
Comparison 2 Secondary outcomes ‐ higher omega‐6 vs lower omega‐6, Outcome 31 Body weight, kg.
2.32. Analysis.
Comparison 2 Secondary outcomes ‐ higher omega‐6 vs lower omega‐6, Outcome 32 Body mass index, kg/m2.
2.33. Analysis.
Comparison 2 Secondary outcomes ‐ higher omega‐6 vs lower omega‐6, Outcome 33 Fat weight, kg.
Overall, we found that increasing omega‐6 fats probably has little or no effect on adiposity, measured using body mass index, over at least one year (moderate‐quality evidence, downgraded for imprecision, evidence for body weight and fat weight were of very low quality, Table 2).
Tertiary outcomes
We did not formally systematically review these outcomes, but where included studies reported them, we collated and analysed them.
Blood pressure
We found limited information on blood pressure, and there were no important effects of omega‐6 fats on either systolic or diastolic blood pressure. One trial fully reported systolic and diastolic blood pressure (sBP MD −1.10 mmHg, 95% CI −4.05 to 1.85, 458 participants, dBP MD −0.30 mmHg, 95% CI −2.04 to 1.44, 458 participants), and another partially reported it (Analysis 3.1). Lack of data on this commonly collected outcome may suggest publication bias.
3.1. Analysis.
Comparison 3 Tertiary outcomes ‐ higher omega‐6 vs lower omega‐6, Outcome 1 BP ‐ systolic and diastolic blood pressure, mmHg.
Quality of life, economic costs, dropouts
No included trials assessed effects of increased omega‐6 fats on quality of life or economic costs. The effect of the intervention on dropouts was heterogeneous, suggesting that increasing omega‐6 fats was fairly acceptable in some trials, but not in others. The pooled risk ratio suggested greater risk of dropping out in the higher omega‐6 fat arms (RR 1.49, 95% CI 1.18 to 1.89, 242 events in 8 trials, I2 = 61%, Analysis 3.2, with almost 60% of the weight from one trial that had many more dropouts in the higher omega‐6 arm (Veterans Admin 1969)).
3.2. Analysis.
Comparison 3 Tertiary outcomes ‐ higher omega‐6 vs lower omega‐6, Outcome 2 Dropouts.
Adverse and other potential health effects
Effects of omega‐6 fats on dementia and neurocognitive outcomes (Jimoh 2017), type 2 diabetes and measures of glucose metabolism (Brown 2017), inflammatory bowel disease and inflammatory markers (Thorpe 2017), cancers (Hanson 2017b), depression and anxiety (Hanson 2017a), and functional outcomes (Abdelhamid 2017) are systematically reviewed elsewhere, so we do not report the results of effects seen in studies included in this review (as they are potentially misleading). The systematic reviews on these health outcomes are not yet published, so references are provided to the protocols so the systematic reviews can be located.
We found limited data on multiple sclerosis progress and pulmonary embolism. Two trials reported only seven cases of pulmonary embolism, so that effects of omega‐6 fats were unclear (RR 2.15, 95% CI 0.48 to 9.57, I2 = 0%, Analysis 3.3). Two trials reported risk of worsening multiple sclerosis or an acute attack, with a suggestion of increased risk of worsening MS with GLA supplementation (RR 1.11, 95% CI 0.95 to 1.30, 142 events in 2 trials, I2 = 0%, Analysis 3.3), although the confidence intervals were very wide.
3.3. Analysis.
Comparison 3 Tertiary outcomes ‐ higher omega‐6 vs lower omega‐6, Outcome 3 Other serious adverse events.
Discussion
Summary of main results
We included 19 RCTs in 6461 randomised participants followed up for one to eight years in this Cochrane Review. We identified one ongoing trial. Seven trials assessed effects of small quantities of GLA as supplements, while 12 assessed effects of larger versus smaller quantities of dietary LA, usually displacing SFA or MUFA in the diet. We judged three studies to be at low summary risk of bias. We found that increasing omega‐6 fats may make little or no difference to all‐cause mortality or CVD events, but evidence for both outcomes was of low quality. We are uncertain whether increasing omega‐6 fats affects risk of CVD mortality, CHD events, MACCEs or stroke, as evidence for all of these outcomes was of very low quality.
For secondary outcomes we found that increasing omega‐6 fats may reduce risk of myocardial infarction, but we are uncertain whether increasing omega‐6 fat affects risk of angina, sudden cardiac death, heart failure, revascularisation or PAD (all very low‐quality evidence). We found no data on arrhythmia.
High‐quality evidence suggests that increasing omega‐6 fats reduces total serum cholesterol by 6% over at least one year, and this effect was consistent in sensitivity analysis including only trials at low summary risk of bias. Increasing omega‐6 fats probably has little or no effect on body mass index (moderate‐quality evidence), and may make little or no difference to triglycerides, HDL or LDL cholesterol (low‐quality evidence).
We found limited information on blood pressure, quality of life, economic outcomes and adverse health effects. Effects of omega‐6 fats on serious adverse health effects (cancers, inflammatory bowel disease, depression or anxiety, neurocognitive outcomes, functional outcomes and diabetes) are reported elsewhere.
Overall completeness and applicability of evidence
Included trials randomised 6461 participants for at least a year. Participants were men and women aged from their 20s into their 80s, but the median mean age was 50 years old. While we included 6 trials in men, 10 in both men and women, and 2 in mostly women (1 trial did not report participant gender), most deaths (703/740) and CVD events (1377/1404) occurred in the trials of men, so it is not clear whether any effects also apply to women. Similarly, while younger adults are included, most events occurred in older adults, which partly explains the lack of appearance of some studies of younger adults in many of the analyses on health events. We included these trials because they reported data on lipids and/or adiposity and sometimes one or two health events.
Two included trials were from lower middle‐income countries (Mendis 2001 from Sri Lanka and Vijayakumar 2014 from India), but while both provided data on lipids, the only events were two deaths in Vijayakumar 2014. This means that the bulk of the information in this review is from high‐income countries, and much of it from trials carried out 30 to 50 years ago.
Participants were at low CVD risk in 11 trials (they were recruited for living in mental hospital or veterans accomodation, having multiple sclerosis, rheumatoid arthritis or breast cysts, having had cancer or lost weight or simply being healthy), had diabetes in three trials (moderate CVD risk) or had existing CVD in five trials, so results relate to both primary and secondary prevention of CVD. However, most events occurred in those with existing CVD.
We are aware of a missing study – we were unable to access data for Chandrakala 2010, which is completed but unpublished (see Characteristics of ongoing studies). We are also aware of some missing data within included studies – for example there were deaths in Bates 1977, but they were reported combined with dropouts, and the author no longer has the data. Houtsmuller 1979 reported CHD events and mortality, but not all‐cause deaths or CVD events. Black 1994,MRC 1968,NDHS Faribault 1968,NDHS Open 1st 1968 and Schirmer 2007 each reported at least one continuous outcome without variance data (so we missed at least one set of data on total cholesterol, two sets on blood pressure and triglycerides, four sets on weight), and Dullart 1992 provided total cholesterol and LDL data that were too different between study arms at baseline to use (with no change data). On the other hand, we were provided the full dataset on events for DART 1989, so we were able to include data for almost all of our outcomes. Data for Sydney Diet‐Heart 1978 were also well reported in recent re‐analyses, and the authors kindly augmented these data, and outcome data in Veterans Admin 1969 were very well reported, so data are probably almost complete for these trials.
We have included trials of LA and GLA, but other omega‐6 fats such as DGLA or AA do not appear to have been tested in RCTs lasting at least one year. We have gathered some information on effects of LA on mortality, CVD events, lipids and adiposity, but we have limited data on both LA and GLA for dichotomous outcomes such as all‐cause mortality. Data on effects of GLA on CVD mortality, CVD events, and CHD events are almost entirely absent. DGLA and AA can be synthesised from LA, although conversion may be minimal. DGLA is not part of the diet (it is present only following metabolism), but AA is a dietary component. Trials of increasing LA will presumably also increase availability of DGLA and AA, even if only a small amount, so trials of DGLA and AA may be unnecessary.
In this review, we aimed to assess effects of omega‐6 fats on CVD outcomes. Because omega‐6 fats are an essential nutrient for humans (we all eat it already), it would be useful to understand whether increasing omega‐6 fats in people who eat very little has the same effect as increasing omega‐6 fats in people already consuming large amounts. Unfortunately, only 7 of the 17 included trials reported baseline omega‐6 or PUFA intake, so our understanding of this aspect is limited. That said, across outcomes there is a suggestion of benefit from increasing omega‐6 fats where baseline omega‐6 fat intake is below 5% E, and this effect is lost where omega‐6 fat intake is at least 5% E (seen in subgroup analyses for baseline omega‐6 fat intake for all primary outcomes, including all‐cause mortality, CVD mortality , CVD events, CHD events, MACCEs and stroke). We also subgrouped by baseline omega‐6 intake for serum total cholesterol, finding greater cholesterol reductions where baseline omega‐6 fats were below 5% E but also seeing reductions, though smaller ones, in populations with higher omega‐6 fats at baseline. We carried out meta‐regression to assess effects of omega‐6 fat intake at baseline on primary outcomes with at least seven included trials. We did not see any suggested effects for all‐cause mortality, CVD mortality, CVD events or CHD events (other outcomes included too few trials), but as there were only seven trials in most of these data sets, and some included trials didn't provide omega‐6 fat intake at baseline, our power to see any effects was extremely low. Future trials should evaluate this relationship.
Another key question relates to trans fat intake. It is possible that in trying to increase omega‐6 fat intake, some trials may have increased intake of hydrogenated vegetable oils high in trans fats. Trans fats are associated with increased risk of CVD (De Souza 2015), so that we may see increases in CVD due to increased trans fat intake, balanced against any underlying benefits of omega‐6 fats. Unfortunately, none of the included trials provided data on trans fats. Some trials clearly did not increase trans fats in the higher omega‐6 fat arms, as they specifically provided liquid oils (e.g. MRC 1968; Rose 1965), but these were unpalatable to participants, and later trials altered their interventions to provide other products or advice to increase omega‐6 fat intake. These studies provide little detail on types of fats taken by participants advised to increase their omega‐6 fat intake – in at least some of these, trans fats may have been substantially increased in higher omega‐6 fat arms, which may confound our understanding of the effects of increasing omega‐6 fats.
Overall, included data are highly applicable but not entirely complete. At present the dataset of RCTs appears to be underpowered for truly understanding the health effects of omega‐6 fats. We suggest that further large, long duration, high‐quality trials of LA are needed, particularly in women and in countries across income brackets to help clarify the health effects of omega‐6 fats. These trials should include participants with low omega‐6 intake at baseline, as well as those with higher intake. Dietary advice needs to ensure that trans fat intake is kept low as omega‐6 fats increase, and omega‐6 fat adherence and trans fat intakes should be checked using biomarkers.
Quality of the evidence
GRADE assessment includes consideration of risk of bias, inconsistency, indirectness, publication bias and imprecision (Table 1; Table 2).
We assessed risk of bias by assessing whether effect sizes altered in sensitivity analyses when limited to studies at low summary risk of bias, those with trials registry entries, those without commercial funding, with low risk from attention bias and larger trials. We defined supplement studies as being at low summary risk of bias where we considered randomisation, allocation concealment, blinding of participants and personnel, and blinding of outcome assessors to be adequate. We defined dietary advice and diet provision trials as being at low summary risk of bias where we considered randomisation, allocation concealment and blinding of outcome assessors to be adequate.
We assessed only 3 of 19 included trials as being at low summary risk of bias (NDHS Faribault 1968; NDHS Open 1st 1968; Sydney Diet‐Heart 1978). These were all dietary advice trials, and we judged randomisation, allocation concealment and compliance to be adequate. As poorly concealed allocation has been associated with a 40% greater effect size (Schultz 1995), this is particularly important for assessing risk of bias. Four included trials were at low risk of bias from allocation concealment (Dullart 1992; NDHS Faribault 1968; NDHS Open 1st 1968; Sydney Diet‐Heart 1978), but most were at unclear risk despite our enquiring about the method of randomisation in some detail of all authors we were able to contact. We downgraded all dichotomous primary and secondary outcomes for risk of bias, as sensitivity analyses limited to these trials tended to suggest that increasing omega‐6 fats increased the risk of mortality and CVD events, unlike the main analyses, or there were very few if any events in trials at low summary risk of bias.
We judged imprecision by whether the 95% CI in the main analysis crossed the null, randomised at least 4000 participants (as suggested by Schünemann 2013), and whether the 95% CI included important benefits and harms. Where the 95% CI crossed the null we downgraded. Despite there being large numbers of participants randomised in primary outcomes, confidence intervals were often wide, suggesting that included studies may still be underpowered to determine effectiveness on these outcomes. Further studies of effects of omega‐6 fats on mortality and CVD outcomes are needed.
We assessed inconsistency using I2 for each primary and secondary outcome. We considered I2 values of more than 60% to be a problem and downgraded for inconsistency unless we found an element that explained that inconsistency (through subgroup analysis or meta‐regression). We downgraded the primary outcomes of CVD mortality, CHD events and MACCEs, along with the secondary outcomes of angina and serum triglycerides, for this reason.
We assessed indirectness according to whether data on an outcome related to women and men, those with and without CVD at baseline, and whether low‐, middle‐ and high‐income countries were represented. While indirectness is important, we suspect that the mechanisms of action of omega‐6 fats are similar in men and women, and those with and without CVD at baseline, and in different countries Information on indirectness is reported in the summary of findings tables, but we did not downgrade for this factor.
We judged publication bias according to whether there was any suggestion of publication or small study bias in the funnel plot, or where we knew that data were missing that differed from the summary assessment (where we included fewer than 10 trials). We downgraded evidence for body weight alone for publication bias.
Study funding can be an important indicator of study bias, but we did not include it in the 'Risk of bias' assessment. Funding appeared to be from only national or charitable agencies in eight trials, and from mixed charitable or national sources with some commercial products or funds provided in a further five trials. Three trials reported only commercial sources: GLAMT 1993, which reported only one MI, one CHD event and one CVD event; McIllmurray 1987, with 22 deaths and with no data on CVD events; and Schirmer 2007, which provided data on adiposity only. As data from these studies were very limited, they were unlikely to have biased results greatly, though omission of data from other outcomes could have. Rose 1965 did not mention funding.
Trial pre‐registration or early publication of a study protocol is helpful in understanding potential biases in data presentation (including outcome selection bias). We ran sensitivity analyses assessing whether trials that were pre‐registered or had a published protocol suggested different effects than trials without such documentation. Unfortunately, we did not find a trials registry entry or pre‐published protocol for any of our included trials (most were published before the availability of trials registers). Pre‐registration would be helpful for future trials, helping ensure that important outcomes are published regardless of direction of effect or statistical significance. Making datasets of all outcomes available via trials registers would also help systematic reviewers to gather all appropriate data, minimising publication bias.
A particular issue for dietary trials (the LA trials in this review) is adherence. Where we see little effect on key outcomes, all‐cause mortality and CVD events, we need to consider whether this is due to omega‐6 fats not having any effect on these outcomes, or to participants not actually increasing their omega‐6 fat intake substantially following dietary advice. Dietary trials often assess adherence by asking participants what they are eating, but this may be subject to participant exaggeration or wanting to believe that they are indeed following advice provided. Objective biomarkers such as serum total cholesterol or fatty acid tissue markers are more conclusive (Sacks 2017). We assessed adherence in included trials and found that five trials showed statistically significant reductions in serum total cholesterol in the higher omega‐6 fat arm compared to the lower omega‐6 fat arm (DART 1989; Houtsmuller 1979; NDHS Faribault 1968; NDHS Open 1st 1968; Sydney Diet‐Heart 1978). Four studies did not show a statistically significant effect on total cholesterol (Mendis 2001; Rose 1965; Veterans Admin 1969; Vijayakumar 2014) and one did not provide any variance data (so statistical significance was not clear; MRC 1968, Analysis 2.17). Other trials assessed change in tissue fatty acids, finding significant changes in higher omega‐6 arms compared to the lower omega‐6 fat arms (Black 1994; Schirmer 2007), or lack of any statistically significant difference in these markers (Bates 1978; Dullart 1992), while others provided no biomarker data for compliance (Bates 1977; GLAMT 1993; McIllmurray 1987). Although biomarkers are not perfect markers of compliance (the degree of total cholesterol change will depend on whether omega‐6 fats are replacing saturated or monounsaturated fats, or other dietary components, for example) the lack of change in biomarkers in some studies highlights the difficulty of interpreting this limited dataset and the possibility that we are not seeing health effects because omega‐6 fats did not alter much in some studies.
Applying the GRADE criteria suggests that we have high‐quality evidence on effects of omega‐6 fats on serum total cholesterol (not downgraded), moderate‐quality evidence on BMI (downgraded once), and low‐quality evidence for all‐cause mortality and CVD events, myocardial infarction, TG, HDL and and LDL (each downgraded for risk of bias and imprecision). All other evidence was of very low quality. We present justifications for grading and statements of findings based on these levels in Table 1 and Table 2.
Potential biases in the review process
We performed a comprehensive search across major databases for interventions involving increased omega‐6 fat intake for this review update. In addition, we checked reference lists of all primary studies and relevant systematic and non‐systematic reviews for additional references. While we may have missed trials, we believe that we have included most of the larger studies, including some we missed in the original version of this review (Al‐Khudairy 2015).
Two review authors independently performed all screening, inclusion and exclusion determination, data extraction and assessment of risk of bias. We contacted authors of all included studies to ask for information on all relevant outcomes and methodology related to risk of bias. We conducted sensitivity analyses to check whether the outcomes were stable to a range of quality assessments.
We conducted a large number of sensitivity and subgroup analyses for each primary outcome, as well as some secondary outcomes. The danger in these is that statistical significance may be spurious in subgroups, but rather than be informed by effects in small subgroups we assessed whether there were statistically significant differences between subgroups. We also looked for dose‐response and duration effects using meta‐regression. We have tried not to over‐interpret these analyses.
We only considered trials with interventions or follow‐up periods of 12 months or more, which makes the studies relevant for public health interventions. We considered including shorter studies, but we were concerned that if we found little or no effect then this might be due to including studies too short to reflect any effects of the omega‐6 fat intervention. The decision on duration depends on the assumed mechanism of action of omega‐6 fats. If we assume a cholesterol‐led atherosclerotic mechanism, then we could justify deciding to include only studies of at least two years (as in Hooper 2015; Sacks 2017). However, another mechanism discussed for omega‐3 and omega‐6 fats is inflammation – likely to work more quickly than atherosclerosis, so allowing six months for equilibration of body tissues with the new dietary intake, and a further six months to allow for reflection of this new status in health outcomes, appears appropriate to us. We hope this compromise is a reasonable balance between excluding useful studies and including unhelpful ones. We ran subgroup analyses to assess whether study duration made an important difference to our primary outcomes. We did not find any suggestion of greater effects in longer trials (those of at least 4 years) compared to shorter trials (1 to < 2 years, or 2 to < 4 years) for all‐cause mortality or CVD mortality. There may arguably be slightly greater protective effects in longer trials for CVD events, CHD events, MACCEs and stroke, but meta‐regression did not confirm this. Trials of 1 to < 2 years contributed few or no data to primary outcomes so would be unlikely to dilute any effects in longer trials. There were only important differences between duration subgroups for MACCEs and stroke. This suggests we need more longer trials and that carrying out more short trials, or adding trials of less than one year duration to this review, would be unhelpful.
Within the review we have combined data on GLA and LA (apart from in subgroup analyses), which may be inappropriate. LA is an essential fat available from a variety of dietary fats and oils (Sacks 2017), while GLA has to be provided by supplemental capsules in trials, so their effects could be distinct. However, data on GLA are very limited, so they probably neither substantially add to nor detract from the LA data.
Agreements and disagreements with other studies or reviews
This update has built on the findings of the previous version of this review (Al‐Khudairy 2015), which included five comparisons randomising 660 participants each for 24 weeks. This version included no studies reporting CVD outcomes, and effects of omega‐6 fats on lipids, blood pressure, diabetes or adverse events were unclear. This update excluded all of these trials (as they were all of less than one year duration) and included 17 more, many of which did assess mortality and/or CVD events. This updated review includes a much greater volume of data (more studies, more participants, longer term and larger studies), though there are still limited numbers of studies and of our primary outcome events.
A review of highly controlled (metabolic‐type) trials found that replacement of saturated fats with cis‐PUFAs (which the authors considered equivalent to omega‐6 fats) significantly reduced total cholesterol levels (estimated regression coefficient for mean change, −0.066 mmol/L per 1% E replaced, 95% CI −0.073 to −0.060, Mensink 2016). Replacing carbohydrates and monounsaturated fats also resulted in reductions in total cholesterol, but smaller reductions (−0.019 mmol/L per 1% E from carbohydrates replaced, 95% CI −0.025 to −0.013, and −0.016 mmol/L per 1% E MUFA replaced, 95% CI −0.022 to −0.011). This careful analysis confirmed earlier findings using the same methodology (Mensink 2003). This analysis of highly controlled trials also found that replacing SFA, MUFA and carbohydrates with cis‐omega‐6 fats reduced LDL cholesterol (−0.058 mmol/L per 1% E from SFA replaced, 95% CI −0.064 to −0.052 with smaller effects when MUFA and carbohydrates are replaced), HDL cholesterol (−0.005 mmol/L per 1% E from SFA replaced, 95% CI −0.007 to −0.004 with smaller effects when MUFA are replaced, and opposite effects when carbohydrates are replaced) and triglycerides (−0.010 mmol/L per 1% E from SFA replaced, 95% CI −0.014 to −0.006 with smaller effects when MUFA are replaced, and larger effects when carbohydrates are replaced). This confirms our findings of reduced serum total cholesterol with increased omega‐6 fats and suggests that we were underpowered to see effects on other lipids (in our less highly controlled trial environments over much longer durations we didn't see changes in TG, LDL or HDL). Effects clearly depend on which dietary elements omega‐6 fats are replacing in the diet, and this is probably responsible for some of the heterogeneity between studies assessing effects on triglycerides and lack of effect on LDL.
A meta‐analysis of cohort studies that examined associations between LA intake and CHD outcomes (myocardial infarction, ischaemic heart disease, coronary artery bypass graft, sudden cardiac arrest, acute coronary syndrome, and CHD deaths) found an inverse dose‐response association between dietary LA intake and CHD risk (Farvid 2014). Observational studies are at greater risk of confounding from a variety of lifestyle factors, though they are often larger and of longer duration than trials. The Farvid 2014 analysis agreed with this reviews' suggested reduction in risk of myocardial infarction with increased omega‐6 fats, but we did not see any effect of omega‐6 fat intake on CHD or CVD events. A recent meta‐analysis of 20 cohort studies has suggested that higher LA in body tissues was associated with reduced diabetes risk (Wu 2017), but we did not assess diabetes risk in this review (as Brown 2017 assesses it in part of this review series).
A systematic review of RCTs increasing omega‐6 fats, Ramsden 2010, found no significant effects on all‐cause mortality (RR 1.16, 95%CI 0.95 to 1.42), non‐fatal MI (RR 1.03, 95% CI 0.62 to 1.73), CHD death (RR 1.17, 95% CI 0.82 to 1.68) or CVD events RR 1.13, 95% CI 0.84 to 1.53), and these results have not altered substantially in their most recent update of the review (Ramsden 2016). A recent review of systematic reviews and presidential advisory from the American Heart Association found that increasing LA to replace saturated fats in the diet significantly reduced CVD outcomes (Sacks 2017). Sacks 2017 combined data from four key trials (MRC 1968; Veterans Admin 1969; Finnish Mental Hosp 1972; Oslo Diet Heart 1966) comparing high PUFA diets with high saturated fat diets, controlled diets over at least two years, proved adherence using biomarkers such as tissue lipids or serum cholesterol, collected and validated CVD outcomes of some type, and limited trans fat differences between arms. We included only two of their four key trials (MRC 1968; Veterans Admin 1969), excluding Oslo Diet Heart 1966 as it increased both omega‐3 and omega‐6 fats and included a multivitamin in the intervention group (so was multifactorial), and Finnish Mental Hosp 1972 as it was a cluster‐randomised trial, with only two clusters (and used a cross‐over approach inappropriate for outcomes that develop over time such as CVD). Both trials we excluded reported statistically significant reductions in their primary outcomes. Sacks 2017 took the unusual step of meta‐analysing only the primary outcome of each trial (using a different outcome for each trial). They state that this reduces outcome selection bias as they used pre‐specified primary outcomes, but as none of these trials pre‐published protocols, their published composite primary outcomes may have already experienced outcome selection bias (Chan 2004a; Chan 2004b). Our review avoided selection bias by assessing effects over a wide selection of prespecified outcomes. Combining these diverse outcomes for these four trials, Sacks 2017 found that CVD events were reduced by 29% (RR 0.71, 95% CI 0.62 to 0.81, I2 = 20%, with 60% of the weight of the analysis coming from the two studies we excluded). This Cochrane Review concurs with Sacks 2017 in seeing reductions in serum total cholesterol where omega‐6 fats replace saturated fats. We did not subgroup by replacement for secondary outcomes like myocardial infarction. We found little or no effect of increasing omega‐6 fats at the expense of saturated fats (when subgrouping for replacement) for all‐cause mortality or CVD mortality. We did see the suggestion of protection against CVD events, CHD events and MACCEs when assessing effects of omega‐6 fats replacing saturated fats. However, all of these analyses would be downgraded for risk of bias and imprecision (as a minimum), so evidence would be of low quality at best.
We recently published a Cochrane Review of long‐term RCTs that assessed effects of reducing saturated fats, replacing them with a variety of other energy sources (Hooper 2015). This review found little or no effect of reducing saturated fats on all‐cause mortality or CVD mortality, but the evidence suggested that reducing saturated fats reduced the risk of CVD events (RR 0.83, 95% CI 0.72 to 0.96, I2 = 65%, including 4377 events in over 53,000 randomised participants). Subgroup analyses assessing whether the saturated fats were being replaced by PUFA, MUFA, carbohydrates and/or protein found that only where PUFA was replacing SFA did this protection occur (RR 0.73, 95% CI 0.58 to 0.92, I2 = 69%, 884 events in over 3000 participants). The trials included in the saturated fat review and this one are distinct due to rather different inclusion criteria (for example, the saturated fat review only included trials of at least two years' duration and included trials with dietary interventions of increased saturated fat plus other dietary variables). The implications of the reviews are different, but related: Hooper 2015 and Sacks 2017 suggest that reducing saturated fat and replacement by polyunsaturated fats reduces the risk of CVD events, while the present review suggests that increasing omega‐6 fats may reduce the risk of myocardial infarction, but we did not find evidence of an effect on CVD events.
Authors' conclusions
Implications for practice.
We found that increasing omega‐6 fats may reduce risk of myocardial infarction (low‐quality evidence), but 53 people would need to increase the amount of omega‐6 fat in their diet to prevent one person having a myocardial infarction (NNTB 53, 95% CI −334 to 28). Increasing omega‐6 fats may make little or no difference to all‐cause mortality or CVD events (low‐quality evidence), and we are uncertain of effects on CVD mortality, coronary heart disease, MACCEs and stroke (very low‐quality evidence). Overall the evidence is limited by low numbers of events (data are imprecise), and risk of bias of included studies. Increasing omega‐6 fats does reduce serum total cholesterol in the long term, so increasing omega‐6 fats at the expense of saturated or monounsaturated fats will support lower serum cholesterol (high‐quality evidence).
In spite of its limitations, the weak evidence we collected in this review appears to suggest that omega‐6 fats are not harmful. There is no evidence for increasing omega‐6 fats to reduce cardiovascular outcomes other than myocardial infarction. Although the potential benefit of omega‐6 fats in reducing myocardial infarction remains to be proven, increasing omega‐6 fats may be of benefit in patients with high risk of MI.
Implications for research.
While we have included 19 trials in 6461 participants, there is a need for further large trials of LA of at least five years' duration that are well randomised, with good allocation concealment, well masked with pre‐published trials registry entries. These large trials should assess baseline omega‐6 fat intake and include participants with low omega‐6 intakes at baseline, as well as those with higher intakes. Trials are needed particularly in women and in low‐ and middle‐income countries as well as in high‐income countries. Dietary advice needs to ensure that trans fat intake is kept low as omega‐6 fats increase, and omega‐6 fat compliance and trans fat status should be checked using biomarkers. These trials need to assess effects of increasing dietary omega‐6 fats (not supplements) in place of saturated or monounsaturated fats and report important adverse outcomes such as mortality and CVD events (including coronary heart disease and stroke), plus potential harms such as cancers, inflammatory bowel disease (IBD), diabetes, functional outcomes, depression and dementia.
What's new
| Date | Event | Description |
|---|---|---|
| 26 November 2018 | New citation required but conclusions have not changed | Clarified methodology on interpretation of effects (no re‐interpretation of outcomes was needed) and corrected study flow. |
| 26 November 2018 | Amended | Amendments made in methods section and study flow diagram/text. |
History
Protocol first published: Issue 5, 2014 Review first published: Issue 11, 2015
| Date | Event | Description |
|---|---|---|
| 5 December 2017 | New search has been performed | For the update from Al‐Khudairy 2015, we have introduced some changes, broadening the review to fit with the request of the World Health Organization (WHO) Nutrition Guidance Expert Advisory Group (NUGAG) Subgroup on Diet and Health, who requested the update.
|
| 5 December 2017 | New citation required and conclusions have changed | The earlier review found no studies examining the effects of either increased or decreased omega‐6 fats on our primary clinical outcomes for cardiovascular disease. For this update we included 19 randomised controlled trials in 6461 participants over 1 to 8 years. We have now included studies reporting all‐cause mortality, cardiovascular deaths and events, coronary heart disease events, major adverse cardiac and cerebrovascular events, and stroke. We have also updated data on long‐term effects of omega‐6 fats on lipids and adiposity, and we have added data on individual cardiovascular events (all secondary outcomes). |
Acknowledgements
We are grateful to Charlene Bridges for conducting the literature searches for this Cochrane Review, and to Louise Hartley, Christine Clar and Nadine Flowers who were co‐authors of the first version of this review but were unable to participate in the update. Thank you to all the study authors who responded to our queries and provided additional methodological and/or outcome data where able: David Bates (University of Newcastle upon Tyne) and Robert Dworkin (University of Rochester School of Medicine and Dentistry, NY; Bates 1977; Bates 1978); JJF Belch (University Department of Medicine, Glasgow; Belch 1988); Homer S Black (Baylor College of Medicine; Black 1994); Michael Burr (retired, University of Wales College of Medicine) and Andrew Ness (University of Bristol) (DART 1989); RPF Dullaart (University Hospital Groningen; Dullart 1992); Malcolm McIllmurray (retired; McIllmurray 1987; JA Heady (retired, MRC Social Medicine Research Unit; MRC 1968); Daisy Zamora (School of Medicine, University of North Carolina), Chris Ramsden (National Institute on Alcohol Abuse and Alcoholism, National Institutes of Health, Bethesda, USA) and Boonseng Leelarthaepin (retired) Sydney Diet‐Heart 1978); Maniyal Vijayakumar (Amrita Institute of Medical Sciences, Kochi, India; Vijayakumar 2014).
The authors wrote this publication on behalf of the Polyunsaturated Fats and Health (PUFAH) group. The PUFAH group includes Asmaa Abdelhamid1, Zoya Ahmed1, Sarah MA Ajabnoor1,2, Fai K AlAbdulghafoor1, Lena Al‐Khudairy3, Priti Biswas4, Julii Suzanne Brainard1, Charlene Bridges5, Tracey J Brown1, Katherine HO Deane4, Daisy H Donaldson1, Sarah Hanson4, Lee Hooper1, Oluseyi F Jimoh1, Nicole Martin5, Helen J Moore6, Alex T O'Brien1, Lorena Pacheco7, Karen Rees3, Fujian Song1, Carolyn D Summerbell6, Gabrielle C Thorpe4, Xia Wang1, Ailsa Welch1, Lauren Winstanley1, and Helen V Worthington8.
1Norwich Medical School, University of East Anglia. 2Clinical Nutrition Department, Faculty of Applied Medical Sciences, King Abdulaziz University, KSA. 3Warwick Medical School, University of Warwick. 4School of Health Sciences, University of East Anglia. 5Cochrane Heart Group, University College London. 6Durham University. 7University of California, San Diego. 8School of Dentistry, University of Manchester.
Appendices
Appendix 1. Search strategies for the original version of this review
The Cochrane Library
#1MeSH descriptor: (Fatty Acids, Omega‐6) this term only #2"omega 6" #3(n‐6 near/4 acid*) #4("n 6" near/4 acid*) #5omega‐6 #6"linoleic acid*" #7(poly* near/4 unsat* near/4 fatty acid*) #8PUFA #9MeSH descriptor: (Dietary Fats, Unsaturated) this term only #10MeSH descriptor: (Corn Oil) this term only #11((corn or maize or mazola) near/4 oil*) #12maydol #13lipomul* #14MeSH descriptor: (Cottonseed Oil) this term only #15cottonseed* #16"cotton seed*" #17MeSH descriptor: (Soybean Oil) this term only #18intralipid or nutrilipid #19((soy bean or soybean) near/4 (oil* or fat* or sauce*)) #20(so?a near/4 oil*) #21so?aoil* #22(soy near/4 oil*) #23soyacal or travamulsion #24(sunflower near/4 oil*) #25helianth* #26MeSH descriptor: (Safflower Oil) this term only #27(safflower near/4 oil*) .tw. #28liposyn #29(grapeseed near/4 oil*) #30#1 or #2 or #3 or #4 or #5 or #6 or #7 or #8 or #9 or #10 or #11 or #12 or #13 or #14 or #15 or #16 or #17 or #18 or #19 or #20 or #21 or #22 or #23 or #24 or #25 or #26 or #27 or #28 or #29 #31MeSH descriptor: (Cardiovascular Diseases) explode all trees #32cardio* #33cardia* #34heart* #35coronary* #36angina* #37ventric* #38myocard* #39pericard* #40isch?em* #41emboli* #42arrhythmi* #43thrombo* #44atrial next fibrillat* #45tachycardi* #46endocardi* #47(sick next sinus) #48MeSH descriptor: (Stroke) explode all trees #49(stroke or stokes) #50cerebrovasc* #51cerebral next vascular #52apoplexy #53(brain near/2 accident*) #54((brain* or cerebral or lacunar) near/2 infarct*) #55MeSH descriptor: (Hypertension) explode all trees #56hypertensi* #57(peripheral next arter* next disease*) #58((high or increased or elevated) near/2 blood pressure) #59MeSH descriptor: (Hyperlipidemias) explode all trees #60hyperlipid* #61hyperlip?emia* #62hypercholesterol* #63hypercholester?emia* #64hyperlipoprotein?emia* #65hypertriglycerid?emia* #66MeSH descriptor: (Arteriosclerosis) explode all trees #67MeSH descriptor: (Cholesterol) explode all trees #68cholesterol #69"coronary risk factor*" #70MeSH descriptor: (Blood Pressure) this term only #71"blood pressure" #72#31 or #32 or #33 or #34 or #35 or #36 or #37 or #38 or #39 or #40 or #41 or #42 or #43 or #44 or #45 or #46 or #47 or #48 or #49 or #50 or #51 or #52 or #53 or #54 or #55 or #56 or #57 or #58 or #59 or #60 or #61 or #62 or #63 or #64 or #65 or #66 or #67 or #68 or #69 or #70 or #71 #73#30 and #72
MEDLINE
1. Fatty Acids, Omega‐6/ 2. omega 6.tw. 3. (n‐6 adj4 acid*).tw. 4. (n 6 adj4 acid*).tw. 5. omega‐6.tw. 6. linoleic acid*.tw. 7. (poly* adj4 unsat* adj4 fatty acid*).tw. 8. PUFA.tw. 9. Dietary Fats, Unsaturated/ 10. corn oil/ 11. ((corn or maize or mazola) adj4 oil*).tw. 12. maydol.tw. 13. lipomul*.tw. 14. cottonseed oil/ 15. cottonseed*.tw. 16. cotton seed*.tw. 17. soybean oil/ 18. intralipid.tw. 19. nutrilipid.tw. 20. ((soy bean or soybean) adj4 (oil* or fat* or sauce*)).tw. 21. (so?a adj4 oil*).tw. 22. so?aoil*.tw. 23. (soy adj4 oil*).tw. 24. soyacal.tw. 25. travamulsion.tw. 26. (sunflower adj4 oil*).tw. 27. helianth*.tw. 28. Safflower Oil/ 29. (safflower adj4 oil*).tw. 30. liposyn.tw. 31. (grapeseed adj4 oil*).tw. 32. or/1‐31 33. exp Cardiovascular Diseases/ 34. cardio*.tw. 35. cardia*.tw. 36. heart*.tw. 37. coronary*.tw. 38. angina*.tw. 39. ventric*.tw. 40. myocard*.tw. 41. pericard*.tw. 42. isch?em*.tw. 43. emboli*.tw. 44. arrhythmi*.tw. 45. thrombo*.tw. 46. atrial fibrillat*.tw. 47. tachycardi*.tw. 48. endocardi*.tw. 49. (sick adj sinus).tw. 50. exp Stroke/ 51. (stroke or stokes).tw. 52. cerebrovasc*.tw. 53. cerebral vascular.tw. 54. apoplexy.tw. 55. (brain adj2 accident*).tw. 56. ((brain* or cerebral or lacunar) adj2 infarct*).tw. 57. exp Hypertension/ 58. hypertensi*.tw. 59. peripheral arter* disease*.tw. 60. ((high or increased or elevated) adj2 blood pressure).tw. 61. exp Hyperlipidemias/ 62. hyperlipid*.tw. 63. hyperlip?emia*.tw. 64. hypercholesterol*.tw. 65. hypercholester?emia*.tw. 66. hyperlipoprotein?emia*.tw. 67. hypertriglycerid?emia*.tw. 68. exp Arteriosclerosis/ 69. exp Cholesterol/ 70. cholesterol.tw. 71. "coronary risk factor* ".tw. 72. Blood Pressure/ 73. blood pressure.tw. 74. or/33‐73 75. 32 and 74 76. randomized controlled trial.pt. 77. controlled clinical trial.pt. 78. randomized.ab. 79. placebo.ab. 80. drug therapy.fs. 81. randomly.ab. 82. trial.ab. 83. groups.ab. 84. 76 or 77 or 78 or 79 or 80 or 81 or 82 or 83 85. exp animals/ not humans.sh. 86. 84 not 85 87. 75 and 86
EMBASE
1. omega 6 fatty acid/ 2. omega 6.tw. 3. (n‐6 adj4 acid*).tw. 4. (n 6 adj4 acid*).tw. 5. omega‐6.tw. 6. linoleic acid*.tw. 7. (poly* adj4 unsat* adj4 fatty acid*).tw. 8. PUFA.tw. 9. edible oil/ 10. corn oil/ 11. ((corn or maize or mazola) adj4 oil*).tw. 12. maydol.tw. 13. lipomul*.tw. 14. cotton seed oil/ 15. cottonseed*.tw. 16. cotton seed*.tw. 17. soybean oil/ 18. intralipid.tw. 19. nutrilipid.tw. 20. ((soy bean or soybean) adj4 (oil* or fat* or sauce*)).tw. 21. (so?a adj4 oil*).tw. 22. so?aoil*.tw. 23. (soy adj4 oil*).tw. 24. soyacal.tw. 25. travamulsion.tw. 26. sunflower oil/ 27. (sunflower adj4 oil*).tw. 28. helianth*.tw. 29. safflower oil/ 30. (safflower adj4 oil*).tw. 31. liposyn.tw. 32. (grapeseed adj4 oil*).tw. 33. or/1‐32 34. exp cardiovascular disease/ 35. cardio*.tw. 36. cardia*.tw. 37. heart*.tw. 38. coronary*.tw. 39. angina*.tw. 40. ventric*.tw. 41. myocard*.tw. 42. pericard*.tw. 43. isch?em*.tw. 44. emboli*.tw. 45. arrhythmi*.tw. 46. thrombo*.tw. 47. atrial fibrillat*.tw. 48. tachycardi*.tw. 49. endocardi*.tw. 50. (sick adj sinus).tw. 51. exp cerebrovascular disease/ 52. (stroke or stokes).tw. 53. cerebrovasc*.tw. 54. cerebral vascular.tw. 55. apoplexy.tw. 56. (brain adj2 accident*).tw. 57. ((brain* or cerebral or lacunar) adj2 infarct*).tw. 58. exp hypertension/ 59. hypertensi*.tw. 60. peripheral arter* disease*.tw. 61. ((high or increased or elevated) adj2 blood pressure).tw. 62. exp hyperlipidemia/ 63. hyperlipid*.tw. 64. hyperlip?emia*.tw. 65. hypercholesterol*.tw. 66. hypercholester?emia*.tw. 67. hyperlipoprotein?emia*.tw. 68. hypertriglycerid?emia*.tw. 69. exp Arteriosclerosis/ 70. exp Cholesterol/ 71. cholesterol.tw. 72. "coronary risk factor*".tw. 73. Blood Pressure/ 74. blood pressure.tw. 75. or/34‐74 76. 33 and 75 77. random$.tw. 78. factorial$.tw. 79. crossover$.tw. 80. cross over$.tw. 81. cross‐over$.tw. 82. placebo$.tw. 83. (doubl$ adj blind$).tw. 84. (singl$ adj blind$).tw. 85. assign$.tw. 86. allocat$.tw. 87. volunteer$.tw. 88. crossover procedure/ 89. double blind procedure/ 90. randomized controlled trial/ 91. single blind procedure/ 92. 77 or 78 or 79 or 80 or 81 or 82 or 83 or 84 or 85 or 86 or 87 or 88 or 89 or 90 or 91 93. (animal/ or nonhuman/) not human/ 94. 92 not 93 95. 76 and 94 96. limit 95 to embase
Web of Science
# 19 #18 AND #17 # 18 TS=(random* or blind* or allocat* or assign* or trial* or placebo* or crossover* or cross‐over*) # 17 #16 AND #8 # 16 #15 OR #14 OR #13 OR #12 OR #11 OR #10 OR #9 # 15 TS=(hyperlipid* OR hyperlip?emia* OR hypercholesterol* OR hypercholester?emia* OR hyperlipoprotein?emia* OR hypertriglycerid?emia*) # 14 TS=("high blood pressure") # 13 TS=(hypertensi* OR "peripheral arter* disease*") # 12 TS=(stroke OR stokes OR cerebrovasc* OR cerebral OR apoplexy OR (brain SAME accident*) OR (brain SAME infarct*)) # 11 TS=("atrial fibrillat*" OR tachycardi* OR endocardi*) # 10 TS=(pericard* OR isch?em* OR emboli* OR arrhythmi* OR thrombo*) # 9 TS=(cardio* OR cardia* OR heart* OR coronary* OR angina* OR ventric* OR myocard*) # 8 #7 OR #6 OR #5 OR #4 OR #3 OR #2 OR #1 # 7 TS=((grapeseed near/4 oil*)) # 6 TS=((safflower N4 oil*) or liposyn) # 5 TS=((sunflower N4 oil*) or helianth*) # 4 TS=(((soy bean or soybean) N4 (oil* or fat* or sauce*)) or (so?a N4 oil*) or intralipid or nutrilipid or so?aoil* or (soy near/4 oil*) or soyacal or travamulsion) # 3 TS=(cottonseed* or "cotton seed*") # 2 TS=(((corn or maize or mazola) N4 oil*) or maydol or lipomul*) # 1 TS=("omega 6" or "omega‐6" or (n‐6 N4 acid*) or ("n 6" N4 acid*) or "linoleic acid*" or (poly* N4 unsat* N4 fatty acid*) or PUFA)
Clinical trial registers
Omega 6 and Cardio*
Omega 6 and primary prevention OR risk AND Cardio*
Omega 6
Appendix 2. Search strategies for this update of the review
CENTRAL
#1 MeSH descriptor: (Fatty Acids, Essential) explode all trees
#2 MeSH descriptor: (Fatty Acids, Unsaturated) this term only
#3 ((polyunsaturat* or poly‐unsaturat*) near/3 fat*)
#4 (poly* adj4 unsat* near/4 fatty acid*)
#5 PUFA
#6 MeSH descriptor: (Fatty Acids, Omega‐6) explode all trees
#7 omega‐6
#8 (n‐6 near/4 acid*) or ("n 6" near/4 acid*)
#9 linoleic acid*
#10 MeSH descriptor: (Corn Oil) this term only
#11 MeSH descriptor: (Cottonseed Oil) this term only
#12 MeSH descriptor: (Olive Oil) this term only
#13 MeSH descriptor: (Safflower Oil) this term only
#14 MeSH descriptor: (Sesame Oil) this term only
#15 MeSH descriptor: (Soybean Oil) this term only
#16 ((corn or maize or mazola) near/4 oil*)
#17 (cottonseed* or (cotton next seed*))
#18 (olive near/4 oil*)
#19 (safflower near/4 oil*)
#20 (sesame near/4 oil*)
#21 ((soy bean or soybean) near/4 (oil* or fat*))
#22 (so?a near/4 oil*)
#23 so?aoil*
#24 (soy near/4 oil*)
#25 (sunflower near/4 oil*)
#26 helianth*
#27 (grapeseed near/4 oil*)
#28 (canola near/4 oil*)
#29 #1 or #2 or #3 or #4 or #5 or #6 or #7 or #8 or #9 or #10 or #11 or #12 or #13 or #14 or #15 or #16 or #17 or #18 or #19 or #20 or #21 or #22 or #23 or #24 or #25 or #26 or #27 or #28
MEDLINE Ovid
1. exp fatty acids, essential/
2. fatty acids, unsaturated/
3. ((polyunsaturat* or poly‐unsaturat*) adj3 fat*).ti,ab.
4. (poly* adj4 unsat* adj4 fatty acid*).ti,ab.
5. PUFA.ti,ab.
6. exp fatty acids, omega‐6/
7. omega‐6.ti,ab.
8. (n‐6 adj4 acid*).ti,ab.
9. linoleic acid*.ti,ab.
10. corn oil/ or cottonseed oil/ or olive oil/ or safflower oil/ or sesame oil/ or soybean oil/
11. ((corn or maize or mazola) adj4 oil*).ti,ab.
12. (cottonseed* or (cotton adj seed*)).ti,ab.
13. (olive adj4 oil*).ti,ab.
14. (safflower adj4 oil*).ti,ab.
15. (sesame adj4 oil*).ti,ab.
16. ((soy bean or soybean) adj4 (oil* or fat*)).ti,ab.
17. (so?a adj4 oil*).ti,ab.
18. so?aoil*.ti,ab.
19. (soy adj4 oil*).ti,ab.
20. (sunflower adj4 oil*).ti,ab.
21. helianth*.ti,ab.
22. (grapeseed adj4 oil*).ti,ab.
23. (canola adj4 oil*).ti,ab.
24. 1 or 2 or 3 or 4 or 5 or 6 or 7 or 8 or 9 or 10 or 11 or 12 or 13 or 14 or 15 or 16 or 17 or 18 or 19 or 20 or 21 or 22 or 23
25. randomized controlled trial.pt.
26. controlled clinical trial.pt.
27. randomized.ab.
28. placebo.ab.
29. clinical trials as topic.sh.
30. randomly.ab.
31. trial.ti.
32. 25 or 26 or 27 or 28 or 29 or 30 or 31
33. exp animals/ not humans.sh.
34. 32 not 33
35. 24 and 34
Embase Ovid
1. exp essential fatty acid/
2. unsaturated fatty acid/ or docosapentaenoic acid/ or omega 6 fatty acid/ or polyunsaturated fatty acid/
3. ((polyunsaturat* or poly‐unsaturat*) adj3 fat*).ti,ab.
4. (poly* adj4 unsat* adj4 fatty acid*).ti,ab.
5. PUFA.ti,ab.
6. omega‐6.ti,ab.
7. (n‐6 adj4 acid*).ti,ab.
8. linoleic acid*.ti,ab.
9. edible oil/ or canola oil/ or corn oil/ or cotton seed oil/ or olive oil/ or safflower oil/ or safflower oil plus soybean oil/ or sesame seed oil/ or soybean oil/ or sunflower oil/
10. ((corn or maize or mazola) adj4 oil*).ti,ab.
11. (cottonseed* or (cotton adj seed*)).ti,ab.
12. (olive adj4 oil*).ti,ab.
13. (safflower adj4 oil*).ti,ab.
14. (sesame adj4 oil*).ti,ab.
15. ((soy bean or soybean) adj4 (oil* or fat*)).ti,ab.
16. (so?a adj4 oil*).ti,ab.
17. so?aoil*.ti,ab.
18. (soy adj4 oil*).ti,ab.
19. (sunflower adj4 oil*).ti,ab.
20. helianth*.ti,ab.
21. (grapeseed adj4 oil*).ti,ab.
22. (canola adj4 oil*).ti,ab.
23. 1 or 2 or 3 or 4 or 5 or 6 or 7 or 8 or 9 or 10 or 11 or 12 or 13 or 14 or 15 or 16 or 17 or 18 or 19 or 20 or 21 or 22
24. double blind procedure/
25. single blind procedure/
26. randomized controlled trial/
27. ((double* or single*) adj blind*).ti,ab.
28. (random* or placebo*).ti,ab.
29. 24 or 25 or 26 or 27 or 28
30. (animal/ or nonhuman/) not human/
31. 29 not 30
32. 23 and 31
ClinicalTrials.gov and WHO International Clinical Trials Registry Platform
We searched ClinicalTrials.gov (www.ClinicalTrials.gov) and the WHO International Clinical Trials Registry Platform (ICTRP, www.who.int/ictrp/en) during September 2016:
(PUFA OR polyunsaturate* OR poly‐unsaturate* OR omega‐3 OR omega3 OR omega6 OR omega‐6 OR fish* OR marine* OR n‐3 OR n‐6 OR EPA OR DHA OR ALA OR linoleic* OR linolenic*) AND (fat* OR oil* OR supplement* OR capsule*)
Appendix 3. Studies excluded due to duration < 12 months
Excluded studies ‐ excluded due to duration of less than 12 months
Ahrén 2009
(CRSSTD: 2912017)
Ahrén B, Mari A, Fyfe CL, Tsofliou F, Sneddon AA, Wahle KW, et al. Effects of conjugated linoleic acid plus n‐3 polyunsaturated fatty acids on insulin secretion and estimated insulin sensitivity in men. European Journal of Clinical Nutrition 2009;63(6):778‐86. (CRSREF: 2912018)
Allman‐Farinelli 1999
(CRSSTD: 2912019)
Allman‐Farinelli MA, Hall D, Kingham K, Pang D, Petocz P, Favaloro EJ. Comparison of the effects of two low fat diets with different alpha‐linolenic:linoleic acid ratios on coagulation and fibrinolysis. Atherosclerosis 1999;142(1):159‐68. (CRSREF: 2912020)
Anderson 1957
(CRSSTD: 2912021)
Anderson JT, Grande F, Keys A. Essential fatty acids, degree of unsaturation, and effect of corn (maize) oil on the serum‐cholesterol level in man. Lancet 1957;272(6959):66‐8. (CRSREF: 2912022)
Angela Liou 2009
(CRSSTD: 2912023)
Angela Liou Y, Innis SM. Dietary linoleic acid has no effect on arachidonic acid, but increases n‐6 eicosadienoic acid, and lowers dihomo‐linolenic and eicosapentaenoic acid in plasma of adult men. Prostaglandins, Leukotrienes, and Essential Fatty Acids 2009;80(4):201‐6. (CRSREF: 2912024)
Bachmair 2012
(CRSSTD: 2912025)
Bachmair EM, Bots ML, Mennen LI, Kelder T, Evelo CT, Horgan GW, et al. Effect of supplementation with an 80:20 cis9,trans11 conjugated linoleic acid blend on the human platelet proteome. Molecular Nutrition & Food Research 2012;56(7):1148‐59. (CRSREF: 2912026)
Becker 1983
(CRSSTD: 2912027)
Becker N, Illingworth DR, Alaupovic P, Connor WE, Sundberg EE. Effects of saturated, monounsaturated, and omega‐6 polyunsaturated fatty acids on plasma lipids, lipoproteins, and apoproteins in humans. American Journal of Clinical Nutrition 1983;37(3):355‐60. (CRSREF: 2912028)
Belury 2009
(CRSSTD: 2912029)
Belury M, Collene A, Norris L, Asp M, Hsu J, Li D, et al. Comparison of dietary oils on criteria of metabolic syndrome in postmenopausal women: a randomized crossover clinical intervention study. Journal of Diabetes 2009;1:A34. (CRSREF: 2912030)
Benito 2001
(CRSSTD: 2912035)
Benito P, Nelson GJ, Kelley DS, Bartolini G, Schmidt PC, Simon V. The effect of conjugated linoleic acid on plasma lipoproteins and tissue fatty acid composition in humans. (Erratum appears in Lipids 2001 Aug;36(8):857). Lipids 2001;36(3):229‐36. (CRSREF: 2912036)
Bermejo 2012
(CRSSTD: 2912037)
Bermejo LM, Rodriguez‐Duran D, Lopez‐Plaza B, Zurita‐Rosa L, Palma‐Milla S, Weber TK, et al. Effects of a functional light cheese naturally enriched with CLA and omega‐3 improving blood lipid profile in overweight and obese people treatment. Clinical Nutrition, Supplement 2012;7(1):219. (CRSREF: 2912038)
Bjermo 2012
(CRSSTD: 2912039)
Bjermo H, Iggman D, Kullberg J, Dahlman I, Johansson L, Persson L, et al. Effects of n‐6 PUFAs compared with SFAs on liver fat, lipoproteins, and inflammation in abdominal obesity: a randomized controlled trial. American Journal of Clinical Nutrition 2012;95(5):1003‐12. (CRSREF: 2912040)
Blair 1993
(CRSSTD: 2912041)
Blair IA, Prakash C, Phillips MA, Dougherty RM, Iacono JM. Dietary modification of omega 6 fatty acid intake and its effect on urinary eicosanoid excretion. American Journal of Clinical Nutrition 1993;57(2):154‐60. (CRSREF: 2912042)
Boberg 1986
(CRSSTD: 2912043)
Boberg M, Vessby B, Selinus I. Effects of dietary supplementation with n‐6 and n‐3 long‐chain polyunsaturated fatty acids on serum lipoproteins and platelet function in hypertriglyceridaemic patients. Acta Medica Scandinavica 1986;220(2):153‐60. (CRSREF: 2912044)
Bonanome 1992
(CRSSTD: 2912045)
Bonanome A, Pagnan A, Biffanti S, Opportuno A, Sorgato F, Dorella M, et al. Effect of dietary monounsaturated and polyunsaturated fatty acids on the susceptibility of plasma low density lipoproteins to oxidative modification. Arteriosclerosis and Thrombosis 1992;12(4):529‐33. (CRSREF: 2912046)
Brady 2004
(CRSSTD: 2912049)
Brady LM, Lovegrove SS, Lesauvage SV, Gower BA, Minihane AM, Williams CM, et al. Increased n‐6 polyunsaturated fatty acids do not attenuate the effects of long‐chain n‐3 polyunsaturated fatty acids on insulin sensitivity or triacylglycerol reduction in Indian Asians. American Journal of Clinical Nutrition 2004;79(6):983‐91. (CRSREF: 2912050)
Bronsgeest‐Schoute 1979
(CRSSTD: 2912053)
Bronsgeest‐Schoute DC, Hermus RJ, Dallinga‐Thie GM, Hautvast JG. Dependence of the effects of dietary cholesterol and experimental conditions on serum lipids in man. II. Effects of dietary cholesterol in a linoleic acid‐poor diet. American Journal of Clinical Nutrition 1979;32(11):2188‐92. (CRSREF: 2912054)
Brox 1981
(CRSSTD: 2912055)
Brox JH, Killie JE, Gunnes S, Nordøy A. The effect of cod liver oil and corn oil on platelets and vessel wall in man. Thrombosis and Haemostasis 1981;46(3):604‐11. (CRSREF: 2912056)
Burdge 2004
(CRSSTD: 2912057)
Burdge GC, Lupoli B, Russell JJ, Tricon S, Kew S, Banerjee T, et al. Incorporation of cis‐9,trans‐11 or trans‐10,cis‐12 conjugated linoleic acid into plasma and cellular lipids in healthy men. Journal of Lipid Research 2004;45(4):736‐41. (CRSREF: 2912058)
Camargo 2013
(CRSSTD: 2912059)
Camargo A, Meneses M, Rangel‐Zuniga,O, Pérez‐Martínez P, Delgado‐Lista J, Marín C, et al. Dietary fat modifies lipid metabolism in the adipose tissue of patients with metabolic syndrome. Annals of Nutrition and Metabolism 2013;62:63. (CRSREF: 2912060)
Carvalho 2012
(CRSSTD: 2912061)
Carvalho RF, Uehara SK, Rosa G. Microencapsulated conjugated linoleic acid associated with hypocaloric diet reduces body fat in sedentary women with metabolic syndrome. Vascular Health and Risk Management 2012;8:661‐7. (CRSREF: 2912062)
Cater 1997
(CRSSTD: 2912063)
Cater NB, Heller HJ, Denke MA. Comparison of the effects of medium‐chain triacylglycerols, palm oil, and high oleic acid sunflower oil on plasma triacylglycerol fatty acids and lipid and lipoprotein concentrations in humans. American Journal of Clinical Nutrition 1997;65(1):41‐5. (CRSREF: 2912064)
Clandinin 1999
(CRSSTD: 2912065)
Clandinin MT, Cook SL, Konrad SD, Goh YK, French MA. The effect of palmitic acid on lipoprotein cholesterol levels and endogenous cholesterol synthesis in hyperlipidemic subjects. Lipids 1999;34 Suppl:S121‐4. (CRSREF: 2912066)
Deferne 1992
(CRSSTD: 2912069)
Deferne JL, Leeds AR. The antihypertensive effect of dietary supplementation with a 6‐desaturated essential fatty acid concentrate as compared with sunflower seed oil. Journal of Human Hypertension 1992;6(2):113‐9. (CRSREF: 2912070)
de Kok 2003
(CRSSTD: 2912071)
de Kok TM, Zwingman I, Moonen EJ, Schilderman PA, Rhijnsburger E, Haenen GR, et al. Analysis of oxidative DNA damage after human dietary supplementation with linoleic acid. Food and Chemical Toxicology 2003;41(3):351‐8. (CRSREF: 2912072)
Failor 1988
(CRSSTD: 2912079)
Failor RA, Childs MT, Bierman EL. The effects of omega 3 and omega 6 fatty acid‐enriched diets on plasma lipoproteins and apoproteins in familial combined hyperlipidemia. Metabolism: Clinical and Experimental 1988;37(11):1021‐8. (CRSREF: 2912080)
Friday 1991
(CRSSTD: 2912085)
Friday KE, Failor RA, Childs MT, Bierman EL. Effects of n‐3 and n‐6 fatty acid‐enriched diets on plasma lipoproteins and apolipoproteins in heterozygous familial hypercholesterolemia. Arteriosclerosis and Thrombosis 1991;11(1):47‐54. (CRSREF: 2912086)
Giacco 2007
(CRSSTD: 2912097)
Giacco R, Cuomo V, Vessby B, Uusitupa M, Hermansen K, Meyer BJ, et al. Fish oil, insulin sensitivity, insulin secretion and glucose tolerance in healthy people: is there any effect of fish oil supplementation in relation to the type of background diet and habitual dietary intake of n‐6 and n‐3 fatty acids? Nutrition, Metabolism, and Cardiovascular Diseases: NMCD 2007;17(8):572‐80. (CRSREF: 2912098)
Groen 1965
(CRSSTD: 2912099)
Groen JJ, Balogh M, Yaron E, Freeman J. Influence of the nature of the fat in diets high in carbohydrate (mainly derived from bread) on the serum cholesterol. American Journal of Clinical Nutrition 1965;17(5):296‐304. (CRSREF: 2912100)
Grundt 1995
(CRSSTD: 2912101)
Grundt H, Nilsen D, Hetland O, Aarsland T, Baksaas I, Grande T et al. Improvement of serum lipids and blood pressure during intervention with n‐3 fatty acids was not associated with changes in insulin levels in subjects with combined hyperlipidaemia. Journal of Internal Medicine 1995;237:249‐59. (CRSREF: 2912102)
Grønn 1991
(CRSSTD: 2912103)
Grønn M, Gørbitz C, Christensen E, Levorsen A, Ose L, Hagve TA, et al. Dietary n‐6 fatty acids inhibit the incorporation of dietary n‐3 fatty acids in thrombocyte and serum phospholipids in humans: a controlled dietetic study. Scandinavian Journal of Clinical and Laboratory Investigation 1991;51(3):255‐63. (CRSREF: 2912104)
Haglund 1998
(CRSSTD: 2912105)
Haglund O, Wallin R, Wretling S, Hultberg B, Saldeen T. Effects of fish oil alone and combined with long chain (n‐6) fatty acids on some coronary risk factors in male subjects. Journal of Nutritional Biochemistry 1998;9(11):629‐35. (CRSREF: 2912106)
Hartwich 2009
(CRSSTD: 2912109)
Hartwich J, Malczewska‐Malec M, Kiec‐Wilk B, Leszczynska‐Golabek I, Dembinska‐Kiec A, Pérez‐Martinez P, et al. The effect of the N‐3/N‐6 pufa ratio on the postprandial LDL phenotype and ischemia modified albumin (IMA). The LIPGENE study. In: Atherosclerosis Supplements. Vol. 10. 2009. (CRSREF: 2912110)
Hartwich 2010
(CRSSTD: 2912111)
Hartwich J, Leszczynska‐Golabek I, Kiec‐Wilk B, Siedlecka D, Pérez‐Martinez P, Marin C, et al. Lipoprotein profile, plasma ischemia modified albumin and LDL density change in the course of postprandial lipemia. Insights from the LIPGENE study. Scandinavian Journal of Clinical and Laboratory Investigation 2010;70(3):201‐8. (CRSREF: 2912112)
Higdon 2000
(CRSSTD: 2912115)
Higdon JV, Liu J, Du SH, Morrow JD, Ames BN, Wander RC. Supplementation of postmenopausal women with fish oil rich in eicosapentaenoic acid and docosahexaenoic acid is not associated with greater in vivo lipid peroxidation compared with oils rich in oleate and linoleate as assessed by plasma malondialdehyde and F(2)‐isoprostanes. American Journal of Clinical Nutrition 2000;72(3):714‐22. (CRSREF: 2912116)
Higdon 2001
(CRSSTD: 2912117)
Higdon JV, Du SH, Lee YS, Wu T, Wander RC. Supplementation of postmenopausal women with fish oil does not increase overall oxidation of LDL ex vivo compared to dietary oils rich in oleate and linoleate. Journal of Lipid Research 2001;42(3):407‐18. (CRSREF: 2912118)
Ho 1999
(CRSSTD: 2912119)
Ho M, Maple C, Bancroft A, McLaren M, Belch JJ. The beneficial effects of omega‐3 and omega‐6 essential fatty acid supplementation on red blood cell rheology. Prostaglandins, Leukotrienes, and Essential Fatty Acids 1999;61(1):13‐7. (CRSREF: 2912120)
Hodson 2001
(CRSSTD: 2912121)
Hodson L, Skeaff CM, Chisholm WA. The effect of replacing dietary saturated fat with polyunsaturated or monounsaturated fat on plasma lipids in free‐living young adults. European Journal of Clinical Nutrition 2001;55(10):908‐15. (CRSREF: 2912122)
Hwang 1997
(CRSSTD: 2912125)
Hwang DH, Chanmugam PS, Ryan DH, Boudreau MD, Windhauser MM, Tulley RT, et al. Does vegetable oil attenuate the beneficial effects of fish oil in reducing risk factors for cardiovascular disease? American Journal of Clinical Nutrition 1997;66(1):89‐96. (CRSREF: 2912126)
Intorre 2013
(CRSSTD: 2912127)
Intorre F, Venneria E, Finotti E, Foddai MS, Toti E, Catasta G, et al. Fatty acid content of serum lipid fractions and blood lipids in normolipidaemic volunteers fed two types of cheese having different fat compositions: a pilot study. International Journal of Food Sciences and Nutrition 2013;64(2):185‐93. (CRSREF: 2912128)
Iwata 2007
(CRSSTD: 2912129)
Iwata T, Kamegai T, Yamauchi‐Sato Y, Ogawa A, Kasai M, Aoyama T, et al. Safety of dietary conjugated linoleic acid (CLA) in a 12‐weeks trial in healthy overweight Japanese male volunteers. Journal of Oleo Science 2007;56(10):517‐25. (CRSREF: 2912130)
Kiecolt‐Glaser 2013
(CRSSTD:2912133)
Kiecolt‐Glaser JK, Epel ES, Belury MA, Andridge R, Lin J, Glaser R, et al. Omega‐3 fatty acids, oxidative stress, and leukocyte telomere length: A randomized controlled trial. Brain, Behavior, and Immunity 2013;28:16‐24. (CRSREF: 2912134)
Kim 2009
(CRSSTD: 2912135)
Kim JH, Kim OH, Jung H. Effects of supplementation of conjugated linoleic acid with gammaoryzanol on body fat mass in healthy overweight Korean women. In: FASEB Journal. Vol. 23 (Meeting Abstract Supplement). 2009:563.26. (CRSREF: 2912136)
Kingsbury 1961
(CRSSTD: 2912137)
Kingsbury KJ, Aylott C, Morgan DM, Emmerson R. Effects of ethyl arachidonate, cod‐liver oil, and corn oil on the plasma‐cholesterol level. A comparison in normal volunteers. Lancet 1961;1(7180):739‐41. (CRSREF: 2912138)
Knapp 1989
(CRSSTD: 2912139)
Knapp HR, FitzGerald GA. The antihypertensive effects of fish oil. A controlled study of polyunsaturated fatty acid supplements in essential hypertension. New England Journal of Medicine 1989;320(16):1037‐43. (CRSREF: 2912140)
Koyama 2009
(CRSSTD: 2912141)
Koyama N, Suzuki K, Furukawa Y, Arisaka H, Seki T, Kuribayashi K, et al. Effects of safflower seed extract supplementation on oxidation and cardiovascular risk markers in healthy human volunteers. British Journal of Nutrition 2009;101(4):568‐75. (CRSREF: 2912142)
Lambert 2007
(CRSSTD: 2912143)
Lambert EV, Goedecke JH, Bluett K, Heggie K, Claassen A, Rae DE, et al. Conjugated linoleic acid versus high‐oleic acid sunflower oil: effects on energy metabolism, glucose tolerance, blood lipids, appetite and body composition in regularly exercising individuals. British Journal of Nutrition 2007;97(5):1001‐11. (CRSREF: 2912144)
Lee 2012
(CRSSTD: 2912147)
Lee SP, Dart AM, Walker KZ, O'Dea K, Chin‐Dusting JP, Skilton MR. Effect of altering dietary n‐6:n‐3 PUFA ratio on cardiovascular risk measures in patients treated with statins: a pilot study. British Journal of Nutrition 2012;108(7):1280‐5. (CRSREF: 2912148)
Legrand 2010
(CRSSTD: 2912149)
Legrand P, Schmitt B, Mourot J, Catheline D, Chesneau G, Mireaux M, et al. The consumption of food products from linseed‐fed animals maintains erythrocyte omega‐3 fatty acids in obese humans. Lipids 2010;45(1):11‐9. (CRSREF: 2912150)
Margolin 1990
(CRSSTD: 2912154)
Margolin G, Huster G, Glueck CJ, Speirs J, Vandegrift J, Illig E. Blood‐pressure lowering in the elderly ‐ a double‐blind crossover study of omega‐3 and omega‐6 fatty‐acids. American Journal of Clinical Nutrition 1990;51(3):518. (CRSREF: 2912155)
Margolin 1991
(CRSSTD: 2912156)
Margolin G, Huster G, Glueck CJ, Speirs J, Vandegrift J, Illig E, et al. Blood pressure lowering in elderly subjects: a double‐blind crossover study of omega‐3 and omega‐6 fatty acids. American Journal of Clinical Nutrition 1991;53(2):562‐72. (CRSREF: 2912157)
McDaniel 2010
(CRSSTD: 2912158)
McDaniel JC, Ahijevych K, Belury M. Effect of n‐3 oral supplements on the n‐6/n‐3 ratio in young adults. Western Journal of Nursing Research 2010;32(1):64‐80. (CRSREF: 2912159)
MEMO ‐ Bouwens 2009
(CRSSTD: 2912047)
Bouwens M, van De Rest O, Dellschaft N, Bromhaar MG, De Groot LC, Geleijnse JM, et al. Fish‐oil supplementation induces antiinflammatory gene expression profiles in human blood mononuclear cells. American Journal of Clinical Nutrition 2009;90(2):415‐24. (CRSREF: 2912048)
Miles 2004
(CRSSTD: 2912162)
Miles EA, Banerjee T, Calder PC. The influence of different combinations of gamma‐linolenic, stearidonic and eicosapentaenoic acids on the fatty acid composition of blood lipids and mononuclear cells in human volunteers. Prostaglandins, Leukotrienes, and Essential Fatty Acids 2004;70(6):529‐38. (CRSREF: 2912163)
Mills 1989
(CRSSTD: 2912164)
Mills DE, Prkachin KM, Harvey KA, Ward RP. Dietary fatty acid supplementation alters stress reactivity and performance in man. Journal of Human Hypertension 1989;3(2):111‐6. (CRSREF: 2912165)
Minihane 2005
(CRSSTD: 2912166)
Minihane AM, Brady LM, Lovegrove SS, Lesauvage SV, Williams CM, Lovegrove JA. Lack of effect of dietary n‐6:n‐3 PUFA ratio on plasma lipids and markers of insulin responses in Indian Asians living in the UK. European Journal of Nutrition 2005;44(1):26‐32. (CRSREF: 2912167)
Misikangas 2001
(CRSSTD: 2912168)
Misikangas M, Freese R, Turpeinen AM, Mutanen M. High linoleic acid, low vegetable, and high oleic acid, high vegetable diets affect platelet activation similarly in healthy women and men. Journal of Nutrition 2001;131(6):1700‐5. (CRSREF: 2912169)
Moore 2006
(CRSSTD: 2912006)
Moore CS, Bryant SP, Mishra GD, Krebs JD, Browning LM, Miller GJ, et al. Oily fish reduces plasma triaclyglycerols: a primary prevention study in overweight men and women. Nutrition 2006;22(10):1012‐24. (CRSREF: 2912007)
Mortensen 1983
(CRSSTD: 2912170)
Mortensen JZ, Schmidt EB, Nielsen AH, Dyerberg J. The effect of N‐6 and N‐3 polyunsaturated fatty acids on hemostasis, blood lipids and blood pressure. Thrombosis and Haemostasis 1983;50(2):543‐6. (CRSREF: 2912171)
Møller 1992
(CRSSTD: 2912172)
Møller J, Svaneborg N, Lervang HH, Varming K, Madsen P, Dyerberg J, et al. The acute effect of a single very high dose of N‐3 fatty acids on coagulation and fibrinolysis. Thrombosis Research 1992;67(5):569‐77. (CRSREF: 2912173)
Naber 1992
(CRSSTD: 2912174)
Naber FB, Oudkerk Pool M, Teerlink T, Popp‐Snijders C, Gans RO, Bilo HJ. Effect of short‐term use of omega‐3‐type polyunsaturated fatty acids in subjects with hypertriglyceridemia (Dutch). Nederlands Tijdschrift voor Geneeskunde 1992;136(31):1511‐4. (CRSREF: 2912175)
Naumann 2006
(CRSSTD: 2912176)
Naumann E, Carpentier YA, Saebo A, Lassel TS, Chardigny JM, Sébédio JM, et al. Cis‐9, trans‐ 11 and trans‐10, cis‐12 conjugated linoleic acid (CLA) do not affect the plasma lipoprotein profile in moderately overweight subjects with LDL phenotype B. Atherosclerosis 2006;188(1):167‐74. (CRSREF: 2912177)
NDHS Open 2nd 1968
(Empty)
Nelson 1997a
(CRSSTD: 2912178)
Nelson GJ, Schmidt PC, Bartolini G, Kelley DS, Phinney SD, Kyle D, et al. The effect of dietary arachidonic acid on plasma lipoprotein distributions, apoproteins, blood lipid levels, and tissue fatty acid composition in humans. Lipids 1997;32(4):427‐33. (CRSREF: 2912179)
Nelson 1997b
(CRSSTD: 2912180)
Nelson GJ, Kelley DS, Emken EA, Phinney SD, Kyle D, Ferretti A. A human dietary arachidonic acid supplementation study conducted in a metabolic research unit: rationale and design. Lipids 1997;32(4):415‐20. (CRSREF: 2912181)
Nestel 1992
(CRSSTD: 2912182)
Nestel P, Noakes M, Belling GB, McArthur R, Clifton RM, Abbey M. Plasma cholesterol‐lowering potential of edible‐oil blends suitable for commercial use. American Journal of Clinical Nutrition 1992;55(1):46‐50. (CRSREF: 2912183)
Nestel 1995
(CRSSTD: 2912184)
Nestel PJ, Noakes M, Belling GB, McArthur R, Clifton PM. Effect on plasma lipids of interesterifying a mix of edible oils. American Journal of Clinical Nutrition 1995;62(5):950‐5. (CRSREF: 2912185)
Noakes 1996
(CRSSTD: 2912186)
Noakes M, Nestel P, Clifton P. Commercial frying fats and plasma lipid‐lowering potential. Australian Journal of Nutrition and Dietetics 1996;53(1):25‐30. (CRSREF: 2912187)
Oe 2008
(CRSSTD: 2912188)
Oe H, Hozumi T, Murata E, Matsuura H, Negishi K, Matsumura Y, et al. Arachidonic acid and docosahexaenoic acid supplementation increases coronary flow velocity reserve in Japanese elderly individuals. Heart 2008;94(3):316‐21. (CRSREF: 2912189)
OPTILIP 2006
(CRSSTD: 2912010)
Griffin MD, Sanders TA, Davies IG, Morgan LM, Millward DJ, Lewis F et al. Effects of altering the ratio of dietary n‐6 to n‐3 fatty acids on insulin sensitivity, lipoprotein size, and postprandial lipemia in men and postmenopausal women aged 45‐70 y: the OPTILIP Study. American Journal of Clinical Nutrition 2006;84(6):1290‐8. (CRSREF: 2912011)
* Sanders TAB, Lewis F, Slaughter S, Griffin BA, Griffin M, Davies I, et al. Effect of varying the ratio of n‐6 to n‐3 fatty acids by increasing the dietary intake of alpha‐linolenic acid, eicosapentaenoic and docosahexaenoic acid, or both on fibrinogen and clotting factors VII and XII in persons aged 45‐70 y: the OPTILIP study. American Journal of Clinical Nutrition 2006;84(3):513‐22. (CRSREF: 2912012)
Paschos 2007
(CRSSTD: 2912190)
Paschos GK, Zampelas A, Panagiotakos DB, Katsiougiannis S, Griffin BA, Votteas V, et al. Effects of flaxseed oil supplementation on plasma adiponectin levels in dyslipidemic men. European Journal of Nutrition 2007;46(6):315‐20. (CRSREF: 2912191)
Pałkowska 2012
(CRSSTD: 2912192)
Pałkowska E, Bartnikowska E, Owsiak D. The use of low‐caloric diet with modified fatty acids pool in the therapy of the metabolic syndrome. Roczniki Państwowego Zakładu Higieny 2012;63(2):163‐9. (CRSREF: 2912193)
Perez‐Martinez 2010
(CRSSTD: 2912194)
Perez‐Martinez P, Garcia‐Quintana J, Yubero‐Serrano E, Tasset‐Cuevas I, Tunez I, Garcia‐Rios A et al. Postprandial oxidative stress is modified by dietary fat: evidence from a human intervention study. Clinical Science 2010;119(6):251‐61. (CRSREF: 2912195)
Perkins 1958
(CRSSTD: 2912196)
Perkins R, Wright IS, Gatje BW. Effect of safflower oil emulsion on serum cholesterol levels in young adult males. Its use as a supplement to a normal diet. Journal of the American Medical Association 1958;166(17):2132‐5. (CRSREF: 2912197)
Radack 1990
(CRSSTD: 2912198)
Radack K, Deck C, Huster G. The comparative effects of n‐3 and n‐6 polyunsaturated fatty acids on plasma fibrinogen levels: a controlled clinical trial in hypertriglyceridemic subjects. Journal of the American College of Nutrition 1990;9(4):352‐7. (CRSREF: 2912199)
Radack 1991
(CRSSTD: 2912200)
Radack K, Deck C, Huster G. The effects of low doses of n‐3 fatty acid supplementation on blood pressure in hypertensive subjects. A randomized controlled trial. Archives of Internal Medicine 1991;151(6):1173‐80. (CRSREF: 2912201)
Rajaram 2012
(CRSSTD: 2912202)
Rajaram S, Sabate J, Mohan S. Effect of n‐3 polyunsaturated fatty acids on peroxisome proliferator‐activated receptor gamma (PPARγ) expression in adults. In: FASEB Journal. Vol. 26. 2012:823.28. (CRSREF: 2912203)
Rallidis 2003
(CRSSTD: 2912204)
Rallidis LS, Paschos G, Liakos GK, Velissaridou AH, Anastasiadis G, Zampelas A. Dietary alpha‐linolenic acid decreases C‐reactive protein, serum amyloid A and interleukin‐6 in dyslipidaemic patients. Atherosclerosis 2003;167(2):237‐42. (CRSREF: 2912205)
Rallidis 2004
(CRSSTD: 2912206)
Rallidis LS, Paschos G, Papaioannou M, Liakos GK, Panagiotakos DB, Anastasiadis G, et al. The effect of diet enriched with alpha‐linolenic acid on soluble cellular adhesion molecules in dyslipidaemic patients. Atherosclerosis 2004;174(1):127‐32. (CRSREF: 2912207)
Ramprasath 2012
(CRSSTD: 2912208)
Ramprasath VR, Jones PJ, Buckley DD, Woollett LA, Heubi JE. Decreased plasma cholesterol concentrations after PUFA‐rich diets are not due to reduced cholesterol absorption/synthesis. Lipids 2012;47(11):1063‐71. (CRSREF: 2912209)
Reaven 1991
(CRSSTD: 2912210)
Reaven P, Parthasarathy S, Grasse BJ, Miller E, Almazan F, Mattson FH, et al. Feasibility of using an oleate‐rich diet to reduce the susceptibility of low‐density lipoprotein to oxidative modification in humans. American Journal of Clinical Nutrition 1991;54(4):701‐6. (CRSREF: 2912211)
Risérus 2002a
(CRSSTD: 2912212)
Risérus U, Basu S, Jovinge S, Fredrikson G, Arnlöv J, Vessby B. Supplementation with conjugated linoleic acid causes isomer‐dependent oxidative stress and elevated C‐reactive protein: a potential link to fatty acid‐induced insulin resistance. Circulation 2002;106(15):1925‐9. (CRSREF: 2912213)
Risérus 2002b
(CRSSTD: 2912214)
Risérus U, Arner P, Brismar K, Vessby B. Treatment with dietary trans10cis12 conjugated linoleic acid causes isomer‐specific insulin resistance in obese men with the metabolic syndrome. Diabetes Care 2002;25(9):1516‐21. (CRSREF: 2912215)
Risérus 2004
(CRSSTD: 2912216)
Risérus U, Vessby B, Arner P, Zethelius B. Supplementation with trans10cis12‐conjugated linoleic acid induces hyperproinsulinaemia in obese men: close association with impaired insulin sensitivity. Diabetologia 2004;47(6):1016‐9. (CRSREF: 2912217)
Robertson 2002
(CRSSTD: 2912218)
Robertson MD, Jackson KG, Fielding BA, Morgan LM, Williams CM, Frayn KN. Acute ingestion of a meal rich in n‐3 polyunsaturated fatty acids results in rapid gastric emptying in humans. American Journal of Clinical Nutrition 2002;76(1):232‐8. (CRSREF: 2912219)
Sanders 1983
(CRSSTD: 2912222)
Sanders TA, Hochland MC. A comparison of the influence on plasma lipids and platelet function of supplements of omega 3 and omega 6 polyunsaturated fatty acids. British Journal of Nutrition 1983;50(3):521‐9. (CRSREF: 2912223)
Sanders 1997
(CRSSTD: 2912224)
Sanders TA, Oakley FR, Miller GJ, Mitropoulos KA, Crook D, Oliver MF. Influence of n‐6 versus n‐3 polyunsaturated fatty acids in diets low in saturated fatty acids on plasma lipoproteins and hemostatic factors. Arteriosclerosis, Thrombosis, and Vascular Biology 1997;17(12):3449‐60. (CRSREF: 2912225)
Sarkkinen 1998
(CRSSTD: 2912013)
Sarkkinen ES, Uusitupa MI, Gylling H, Miettinen TA. Fat‐modified diets influence serum concentrations of cholesterol precursors and plant sterols in hypercholesterolemic subjects. Metabolism 1998;47(6):744‐50. (CRSREF: 2912014)
Singer 1991
(CRSSTD: 2912226)
Singer P, Wirth M, Kretschmer H. Different changes of n‐6 fatty acids in lipoproteins from hyperlipemic subjects after diets supplemented with n‐3 fatty acids. Prostaglandins, Leukotrienes, and Essential Fatty Acids 1991;42(2):107‐11. (CRSREF: 2912227)
Sirtori 1992
(CRSSTD: 2912228)
Sirtori CR, Gatti E, Tremoli E, Galli C, Gianfranceschi G, Franceschini G, et al. Olive oil, corn oil, and n‐3 fatty acids differently affect lipids, lipoproteins, platelets, and superoxide formation in type II hypercholesterolemia. American Journal of Clinical Nutrition 1992;56(1):113‐22. (CRSREF: 2912229)
Smedman 2001
(CRSSTD: 2912230)
Smedman A, Vessby B. Conjugated linoleic acid supplementation in humans‐‐metabolic effects. Lipids 2001;36(8):773‐81. (CRSREF: 2912231)
Sofi 2010
(CRSSTD: 2912232)
Sofi F, Buccioni A, Cesari F, Gori A, Minieri S, Mannini L, et al. Effects of a dairy product (pecorino cheese) naturally rich in cis‐9, trans‐11 conjugated linoleic acid on lipid, inflammatory and haemorheological variables: a dietary intervention study. Nutrition, Metabolism, and Cardiovascular Diseases 2010;20(2):117‐24. (CRSREF: 2912233)
Sofi 2013
(CRSSTD: 2912234)
Sofi F, Giorgi G, Cesari G, Gori AM, Mannini L, Parisi G, et al. The atherosclerotic risk profile is affected differently by fish flesh with a similar EPA and DHA content but different n‐6/n‐3 ratio. Asia Pacific Journal of Clinical Nutrition 2013;22(1):32‐40. (CRSREF: 2912235)
Solà 1997
(CRSSTD: 2912236)
Solà R, La Ville AE, Richard JL, Motta C, Bargalló MT, Girona J, et al. Oleic acid rich diet protects against the oxidative modification of high density lipoprotein. Free Radical Biology & Medicine 1997;22(6):1037‐45. (CRSREF: 2912237)
Song 2005
(CRSSTD: 2912238)
Song HJ, Grant I, Rotondo D, Mohede I, Sattar N, Heys SD, et al. Effect of CLA supplementation on immune function in young healthy volunteers. European Journal of Clinical Nutrition 2005;59(4):508‐17. (CRSREF: 2912239)
Steck 2007
(CRSSTD: 2912240)
Steck SE, Chalecki AM, Miller P, Conway J, Austin GL, Hardin JW, et al. Conjugated linoleic acid supplementation for twelve weeks increases lean body mass in obese humans. Journal of Nutrition 2007;137(5):1188‐93. (CRSREF: 2912241)
Sundram 1992
(CRSSTD: 2912242)
Sundram K, Hornstra G, von Houwelingen AC, Kester AD. Replacement of dietary fat with palm oil: effect on human serum lipids, lipoproteins and apolipoproteins. British Journal of Nutrition 1992;68(3):677‐92. (CRSREF: 2912243)
Svaneborg 1994
(CRSSTD: 2912244)
Svaneborg N, Møller JM, Schmidt EB, Varming K, Lervang HH, Dyerberg J. The acute effects of a single very high dose of n‐3 fatty acids on plasma lipids and lipoproteins in healthy subjects. Lipids 1994;29(2):145‐7. (CRSREF: 2912245)
Tavakkoli 2010
(CRSSTD: 2912246)
Tavakkoli D, Hosseinpanah F, Tahbaz F, Amiri Z, Tavakkoli D, Hedayati M. Effects of conjugated linoleic acid supplementation on body composition and leptin concentration in post‐menopausal women (Arabic). Iranian Journal of Endocrinology and Metabolism 2010;12(1):48‐59, 84. (CRSREF: 2912247)
Taylor 2006
(CRSSTD: 2912248)
Taylor JS, Williams SR, Rhys R, James P, Frenneaux MP. Conjugated linoleic acid impairs endothelial function. Arteriosclerosis, Thrombosis, and Vascular Biology 2006;26(2):307‐12. (CRSREF: 2912249)
Tholstrup 2008
(CRSSTD: 2912250)
Tholstrup T, Raff M, Straarup EM, Lund P, Basu S, Bruun JM. An oil mixture with trans‐10, cis‐12 conjugated linoleic acid increases markers of inflammation and in vivo lipid peroxidation compared with cis‐9, trans‐11 conjugated linoleic acid in postmenopausal women. Journal of Nutrition 2008;138(8):1445‐51. (CRSREF: 2912251)
Tierney 2011
(CRSSTD: 2912252)
Tierney AC, McMonagle J, Shaw DI, Gulseth HL, Helal O, Saris WH, et al. Effects of dietary fat modification on insulin sensitivity and on other risk factors of the metabolic syndrome‐‐LIPGENE: a European randomized dietary intervention study. International Journal of Obesity 2011;35(6):800‐9. (CRSREF: 2912253)
Truswell 2000
(CRSSTD: 2912254)
Truswell AS. Comparing palmolein with different predominantly monounsaturated oils: effect on plasma lipids. International Journal of Food Sciences and Nutrition 2000;15 Suppl:S73‐7. (CRSREF: 2912255)
Tsai 1997
(CRSSTD: 2912256)
Tsai PJ, Lu SC. Fish oil lowers plasma lipid concentrations and increases the susceptibility of low density lipoprotein to oxidative modification in healthy men. Journal of the Formosan Medical Association 1997;96(9):718‐26. (CRSREF: 2912257)
Tsofliou 2009
(CRSSTD: 2912258)
Tsofliou F, Fyfe C, Matheson I, Jackson D, Horgan G, Wahle K, et al. Fasted and postprandial plasma lipids in healthy volunteers by a dietary mixture of omega‐3 fatty acid modulation and conjugated linoleic acid. Journal of Food Lipids 2009;16:499‐513. (CRSREF: 2912259)
Tulk 2009
(CRSSTD: 2912260)
Tulk HM, Robinson LE. Modifying the n‐6/n‐3 polyunsaturated fatty acid ratio of a high‐saturated fat challenge does not acutely attenuate postprandial changes in inflammatory markers in men with metabolic syndrome. Metabolism: Clinical and Experimental 2009;58(12):1709‐16. (CRSREF: 2912261)
Valsta 1996
(CRSSTD: 2912262)
Valsta LM, Salminen I, Aro A, Mutanen M. Alpha‐linolenic acid in rapeseed oil partly compensates for the effect of fish restriction on plasma long chain n‐3 fatty acids. European Journal of Clinical Nutrition 1996;50(4):229‐35. (CRSREF: 2912263)
Venter 1988
(CRSSTD: 2912264)
Venter CP, Joubert PH, Booyens J. Effects of essential fatty acids on mild to moderate essential hypertension. Prostaglandins, Leukotrienes, and Essential Fatty Acids 1988;33(1):49‐51. (CRSREF: 2912265)
Vericel 1987
(CRSSTD: 2912268)
Vericel E, Lagarde M, Mendy F. Comparative effects of linoleic acid and gamma‐linolenic acid intake on plasma lipids and platelet phospholipids in elderly people. Nutrition Research 1987;7:569‐80. (CRSREF: 2912269)
Vermunt 2001
(CRSSTD: 2912270)
Vermunt SH, Beaufrère B, Riemersma RA, Sébédio JL, Chardigny JM, Mensink RP, et al. Dietary trans alpha‐linolenic acid from deodorised rapeseed oil and plasma lipids and lipoproteins in healthy men: the TransLinE Study. British Journal of Nutrition 2001;85(3):387‐92. (CRSREF: 2912271)
Viikari 1986
(CRSSTD: 2912272)
Viikari J, Lehtonen A. Effect of primrose oil on serum lipids and blood pressure in hyperlipidemic subjects. International Journal of Clinical Pharmacology, Therapy, and Toxicology 1986;24(12):668‐70. (CRSREF: 2912273)
West 2010
(CRSSTD: 2912274)
West SG, Krick AL, Klein LC, Zhao G, Wojtowicz TF, McGuiness M, et al. Effects of diets high in walnuts and flax oil on hemodynamic responses to stress and vascular endothelial function. Journal of the American College of Nutrition 2010;29(6):595‐603. (CRSREF: 2912275)
Wilkinson 2005
(CRSSTD: 2912276)
Wilkinson P, Leach C, Ah‐Sing EE, Hussain N, Miller GJ, Millward DJ, et al. Influence of alpha‐linolenic acid and fish‐oil on markers of cardiovascular risk in subjects with an atherogenic lipoprotein phenotype. Atherosclerosis 2005;181(1):115‐24. (CRSREF: 2912277)
Yam 2001
(CRSSTD: 2912278)
Yam D, Bott‐Kanner G, Genin I, Shinitzky M, Klainman E. The effect of omega‐3 fatty acids on risk factors for cardiovascular diseases (Hebrew). Harefuah 2001;140(12):1156‐8, 1230. (CRSREF: 2912279)
Zhao 2004
(CRSSTD: 2912280)
Zhao G, Etherton TD, Martin KR, West SG, Gillies PJ, Kris‐Etherton PM. Dietary a‐linolenic acid reduces inflammatory and lipid cardiovascular risk factors in hypercholesterolemic men and women. Journal of Nutrition 2004;134(11):2991‐7. (CRSREF: 2912281)
Zhao 2007
(CRSSTD: 2912282)
Zhao G, Etherton TD, Martin KR, Gillies PJ, West SG, Kris‐Etherton PM. Dietary alpha‐linolenic acid inhibits proinflammatory cytokine production by peripheral blood mononuclear cells in hypercholesterolemic subjects. American Journal of Clinical Nutrition 2007;85(2):385‐91. (CRSREF: 2912283)
Data and analyses
Comparison 1. Primary outcomes ‐ higher omega‐6 vs lower omega‐6.
| Outcome or subgroup title | No. of studies | No. of participants | Statistical method | Effect size |
|---|---|---|---|---|
| 1 All‐cause mortality (overall) | 10 | 4506 | Risk Ratio (M‐H, Random, 95% CI) | 1.00 [0.88, 1.12] |
| 2 All‐cause mortality ‐ sensitivity analysis by fixed‐effect analysis | 10 | 4506 | Risk Ratio (M‐H, Fixed, 95% CI) | 1.00 [0.89, 1.13] |
| 3 All‐cause mortality ‐ sensitivity analyses | 10 | Risk Ratio (M‐H, Random, 95% CI) | Subtotals only | |
| 3.1 Studies at low risk of bias | 2 | 682 | Risk Ratio (M‐H, Random, 95% CI) | 1.54 [0.98, 2.41] |
| 3.2 Pre‐2010 or prospective trials registry entry | 9 | 4306 | Risk Ratio (M‐H, Random, 95% CI) | 1.00 [0.89, 1.13] |
| 3.3 No commercial funding | 4 | 1208 | Risk Ratio (M‐H, Random, 95% CI) | 1.19 [0.84, 1.69] |
| 3.4 Low risk of attention bias | 6 | 1489 | Risk Ratio (M‐H, Random, 95% CI) | 0.97 [0.83, 1.13] |
| 3.5 Randomised 250+ participants | 4 | 3730 | Risk Ratio (M‐H, Random, 95% CI) | 1.01 [0.87, 1.17] |
| 3.6 Randomised 100+ participants | 8 | 4403 | Risk Ratio (M‐H, Random, 95% CI) | 1.00 [0.88, 1.13] |
| 4 All‐cause mortality ‐ subgroup by LA or GLA | 10 | 4506 | Risk Ratio (M‐H, Random, 95% CI) | 1.00 [0.88, 1.12] |
| 4.1 Mainly LA | 8 | 4341 | Risk Ratio (M‐H, Random, 95% CI) | 1.01 [0.89, 1.14] |
| 4.2 GLA supplements | 2 | 165 | Risk Ratio (M‐H, Random, 95% CI) | 0.76 [0.41, 1.39] |
| 5 All‐cause mortality ‐ subgroup by intervention type | 10 | 4506 | Risk Ratio (M‐H, Random, 95% CI) | 1.00 [0.88, 1.12] |
| 5.1 Dietary advice | 3 | 2624 | Risk Ratio (M‐H, Random, 95% CI) | 1.15 [0.82, 1.61] |
| 5.2 Supplements (capsules) | 2 | 165 | Risk Ratio (M‐H, Random, 95% CI) | 0.76 [0.41, 1.39] |
| 5.3 Supplemental foods | 1 | 200 | Risk Ratio (M‐H, Random, 95% CI) | 0.20 [0.01, 4.11] |
| 5.4 Dietary advice plus supplement | 2 | 447 | Risk Ratio (M‐H, Random, 95% CI) | 0.94 [0.60, 1.46] |
| 5.5 Diet (all foods) provided | 2 | 1070 | Risk Ratio (M‐H, Random, 95% CI) | 0.98 [0.84, 1.15] |
| 6 All‐cause mortality ‐ subgroup by replacement | 10 | Risk Ratio (M‐H, Random, 95% CI) | Subtotals only | |
| 6.1 N‐6 replacing SFA | 6 | 4154 | Risk Ratio (M‐H, Random, 95% CI) | 1.00 [0.88, 1.15] |
| 6.2 N‐6 replacing MUFA | 5 | 1698 | Risk Ratio (M‐H, Random, 95% CI) | 1.13 [0.83, 1.53] |
| 6.3 N‐6 replacing nil, low n‐6 | 0 | 0 | Risk Ratio (M‐H, Random, 95% CI) | 0.0 [0.0, 0.0] |
| 6.4 N‐6 replacement unclear | 2 | 442 | Risk Ratio (M‐H, Random, 95% CI) | 0.85 [0.58, 1.24] |
| 6.5 N‐6 replacing CHO | 1 | 133 | Risk Ratio (M‐H, Random, 95% CI) | 1.97 [0.18, 21.21] |
| 6.6 N‐6 replacing protein | 1 | 133 | Risk Ratio (M‐H, Random, 95% CI) | 1.97 [0.18, 21.21] |
| 7 All‐cause mortality ‐ subgroup by baseline CVD risk | 10 | 4506 | Risk Ratio (M‐H, Random, 95% CI) | 1.00 [0.88, 1.12] |
| 7.1 Primary prevention ‐ low CVD risk | 5 | 1368 | Risk Ratio (M‐H, Random, 95% CI) | 0.97 [0.83, 1.13] |
| 7.2 Primary prevention ‐ moderate CVD risk | 0 | 0 | Risk Ratio (M‐H, Random, 95% CI) | 0.0 [0.0, 0.0] |
| 7.3 Secondary prevention ‐ existing CVD | 5 | 3138 | Risk Ratio (M‐H, Random, 95% CI) | 1.06 [0.83, 1.35] |
| 8 All‐cause mortality ‐ subgroup by omega‐6 dose | 10 | 4506 | Risk Ratio (M‐H, Random, 95% CI) | 1.00 [0.88, 1.12] |
| 8.1 N‐6 < 4% E | 4 | 2331 | Risk Ratio (M‐H, Random, 95% CI) | 0.95 [0.76, 1.19] |
| 8.2 N‐6 4% to 12% E | 2 | 1304 | Risk Ratio (M‐H, Random, 95% CI) | 1.15 [0.76, 1.74] |
| 8.3 N‐6 > 12% E | 4 | 871 | Risk Ratio (M‐H, Random, 95% CI) | 0.93 [0.60, 1.44] |
| 9 All‐cause mortality ‐ subgroup by duration | 10 | 4506 | Risk Ratio (M‐H, Random, 95% CI) | 1.00 [0.88, 1.12] |
| 9.1 Medium duration 1 to < 2 years in study | 1 | 224 | Risk Ratio (M‐H, Random, 95% CI) | 3.11 [0.17, 56.84] |
| 9.2 Medium‐long duration 2 to < 4 years | 6 | 2585 | Risk Ratio (M‐H, Random, 95% CI) | 0.96 [0.76, 1.20] |
| 9.3 Long duration 4+ years in study | 3 | 1697 | Risk Ratio (M‐H, Random, 95% CI) | 1.05 [0.81, 1.36] |
| 10 All‐cause mortality ‐ subgroup by statin use | 10 | 4506 | Risk Ratio (M‐H, Random, 95% CI) | 1.00 [0.88, 1.12] |
| 10.1 ≥ 50% of control group on statins | 1 | 200 | Risk Ratio (M‐H, Random, 95% CI) | 0.20 [0.01, 4.11] |
| 10.2 < 50% of control group on statins | 9 | 4306 | Risk Ratio (M‐H, Random, 95% CI) | 1.00 [0.89, 1.13] |
| 10.3 Statin use unclear | 0 | 0 | Risk Ratio (M‐H, Random, 95% CI) | 0.0 [0.0, 0.0] |
| 11 All‐cause mortality ‐ subgroup by baseline omega‐6 | 10 | 4506 | Risk Ratio (M‐H, Random, 95% CI) | 1.00 [0.88, 1.12] |
| 11.1 ≥ 8% E from n‐6 | 1 | 133 | Risk Ratio (M‐H, Random, 95% CI) | 1.97 [0.18, 21.21] |
| 11.2 5% to < 8% E from n‐6 | 2 | 2491 | Risk Ratio (M‐H, Random, 95% CI) | 1.16 [0.77, 1.76] |
| 11.3 < 5% E from n‐6 | 2 | 1070 | Risk Ratio (M‐H, Random, 95% CI) | 0.98 [0.84, 1.15] |
| 11.4 baseline n‐6 not reported | 5 | 812 | Risk Ratio (M‐H, Random, 95% CI) | 0.85 [0.60, 1.22] |
| 12 All‐cause mortality ‐ subgroup by sex | 10 | 4506 | Risk Ratio (M‐H, Random, 95% CI) | 1.00 [0.88, 1.12] |
| 12.1 Men only | 5 | 3954 | Risk Ratio (M‐H, Random, 95% CI) | 1.01 [0.89, 1.14] |
| 12.2 Women only | 0 | 0 | Risk Ratio (M‐H, Random, 95% CI) | 0.0 [0.0, 0.0] |
| 12.3 Men and women | 4 | 498 | Risk Ratio (M‐H, Random, 95% CI) | 0.76 [0.43, 1.36] |
| 12.4 Sex not reported | 1 | 54 | Risk Ratio (M‐H, Random, 95% CI) | 1.55 [0.41, 5.84] |
| 13 Cardiovascular mortality (overall) | 7 | 4019 | Risk Ratio (M‐H, Random, 95% CI) | 1.09 [0.76, 1.55] |
| 14 CVD mortality ‐ sensitivity analysis by fixed‐effect analysis | 7 | 4019 | Risk Ratio (M‐H, Fixed, 95% CI) | 1.05 [0.89, 1.25] |
| 15 CVD mortality ‐ sensitivity analyses | 7 | Risk Ratio (M‐H, Random, 95% CI) | Subtotals only | |
| 15.1 Studies at low risk of bias | 1 | 458 | Risk Ratio (M‐H, Random, 95% CI) | 1.59 [0.99, 2.55] |
| 15.2 Pre‐2010 or prospective trials registry entry | 7 | 4019 | Risk Ratio (M‐H, Random, 95% CI) | 1.09 [0.76, 1.55] |
| 15.3 No commercial funding | 4 | 1086 | Risk Ratio (M‐H, Random, 95% CI) | 1.22 [0.67, 2.23] |
| 15.4 Low risk of attention bias | 2 | 900 | Risk Ratio (M‐H, Random, 95% CI) | 0.79 [0.45, 1.39] |
| 15.5 Randomised 250+ participants | 4 | 3730 | Risk Ratio (M‐H, Random, 95% CI) | 1.08 [0.76, 1.54] |
| 15.6 Randomised 100+ participants | 6 | 3965 | Risk Ratio (M‐H, Random, 95% CI) | 1.06 [0.73, 1.55] |
| 16 CVD mortality ‐ subgroup by intervention type | 7 | Risk Ratio (M‐H, Random, 95% CI) | Subtotals only | |
| 16.1 Dietary advice | 4 | 2726 | Risk Ratio (M‐H, Random, 95% CI) | 1.33 [0.86, 2.05] |
| 16.2 Supplements (capsules) | 0 | 0 | Risk Ratio (M‐H, Random, 95% CI) | 0.0 [0.0, 0.0] |
| 16.3 Supplemental foods | 0 | 0 | Risk Ratio (M‐H, Random, 95% CI) | 0.0 [0.0, 0.0] |
| 16.4 Dietary advice plus supplement | 2 | 447 | Risk Ratio (M‐H, Random, 95% CI) | 1.11 [0.69, 1.78] |
| 16.5 Diet (all foods) provided | 1 | 846 | Risk Ratio (M‐H, Random, 95% CI) | 0.70 [0.51, 0.96] |
| 17 CVD mortality ‐ subgroup by replacement | 7 | Risk Ratio (M‐H, Random, 95% CI) | Subtotals only | |
| 17.1 N‐6 replacing SFA | 5 | 3832 | Risk Ratio (M‐H, Random, 95% CI) | 1.04 [0.71, 1.52] |
| 17.2 N‐6 replacing MUFA | 3 | 1358 | Risk Ratio (M‐H, Random, 95% CI) | 1.10 [0.56, 2.16] |
| 17.3 N‐6 replacing nil, low n‐6 | 0 | 0 | Risk Ratio (M‐H, Random, 95% CI) | 0.0 [0.0, 0.0] |
| 17.4 N‐6 replacement unclear | 1 | 393 | Risk Ratio (M‐H, Random, 95% CI) | 1.05 [0.63, 1.75] |
| 17.5 N‐6 replacing CHO | 2 | 235 | Risk Ratio (M‐H, Random, 95% CI) | 0.65 [0.01, 33.17] |
| 17.6 N‐6 replacing protein | 1 | 133 | Risk Ratio (M‐H, Random, 95% CI) | 4.93 [0.24, 100.70] |
| 18 CVD mortality ‐ subgroup by baseline CVD risk | 7 | Risk Ratio (M‐H, Random, 95% CI) | Subtotals only | |
| 18.1 Primary prevention ‐ low CVD risk | 2 | 979 | Risk Ratio (M‐H, Random, 95% CI) | 1.02 [0.22, 4.66] |
| 18.2 Primary prevention ‐ moderate CVD risk | 1 | 102 | Risk Ratio (M‐H, Random, 95% CI) | 0.09 [0.01, 1.60] |
| 18.3 Secondary prevention ‐ existing CVD | 4 | 2938 | Risk Ratio (M‐H, Random, 95% CI) | 1.28 [1.04, 1.57] |
| 19 CVD mortality ‐ subgroup by omega‐6 dose | 7 | Risk Ratio (M‐H, Random, 95% CI) | Subtotals only | |
| 19.1 N‐6 < 4% E | 2 | 2166 | Risk Ratio (M‐H, Random, 95% CI) | 1.26 [0.97, 1.64] |
| 19.2 N‐6 4% to 12% E | 3 | 1406 | Risk Ratio (M‐H, Random, 95% CI) | 0.87 [0.38, 1.99] |
| 19.3 N‐6 > 12% E | 2 | 447 | Risk Ratio (M‐H, Random, 95% CI) | 1.11 [0.69, 1.78] |
| 20 CVD mortality ‐ subgroup by duration | 7 | Risk Ratio (M‐H, Random, 95% CI) | Subtotals only | |
| 20.1 Medium duration 1 to < 2 years in study | 0 | 0 | Risk Ratio (M‐H, Random, 95% CI) | 0.0 [0.0, 0.0] |
| 20.2 Medium‐long duration 2 to < 4 years | 3 | 2220 | Risk Ratio (M‐H, Random, 95% CI) | 1.27 [0.98, 1.64] |
| 20.3 Long duration 4+ years in study | 4 | 1799 | Risk Ratio (M‐H, Random, 95% CI) | 0.96 [0.56, 1.63] |
| 21 CVD mortality ‐ subgroup by baseline omega‐6 | 7 | Risk Ratio (M‐H, Random, 95% CI) | Subtotals only | |
| 21.1 ≥ 8% E from n‐6 | 1 | 133 | Risk Ratio (M‐H, Random, 95% CI) | 4.93 [0.24, 100.70] |
| 21.2 5% to < 8% E from n‐6 | 2 | 2491 | Risk Ratio (M‐H, Random, 95% CI) | 1.32 [1.05, 1.66] |
| 21.3 < 5% E from n‐6 | 1 | 846 | Risk Ratio (M‐H, Random, 95% CI) | 0.70 [0.51, 0.96] |
| 21.4 Baseline n‐6 not reported | 3 | 549 | Risk Ratio (M‐H, Random, 95% CI) | 0.95 [0.38, 2.34] |
| 22 CVD mortality ‐ subgroup by sex | 7 | Risk Ratio (M‐H, Random, 95% CI) | Subtotals only | |
| 22.1 Men only | 4 | 3730 | Risk Ratio (M‐H, Random, 95% CI) | 1.08 [0.76, 1.54] |
| 22.2 Women only | 0 | 0 | Risk Ratio (M‐H, Random, 95% CI) | 0.0 [0.0, 0.0] |
| 22.3 Men and women | 2 | 235 | Risk Ratio (M‐H, Random, 95% CI) | 0.65 [0.01, 33.17] |
| 22.4 Sex not reported | 1 | 54 | Risk Ratio (M‐H, Random, 95% CI) | 1.55 [0.41, 5.84] |
| 23 Any cardiovascular event (overall) | 7 | 4962 | Risk Ratio (M‐H, Random, 95% CI) | 0.97 [0.81, 1.15] |
| 24 CVD events ‐ sensitivity analysis by fixed‐effect analysis | 7 | 4962 | Risk Ratio (M‐H, Fixed, 95% CI) | 0.97 [0.89, 1.05] |
| 25 CVD events ‐ sensitivity analyses | 7 | Risk Ratio (M‐H, Random, 95% CI) | Subtotals only | |
| 25.1 Studies at low risk of bias | 2 | 1525 | Risk Ratio (M‐H, Random, 95% CI) | 1.62 [1.02, 2.57] |
| 25.2 Pre‐2010 or prospective trials registry entry | 7 | 4962 | Risk Ratio (M‐H, Random, 95% CI) | 0.97 [0.81, 1.15] |
| 25.3 No commercial funding | 3 | 1918 | Risk Ratio (M‐H, Random, 95% CI) | 1.16 [0.64, 2.12] |
| 25.4 Low risk of attention bias | 4 | 2078 | Risk Ratio (M‐H, Random, 95% CI) | 0.90 [0.66, 1.22] |
| 25.5 Randomised 250+ participants | 5 | 4797 | Risk Ratio (M‐H, Random, 95% CI) | 0.95 [0.78, 1.16] |
| 25.6 Randomised 100+ participants | 6 | 4908 | Risk Ratio (M‐H, Random, 95% CI) | 0.95 [0.79, 1.14] |
| 26 CVD events ‐ subgroup by LA or GLA | 7 | 4962 | Risk Ratio (M‐H, Random, 95% CI) | 0.97 [0.81, 1.15] |
| 26.1 Mainly LA | 6 | 4851 | Risk Ratio (M‐H, Random, 95% CI) | 0.97 [0.81, 1.17] |
| 26.2 GLA supplements | 1 | 111 | Risk Ratio (M‐H, Random, 95% CI) | 0.35 [0.01, 8.45] |
| 27 CVD events ‐ subgroup by intervention type | 7 | 4962 | Risk Ratio (M‐H, Random, 95% CI) | 0.97 [0.81, 1.15] |
| 27.1 Dietary advice | 2 | 2491 | Risk Ratio (M‐H, Random, 95% CI) | 1.18 [0.76, 1.85] |
| 27.2 Supplements (capsules) | 1 | 111 | Risk Ratio (M‐H, Random, 95% CI) | 0.35 [0.01, 8.45] |
| 27.3 Supplemental foods | 0 | 0 | Risk Ratio (M‐H, Random, 95% CI) | 0.0 [0.0, 0.0] |
| 27.4 Dietary advice plus supplement | 2 | 447 | Risk Ratio (M‐H, Random, 95% CI) | 0.95 [0.63, 1.42] |
| 27.5 Diet (all foods) provided | 2 | 1913 | Risk Ratio (M‐H, Random, 95% CI) | 0.80 [0.64, 1.01] |
| 28 CVD events ‐ subgroup by replacement | 7 | Risk Ratio (M‐H, Random, 95% CI) | Subtotals only | |
| 28.1 N‐6 replacing SFA | 5 | 4797 | Risk Ratio (M‐H, Random, 95% CI) | 0.95 [0.78, 1.16] |
| 28.2 N‐6 replacing MUFA | 4 | 2425 | Risk Ratio (M‐H, Random, 95% CI) | 1.15 [0.73, 1.81] |
| 28.3 N‐6 replacing nil, low n‐6 | 1 | 111 | Risk Ratio (M‐H, Random, 95% CI) | 0.35 [0.01, 8.45] |
| 28.4 N‐6 replacement unclear | 1 | 393 | Risk Ratio (M‐H, Random, 95% CI) | 0.82 [0.62, 1.07] |
| 28.5 N‐6 replacing CHO | 0 | 0 | Risk Ratio (M‐H, Random, 95% CI) | 0.0 [0.0, 0.0] |
| 28.6 N‐6 replacing protein | 0 | 0 | Risk Ratio (M‐H, Random, 95% CI) | 0.0 [0.0, 0.0] |
| 29 CVD events ‐ subgroup by baseline CVD risk | 7 | 4962 | Risk Ratio (M‐H, Random, 95% CI) | 0.97 [0.81, 1.15] |
| 29.1 Primary prevention ‐ low CVD risk | 2 | 1913 | Risk Ratio (M‐H, Random, 95% CI) | 0.80 [0.64, 1.01] |
| 29.2 Primary prevention ‐ moderate CVD risk | 1 | 111 | Risk Ratio (M‐H, Random, 95% CI) | 0.35 [0.01, 8.45] |
| 29.3 Secondary prevention ‐ existing CVD | 4 | 2938 | Risk Ratio (M‐H, Random, 95% CI) | 1.04 [0.83, 1.29] |
| 30 CVD events ‐ subgroup by primary vs secondary prevention | 7 | 4962 | Risk Ratio (M‐H, Random, 95% CI) | 0.97 [0.81, 1.15] |
| 30.1 Primary prevention ‐ low or mod CVD risk | 3 | 2024 | Risk Ratio (M‐H, Random, 95% CI) | 0.80 [0.64, 1.00] |
| 30.2 Secondary prevention ‐ existing CVD | 4 | 2938 | Risk Ratio (M‐H, Random, 95% CI) | 1.04 [0.83, 1.29] |
| 31 CVD events ‐ subgroup by omega‐6 dose | 7 | 4962 | Risk Ratio (M‐H, Random, 95% CI) | 0.97 [0.81, 1.15] |
| 31.1 N‐6 < 4% E | 2 | 2144 | Risk Ratio (M‐H, Random, 95% CI) | 0.99 [0.90, 1.09] |
| 31.2 N‐6 4% to 12% E | 3 | 2371 | Risk Ratio (M‐H, Random, 95% CI) | 1.15 [0.61, 2.16] |
| 31.3 N‐6 > 12% E | 2 | 447 | Risk Ratio (M‐H, Random, 95% CI) | 0.95 [0.63, 1.42] |
| 32 CVD events ‐ subgroup by duration | 7 | 4962 | Risk Ratio (M‐H, Random, 95% CI) | 0.97 [0.81, 1.15] |
| 32.1 Medium duration 1 to < 2 years in study | 2 | 1178 | Risk Ratio (M‐H, Random, 95% CI) | 1.30 [0.22, 7.67] |
| 32.2 Medium‐long duration 2 to < 4 years | 2 | 2087 | Risk Ratio (M‐H, Random, 95% CI) | 1.00 [0.91, 1.09] |
| 32.3 Long duration 4+ years in study | 3 | 1697 | Risk Ratio (M‐H, Random, 95% CI) | 0.95 [0.68, 1.33] |
| 33 CVD events ‐ subgroup by baseline omega‐6 | 7 | 4962 | Risk Ratio (M‐H, Random, 95% CI) | 0.97 [0.81, 1.15] |
| 33.1 ≥ 8% E from n‐6 | 0 | 0 | Risk Ratio (M‐H, Random, 95% CI) | 0.0 [0.0, 0.0] |
| 33.2 5% to < 8% E from n‐6 | 2 | 2491 | Risk Ratio (M‐H, Random, 95% CI) | 1.18 [0.76, 1.85] |
| 33.3 < 5% E from n‐6 | 2 | 1913 | Risk Ratio (M‐H, Random, 95% CI) | 0.80 [0.64, 1.01] |
| 33.4 baseline n‐6 not reported | 3 | 558 | Risk Ratio (M‐H, Random, 95% CI) | 0.90 [0.67, 1.21] |
| 34 CVD events ‐ subgroup by sex | 7 | 4962 | Risk Ratio (M‐H, Random, 95% CI) | 0.97 [0.81, 1.15] |
| 34.1 Men only | 5 | 4797 | Risk Ratio (M‐H, Random, 95% CI) | 0.95 [0.78, 1.16] |
| 34.2 Men and women | 1 | 111 | Risk Ratio (M‐H, Random, 95% CI) | 0.35 [0.01, 8.45] |
| 34.3 Sex not reported | 1 | 54 | Risk Ratio (M‐H, Random, 95% CI) | 1.27 [0.72, 2.23] |
| 35 Coronary heart disease events (overall): myocardial infarction (fatal or non‐fatal) or angina | 7 | 3997 | Risk Ratio (M‐H, Random, 95% CI) | 0.88 [0.66, 1.17] |
| 36 CHD events ‐ sensitivity analysis by fixed‐effect analysis | 7 | 3997 | Risk Ratio (M‐H, Fixed, 95% CI) | 0.91 [0.82, 1.00] |
| 37 CHD events ‐ sensitivity analyses | 7 | Risk Ratio (M‐H, Random, 95% CI) | Subtotals only | |
| 37.1 Studies at low risk of bias | 1 | 458 | Risk Ratio (M‐H, Random, 95% CI) | 1.63 [1.00, 2.67] |
| 37.2 Pre‐2010 or prospective trials registry entry | 7 | 3997 | Risk Ratio (M‐H, Random, 95% CI) | 0.88 [0.66, 1.17] |
| 37.3 No commercial funding | 3 | 953 | Risk Ratio (M‐H, Random, 95% CI) | 0.78 [0.33, 1.82] |
| 37.4 Low risk of attention bias | 3 | 1011 | Risk Ratio (M‐H, Random, 95% CI) | 0.83 [0.62, 1.09] |
| 37.5 Randomised 250+ participants | 4 | 3730 | Risk Ratio (M‐H, Random, 95% CI) | 0.97 [0.78, 1.19] |
| 37.6 Randomised 100+ participants | 6 | 3943 | Risk Ratio (M‐H, Random, 95% CI) | 0.84 [0.61, 1.15] |
| 38 CHD events ‐ subgroup by LA or GLA | 7 | 3997 | Risk Ratio (M‐H, Random, 95% CI) | 0.88 [0.66, 1.17] |
| 38.1 Mainly LA | 6 | 3886 | Risk Ratio (M‐H, Random, 95% CI) | 0.88 [0.66, 1.19] |
| 38.2 GLA supplements | 1 | 111 | Risk Ratio (M‐H, Random, 95% CI) | 0.35 [0.01, 8.45] |
| 39 CHD events ‐ subgroup by intervention type | 7 | 3997 | Risk Ratio (M‐H, Random, 95% CI) | 0.88 [0.66, 1.17] |
| 39.1 Dietary advice | 3 | 2593 | Risk Ratio (M‐H, Random, 95% CI) | 0.78 [0.38, 1.61] |
| 39.2 Dietary advice plus supplement | 2 | 447 | Risk Ratio (M‐H, Random, 95% CI) | 1.02 [0.76, 1.38] |
| 39.3 Supplemental foods | 0 | 0 | Risk Ratio (M‐H, Random, 95% CI) | 0.0 [0.0, 0.0] |
| 39.4 Supplements (capsules) | 1 | 111 | Risk Ratio (M‐H, Random, 95% CI) | 0.35 [0.01, 8.45] |
| 39.5 Diet (all foods) provided | 1 | 846 | Risk Ratio (M‐H, Random, 95% CI) | 0.77 [0.56, 1.04] |
| 40 CHD events ‐ subgroup by replacement | 7 | Risk Ratio (M‐H, Random, 95% CI) | Subtotals only | |
| 40.1 N‐6 replacing SFA | 5 | 3832 | Risk Ratio (M‐H, Random, 95% CI) | 0.85 [0.61, 1.17] |
| 40.2 N‐6 replacing MUFA | 3 | 1358 | Risk Ratio (M‐H, Random, 95% CI) | 1.38 [1.07, 1.77] |
| 40.3 N‐6 replacing nil, low n‐6 | 1 | 111 | Risk Ratio (M‐H, Random, 95% CI) | 0.35 [0.01, 8.45] |
| 40.4 N‐6 replacement unclear | 1 | 393 | Risk Ratio (M‐H, Random, 95% CI) | 0.97 [0.69, 1.37] |
| 40.5 N‐6 replacing CHO | 1 | 102 | Risk Ratio (M‐H, Random, 95% CI) | 0.27 [0.14, 0.52] |
| 40.6 N‐6 replacing protein | 0 | 0 | Risk Ratio (M‐H, Random, 95% CI) | 0.0 [0.0, 0.0] |
| 41 CHD events ‐ subgroup by baseline CVD risk | 7 | 3997 | Risk Ratio (M‐H, Random, 95% CI) | 0.88 [0.66, 1.17] |
| 41.1 Primary prevention ‐ low CVD risk | 1 | 846 | Risk Ratio (M‐H, Random, 95% CI) | 0.77 [0.56, 1.04] |
| 41.2 Primary prevention ‐ moderate CVD risk | 2 | 213 | Risk Ratio (M‐H, Random, 95% CI) | 0.27 [0.14, 0.52] |
| 41.3 Secondary prevention ‐ existing CVD | 4 | 2938 | Risk Ratio (M‐H, Random, 95% CI) | 1.05 [0.84, 1.32] |
| 42 CHD events ‐ subgroup by omega‐6 dose | 7 | 3997 | Risk Ratio (M‐H, Random, 95% CI) | 0.88 [0.66, 1.17] |
| 42.1 N‐6 < 4% E | 2 | 2144 | Risk Ratio (M‐H, Random, 95% CI) | 0.93 [0.82, 1.05] |
| 42.2 N‐6 4% to 12% E | 3 | 1406 | Risk Ratio (M‐H, Random, 95% CI) | 0.72 [0.31, 1.64] |
| 42.3 N‐6 > 12% E | 2 | 447 | Risk Ratio (M‐H, Random, 95% CI) | 1.02 [0.76, 1.38] |
| 43 CHD events ‐ subgroup by duration | 7 | 3997 | Risk Ratio (M‐H, Random, 95% CI) | 0.88 [0.66, 1.17] |
| 43.1 Medium duration 1 to < 2 years in study | 1 | 111 | Risk Ratio (M‐H, Random, 95% CI) | 0.35 [0.01, 8.45] |
| 43.2 Medium‐long duration 2 to < 4 years | 2 | 2087 | Risk Ratio (M‐H, Random, 95% CI) | 0.94 [0.83, 1.05] |
| 43.3 Long duration 4+ years in study | 4 | 1799 | Risk Ratio (M‐H, Random, 95% CI) | 0.79 [0.46, 1.35] |
| 44 CHD events ‐ subgroup by baseline omega‐6 | 7 | 3997 | Risk Ratio (M‐H, Random, 95% CI) | 0.88 [0.66, 1.17] |
| 44.1 ≥ 8% E from n‐6 | 0 | 0 | Risk Ratio (M‐H, Random, 95% CI) | 0.0 [0.0, 0.0] |
| 44.2 5% to < 8% E from n‐6 | 2 | 2491 | Risk Ratio (M‐H, Random, 95% CI) | 1.17 [0.68, 2.01] |
| 44.3 < 5% E from n‐6 | 1 | 846 | Risk Ratio (M‐H, Random, 95% CI) | 0.77 [0.56, 1.04] |
| 44.4 Baseline omega 6 not reported | 4 | 660 | Risk Ratio (M‐H, Random, 95% CI) | 0.68 [0.31, 1.47] |
| 45 CHD events ‐ subgroup by sex | 7 | 3997 | Risk Ratio (M‐H, Random, 95% CI) | 0.88 [0.66, 1.17] |
| 45.1 Men only | 4 | 3730 | Risk Ratio (M‐H, Random, 95% CI) | 0.97 [0.78, 1.19] |
| 45.2 Women only | 0 | 0 | Risk Ratio (M‐H, Random, 95% CI) | 0.0 [0.0, 0.0] |
| 45.3 Men and women | 2 | 213 | Risk Ratio (M‐H, Random, 95% CI) | 0.27 [0.14, 0.52] |
| 45.4 Sex not reported | 1 | 54 | Risk Ratio (M‐H, Random, 95% CI) | 1.24 [0.63, 2.44] |
| 46 Major adverse cardiac and cerebrovascular events (MACCEs), overall | 2 | 2879 | Risk Ratio (M‐H, Random, 95% CI) | 0.84 [0.59, 1.20] |
| 47 MACCEs ‐ sensitivity analysis by fixed‐effect analysis | 2 | 2879 | Risk Ratio (M‐H, Fixed, 95% CI) | 0.92 [0.82, 1.04] |
| 48 MACCEs ‐ sensitivity analyses | 2 | Risk Ratio (M‐H, Random, 95% CI) | Subtotals only | |
| 48.1 Low risk of bias | 0 | 0 | Risk Ratio (M‐H, Random, 95% CI) | 0.0 [0.0, 0.0] |
| 48.2 Pre‐2010 or prospective trials registry entry | 2 | 2879 | Risk Ratio (M‐H, Random, 95% CI) | 0.84 [0.59, 1.20] |
| 48.3 No commercial funding | 0 | 0 | Risk Ratio (M‐H, Random, 95% CI) | 0.0 [0.0, 0.0] |
| 48.4 Low risk of attention bias | 1 | 846 | Risk Ratio (M‐H, Random, 95% CI) | 0.69 [0.51, 0.93] |
| 48.5 Randomised 250+ participants | 2 | 2879 | Risk Ratio (M‐H, Random, 95% CI) | 0.84 [0.59, 1.20] |
| 48.6 Randomised 100+ participants | 2 | 2879 | Risk Ratio (M‐H, Random, 95% CI) | 0.84 [0.59, 1.20] |
| 49 MACCEs ‐ subgroup by intervention type | 2 | 2879 | Risk Ratio (M‐H, Random, 95% CI) | 0.84 [0.59, 1.20] |
| 49.1 Dietary advice | 1 | 2033 | Risk Ratio (M‐H, Random, 95% CI) | 0.99 [0.87, 1.12] |
| 49.2 Supplements (capsules) | 0 | 0 | Risk Ratio (M‐H, Random, 95% CI) | 0.0 [0.0, 0.0] |
| 49.3 Supplemental foods | 0 | 0 | Risk Ratio (M‐H, Random, 95% CI) | 0.0 [0.0, 0.0] |
| 49.4 Dietary advice plus supplement | 0 | 0 | Risk Ratio (M‐H, Random, 95% CI) | 0.0 [0.0, 0.0] |
| 49.5 Diet (all foods) provided | 1 | 846 | Risk Ratio (M‐H, Random, 95% CI) | 0.69 [0.51, 0.93] |
| 50 MACCEs ‐ subgroup by replacement | 2 | Risk Ratio (M‐H, Random, 95% CI) | Subtotals only | |
| 50.1 N‐6 replacing SFA | 2 | 2879 | Risk Ratio (M‐H, Random, 95% CI) | 0.84 [0.59, 1.20] |
| 50.2 N‐6 replacing MUFA | 1 | 846 | Risk Ratio (M‐H, Random, 95% CI) | 0.69 [0.51, 0.93] |
| 50.3 N‐6 replacing nil, low n‐6 | 0 | 0 | Risk Ratio (M‐H, Random, 95% CI) | 0.0 [0.0, 0.0] |
| 50.4 N‐6 replacement unclear | 0 | 0 | Risk Ratio (M‐H, Random, 95% CI) | 0.0 [0.0, 0.0] |
| 50.5 N‐6 replacing CHO | 0 | 0 | Risk Ratio (M‐H, Random, 95% CI) | 0.0 [0.0, 0.0] |
| 50.6 N‐6 replacing protein | 0 | 0 | Risk Ratio (M‐H, Random, 95% CI) | 0.0 [0.0, 0.0] |
| 51 MACCEs ‐ subgroup by baseline CVD risk | 2 | 2879 | Risk Ratio (M‐H, Random, 95% CI) | 0.84 [0.59, 1.20] |
| 51.1 Primary prevention ‐ low CVD risk | 1 | 846 | Risk Ratio (M‐H, Random, 95% CI) | 0.69 [0.51, 0.93] |
| 51.2 Primary prevention ‐ moderate CVD risk | 0 | 0 | Risk Ratio (M‐H, Random, 95% CI) | 0.0 [0.0, 0.0] |
| 51.3 Secondary prevention ‐ existing CVD | 1 | 2033 | Risk Ratio (M‐H, Random, 95% CI) | 0.99 [0.87, 1.12] |
| 52 MACCEs ‐ subgroup by omega‐6 dose | 2 | 2879 | Risk Ratio (M‐H, Random, 95% CI) | 0.84 [0.59, 1.20] |
| 52.1 N‐6 < 4% E | 1 | 2033 | Risk Ratio (M‐H, Random, 95% CI) | 0.99 [0.87, 1.12] |
| 52.2 N‐6 4% to 12% E | 1 | 846 | Risk Ratio (M‐H, Random, 95% CI) | 0.69 [0.51, 0.93] |
| 52.3 N‐6 > 12% E | 0 | 0 | Risk Ratio (M‐H, Random, 95% CI) | 0.0 [0.0, 0.0] |
| 53 MACCEs ‐ subgroup by duration | 2 | 2879 | Risk Ratio (M‐H, Random, 95% CI) | 0.84 [0.59, 1.20] |
| 53.1 Medium duration 1 to < 2 years in study | 0 | 0 | Risk Ratio (M‐H, Random, 95% CI) | 0.0 [0.0, 0.0] |
| 53.2 Medium‐long duration 2 to < 4 years | 1 | 2033 | Risk Ratio (M‐H, Random, 95% CI) | 0.99 [0.87, 1.12] |
| 53.3 Long duration 4+ years in study | 1 | 846 | Risk Ratio (M‐H, Random, 95% CI) | 0.69 [0.51, 0.93] |
| 54 MACCEs ‐ subgroup by baseline omega‐6 | 2 | 2879 | Risk Ratio (M‐H, Random, 95% CI) | 0.84 [0.59, 1.20] |
| 54.1 ≥ 8% E from n‐6 | 0 | 0 | Risk Ratio (M‐H, Random, 95% CI) | 0.0 [0.0, 0.0] |
| 54.2 5% to < 8% E from n‐6 | 1 | 2033 | Risk Ratio (M‐H, Random, 95% CI) | 0.99 [0.87, 1.12] |
| 54.3 < 5% E from n‐6 | 1 | 846 | Risk Ratio (M‐H, Random, 95% CI) | 0.69 [0.51, 0.93] |
| 54.4 Baseline n‐6 not reported | 0 | 0 | Risk Ratio (M‐H, Random, 95% CI) | 0.0 [0.0, 0.0] |
| 55 Stroke: fatal or non‐fatal (overall) | 4 | 3730 | Risk Ratio (M‐H, Random, 95% CI) | 1.36 [0.45, 4.11] |
| 56 Stroke ‐ sensitivity analysis by fixed‐effect analysis | 4 | 3730 | Risk Ratio (M‐H, Fixed, 95% CI) | 1.00 [0.59, 1.68] |
| 57 Stroke ‐ sensitivity analyses | 4 | Risk Ratio (M‐H, Random, 95% CI) | Subtotals only | |
| 57.1 Low risk of bias | 1 | 458 | Risk Ratio (M‐H, Random, 95% CI) | 1.07 [0.15, 7.55] |
| 57.2 Pre‐2010 or prospective trials registry entry | 4 | 3730 | Risk Ratio (M‐H, Random, 95% CI) | 1.36 [0.45, 4.11] |
| 57.3 No commercial funding | 2 | 851 | Risk Ratio (M‐H, Random, 95% CI) | 1.67 [0.32, 8.62] |
| 57.4 Low risk of attention bias | 1 | 846 | Risk Ratio (M‐H, Random, 95% CI) | 0.59 [0.30, 1.15] |
| 57.5 Randomised 250+ participants | 4 | 3730 | Risk Ratio (M‐H, Random, 95% CI) | 1.36 [0.45, 4.11] |
| 57.6 Randomised 100+ participants | 4 | 3730 | Risk Ratio (M‐H, Random, 95% CI) | 1.36 [0.45, 4.11] |
| 58 Stroke ‐ subgroup by intervention type | 4 | 3730 | Risk Ratio (M‐H, Random, 95% CI) | 1.36 [0.45, 4.11] |
| 58.1 Dietary advice | 2 | 2491 | Risk Ratio (M‐H, Random, 95% CI) | 2.36 [0.81, 6.91] |
| 58.2 Supplements (capsules) | 0 | 0 | Risk Ratio (M‐H, Random, 95% CI) | 0.0 [0.0, 0.0] |
| 58.3 Supplemental foods | 0 | 0 | Risk Ratio (M‐H, Random, 95% CI) | 0.0 [0.0, 0.0] |
| 58.4 Dietary advice plus supplement | 1 | 393 | Risk Ratio (M‐H, Random, 95% CI) | 4.88 [0.24, 100.89] |
| 58.5 Diet (all foods) provided | 1 | 846 | Risk Ratio (M‐H, Random, 95% CI) | 0.59 [0.30, 1.15] |
| 59 Stroke ‐ subgroup by replacement | 4 | Risk Ratio (M‐H, Random, 95% CI) | Subtotals only | |
| 59.1 N‐6 replacing SFA | 4 | 3730 | Risk Ratio (M‐H, Random, 95% CI) | 1.36 [0.45, 4.11] |
| 59.2 N‐6 replacing MUFA | 2 | 1304 | Risk Ratio (M‐H, Random, 95% CI) | 0.63 [0.33, 1.18] |
| 59.3 N‐6 replacing nil, low n‐6 | 0 | 0 | Risk Ratio (M‐H, Random, 95% CI) | 0.0 [0.0, 0.0] |
| 59.4 N‐6 replacement unclear | 1 | 393 | Risk Ratio (M‐H, Random, 95% CI) | 4.88 [0.24, 100.89] |
| 59.5 N‐6 replacing CHO | 0 | 0 | Risk Ratio (M‐H, Random, 95% CI) | 0.0 [0.0, 0.0] |
| 59.6 N‐6 replacing protein | 0 | 0 | Risk Ratio (M‐H, Random, 95% CI) | 0.0 [0.0, 0.0] |
| 60 Stroke ‐ subgroup by baseline CVD risk | 4 | 3730 | Risk Ratio (M‐H, Random, 95% CI) | 1.36 [0.45, 4.11] |
| 60.1 Primary prevention ‐ low CVD risk | 1 | 846 | Risk Ratio (M‐H, Random, 95% CI) | 0.59 [0.30, 1.15] |
| 60.2 Primary prevention ‐ moderate CVD risk | 0 | 0 | Risk Ratio (M‐H, Random, 95% CI) | 0.0 [0.0, 0.0] |
| 60.3 Secondary prevention ‐ existing CVD | 3 | 2884 | Risk Ratio (M‐H, Random, 95% CI) | 2.56 [0.93, 7.04] |
| 61 Stroke ‐ subgroup by omega‐6 dose | 4 | 3730 | Risk Ratio (M‐H, Random, 95% CI) | 1.36 [0.45, 4.11] |
| 61.1 N‐6 < 4% E | 1 | 2033 | Risk Ratio (M‐H, Random, 95% CI) | 3.32 [0.92, 12.04] |
| 61.2 N‐6 ≥ 4% to < 12% E | 2 | 1304 | Risk Ratio (M‐H, Random, 95% CI) | 0.63 [0.33, 1.18] |
| 61.3 N‐6 ≥ 12% E | 1 | 393 | Risk Ratio (M‐H, Random, 95% CI) | 4.88 [0.24, 100.89] |
| 62 Stroke ‐ subgroup by duration | 4 | 3730 | Risk Ratio (M‐H, Random, 95% CI) | 1.36 [0.45, 4.11] |
| 62.1 Medium duration 1 to < 2 years in study | 0 | 0 | Risk Ratio (M‐H, Random, 95% CI) | 0.0 [0.0, 0.0] |
| 62.2 Medium‐long duration 2 to < 4 years | 1 | 2033 | Risk Ratio (M‐H, Random, 95% CI) | 3.32 [0.92, 12.04] |
| 62.3 Long duration 4+ years in study | 3 | 1697 | Risk Ratio (M‐H, Random, 95% CI) | 0.69 [0.36, 1.33] |
| 63 Stroke ‐ subgroup by baseline omega‐6 | 4 | 3730 | Risk Ratio (M‐H, Random, 95% CI) | 1.36 [0.45, 4.11] |
| 63.1 ≥ 8% E from n‐6 | 0 | 0 | Risk Ratio (M‐H, Random, 95% CI) | 0.0 [0.0, 0.0] |
| 63.2 5% to < 8% E from n‐6 | 2 | 2491 | Risk Ratio (M‐H, Random, 95% CI) | 2.36 [0.81, 6.91] |
| 63.3 < 5% E from n‐6 | 1 | 846 | Risk Ratio (M‐H, Random, 95% CI) | 0.59 [0.30, 1.15] |
| 63.4 Baseline n‐6 not reported | 1 | 393 | Risk Ratio (M‐H, Random, 95% CI) | 4.88 [0.24, 100.89] |
| 64 Stroke ‐ subgroup by stroke type | 1 | 4066 | Risk Ratio (M‐H, Random, 95% CI) | 2.93 [0.64, 13.49] |
| 64.1 Ischaemic stroke | 1 | 2033 | Risk Ratio (M‐H, Random, 95% CI) | 6.98 [0.86, 56.62] |
| 64.2 Haemorrhagic stroke | 1 | 2033 | Risk Ratio (M‐H, Random, 95% CI) | 1.50 [0.25, 8.93] |
| 65 Stroke ‐ subgroup by fatality | 2 | Risk Ratio (M‐H, Random, 95% CI) | Subtotals only | |
| 65.1 Fatal stroke | 2 | 1304 | Risk Ratio (M‐H, Random, 95% CI) | 0.48 [0.16, 1.40] |
| 65.2 Non‐fatal stroke | 1 | 846 | Risk Ratio (M‐H, Random, 95% CI) | 0.77 [0.34, 1.73] |
1.59. Analysis.
Comparison 1 Primary outcomes ‐ higher omega‐6 vs lower omega‐6, Outcome 59 Stroke ‐ subgroup by replacement.
Comparison 2. Secondary outcomes ‐ higher omega‐6 vs lower omega‐6.
| Outcome or subgroup title | No. of studies | No. of participants | Statistical method | Effect size |
|---|---|---|---|---|
| 1 Myocardial infarction (MI), overall | 7 | 4606 | Risk Ratio (M‐H, Random, 95% CI) | 0.88 [0.76, 1.02] |
| 2 MI ‐ sensitivity analysis by fixed‐effect analysis | 7 | 4606 | Risk Ratio (M‐H, Fixed, 95% CI) | 0.87 [0.75, 1.00] |
| 3 MI ‐ sensitivity analyses | 7 | Risk Ratio (M‐H, Random, 95% CI) | Subtotals only | |
| 3.1 Low summary risk of bias | 1 | 1067 | Risk Ratio (M‐H, Random, 95% CI) | 1.88 [0.21, 16.75] |
| 3.2 Pre‐2010 or prospective trials registry entry | 7 | 4606 | Risk Ratio (M‐H, Random, 95% CI) | 0.88 [0.76, 1.02] |
| 3.3 No commercial funding | 3 | 1562 | Risk Ratio (M‐H, Random, 95% CI) | 0.76 [0.22, 2.65] |
| 3.4 Low risk of attention bias | 4 | 2078 | Risk Ratio (M‐H, Random, 95% CI) | 0.89 [0.62, 1.28] |
| 3.5 Randomised 250+ participants | 4 | 4339 | Risk Ratio (M‐H, Random, 95% CI) | 0.88 [0.76, 1.02] |
| 3.6 Randomised 100+ participants | 6 | 4552 | Risk Ratio (M‐H, Random, 95% CI) | 0.87 [0.75, 1.01] |
| 4 MI ‐ subgroup by intervention type | 7 | 4606 | Risk Ratio (M‐H, Random, 95% CI) | 0.88 [0.76, 1.02] |
| 4.1 Dietary advice | 2 | 2135 | Risk Ratio (M‐H, Random, 95% CI) | 0.40 [0.04, 3.75] |
| 4.2 Supplements (capsules) | 1 | 111 | Risk Ratio (M‐H, Random, 95% CI) | 0.35 [0.01, 8.45] |
| 4.3 Supplemental foods | 0 | 0 | Risk Ratio (M‐H, Random, 95% CI) | 0.0 [0.0, 0.0] |
| 4.4 Dietary advice plus supplement | 2 | 447 | Risk Ratio (M‐H, Random, 95% CI) | 0.99 [0.69, 1.42] |
| 4.5 Diet (all foods) provided | 2 | 1913 | Risk Ratio (M‐H, Random, 95% CI) | 0.84 [0.56, 1.27] |
| 5 MI ‐ subgroup by replacement | 7 | Risk Ratio (M‐H, Random, 95% CI) | Subtotals only | |
| 5.1 N‐6 replacing SFA | 5 | 4441 | Risk Ratio (M‐H, Random, 95% CI) | 0.87 [0.75, 1.01] |
| 5.2 N‐6 replacing MUFA | 3 | 1967 | Risk Ratio (M‐H, Random, 95% CI) | 0.90 [0.62, 1.30] |
| 5.3 N‐6 replacing nil, low n‐6 | 1 | 111 | Risk Ratio (M‐H, Random, 95% CI) | 0.35 [0.01, 8.45] |
| 5.4 N‐6 replacement unclear | 1 | 393 | Risk Ratio (M‐H, Random, 95% CI) | 0.95 [0.64, 1.41] |
| 5.5 N‐6 replacing CHO | 1 | 102 | Risk Ratio (M‐H, Random, 95% CI) | 0.08 [0.00, 1.33] |
| 5.6 N‐6 replacing protein | 0 | 0 | Risk Ratio (M‐H, Random, 95% CI) | 0.0 [0.0, 0.0] |
| 6 MI ‐ subgroup by baseline CVD risk | 7 | 4606 | Risk Ratio (M‐H, Random, 95% CI) | 0.88 [0.76, 1.02] |
| 6.1 Primary prevention ‐ low CVD risk | 2 | 1913 | Risk Ratio (M‐H, Random, 95% CI) | 0.84 [0.56, 1.27] |
| 6.2 Primary prevention ‐ moderate CVD risk | 2 | 213 | Risk Ratio (M‐H, Random, 95% CI) | 0.15 [0.02, 1.26] |
| 6.3 Secondary prevention ‐ existing CVD | 3 | 2480 | Risk Ratio (M‐H, Random, 95% CI) | 0.89 [0.77, 1.04] |
| 7 MI ‐ subgroup by omega‐6 dose | 7 | 4606 | Risk Ratio (M‐H, Random, 95% CI) | 0.88 [0.76, 1.02] |
| 7.1 N‐6 < 4% E | 2 | 2144 | Risk Ratio (M‐H, Random, 95% CI) | 0.87 [0.73, 1.03] |
| 7.2 N‐6 4% to 12% E | 3 | 2015 | Risk Ratio (M‐H, Random, 95% CI) | 0.70 [0.21, 2.29] |
| 7.3 N‐6 > 12% E | 2 | 447 | Risk Ratio (M‐H, Random, 95% CI) | 0.99 [0.69, 1.42] |
| 8 MI ‐ subgroup by duration | 7 | 4606 | Risk Ratio (M‐H, Random, 95% CI) | 0.88 [0.76, 1.02] |
| 8.1 Medium duration 1 to < 2 years in study | 2 | 1178 | Risk Ratio (M‐H, Random, 95% CI) | 1.10 [0.18, 6.65] |
| 8.2 Medium‐long duration 2 to < 4 years in study | 2 | 2087 | Risk Ratio (M‐H, Random, 95% CI) | 0.88 [0.75, 1.04] |
| 8.3 Long duration 4+ years in study | 3 | 1341 | Risk Ratio (M‐H, Random, 95% CI) | 0.84 [0.55, 1.27] |
| 9 MI ‐ subgroup by statin use | 7 | 4606 | Risk Ratio (M‐H, Random, 95% CI) | 0.88 [0.76, 1.02] |
| 9.1 ≥ 50% of control group on statins | 0 | 0 | Risk Ratio (M‐H, Random, 95% CI) | 0.0 [0.0, 0.0] |
| 9.2 < 50% of control group on statins | 6 | 4495 | Risk Ratio (M‐H, Random, 95% CI) | 0.88 [0.76, 1.02] |
| 9.3 Statin use unclear | 1 | 111 | Risk Ratio (M‐H, Random, 95% CI) | 0.35 [0.01, 8.45] |
| 10 MI ‐ subgroup by baseline omega‐6 | 7 | 4606 | Risk Ratio (M‐H, Random, 95% CI) | 0.88 [0.76, 1.02] |
| 10.1 ≥ 8% E from n‐6 | 0 | 0 | Risk Ratio (M‐H, Random, 95% CI) | 0.0 [0.0, 0.0] |
| 10.2 5% to < 8% E from n‐6 | 1 | 2033 | Risk Ratio (M‐H, Random, 95% CI) | 0.87 [0.74, 1.04] |
| 10.3 < 5% E from omega 6 | 2 | 1913 | Risk Ratio (M‐H, Random, 95% CI) | 0.84 [0.56, 1.27] |
| 10.4 Baseline n‐6 not reported | 4 | 660 | Risk Ratio (M‐H, Random, 95% CI) | 0.90 [0.52, 1.57] |
| 11 MI ‐ subgroup by sex | 7 | 4606 | Risk Ratio (M‐H, Random, 95% CI) | 0.88 [0.76, 1.02] |
| 11.1 Men and women | 2 | 213 | Risk Ratio (M‐H, Random, 95% CI) | 0.15 [0.02, 1.26] |
| 11.2 Sex not reported | 1 | 54 | Risk Ratio (M‐H, Random, 95% CI) | 1.19 [0.52, 2.74] |
| 11.3 Men only | 4 | 4339 | Risk Ratio (M‐H, Random, 95% CI) | 0.88 [0.76, 1.02] |
| 12 Angina | 4 | 1395 | Risk Ratio (M‐H, Random, 95% CI) | 0.61 [0.27, 1.40] |
| 13 Sudden cardiac death | 3 | 1293 | Risk Ratio (M‐H, Random, 95% CI) | 0.79 [0.49, 1.29] |
| 14 Heart failure | 2 | 2426 | Risk Ratio (M‐H, Random, 95% CI) | 0.66 [0.19, 2.35] |
| 15 Revascularisation ‐ angioplasty or coronary artery bypass grafting | 1 | 200 | Risk Ratio (M‐H, Random, 95% CI) | 1.0 [0.14, 6.96] |
| 16 Peripheral arterial disease events | 3 | 3946 | Risk Ratio (M‐H, Random, 95% CI) | 1.01 [0.60, 1.70] |
| 17 Serum total cholesterol (TC), mmol/L | 10 | 4280 | Mean Difference (IV, Random, 95% CI) | ‐0.33 [‐0.50, ‐0.16] |
| 18 TC, mmol/L ‐ sensitivity analysis by fixed‐effect analysis | 10 | 4280 | Mean Difference (IV, Fixed, 95% CI) | ‐0.35 [‐0.41, ‐0.29] |
| 19 TC, mmol/L ‐ sensitivity analyses | 10 | Mean Difference (IV, Random, 95% CI) | Subtotals only | |
| 19.1 Studies at low risk of bias | 3 | 1179 | Mean Difference (IV, Random, 95% CI) | ‐0.54 [‐0.82, ‐0.26] |
| 19.2 Pre‐2010 or prospective trials registry entry | 9 | 4090 | Mean Difference (IV, Random, 95% CI) | ‐0.38 [‐0.55, ‐0.22] |
| 19.3 No commercial funding | 6 | 1506 | Mean Difference (IV, Random, 95% CI) | ‐0.41 [‐0.66, ‐0.16] |
| 19.4 Low risk of attention bias | 6 | 1834 | Mean Difference (IV, Random, 95% CI) | ‐0.33 [‐0.64, ‐0.02] |
| 19.5 Randomised 250+ participants | 5 | 3813 | Mean Difference (IV, Random, 95% CI) | ‐0.35 [‐0.47, ‐0.23] |
| 19.6 Randomised 100+ participants | 7 | 4104 | Mean Difference (IV, Random, 95% CI) | ‐0.37 [‐0.56, ‐0.18] |
| 20 TC, mmol/L ‐ subgroup by intervention type | 10 | Mean Difference (IV, Random, 95% CI) | Subtotals only | |
| 20.1 Dietary advice | 3 | 2269 | Mean Difference (IV, Random, 95% CI) | ‐0.29 [‐0.38, ‐0.20] |
| 20.2 Supplements (capsules) | 0 | 0 | Mean Difference (IV, Random, 95% CI) | 0.0 [0.0, 0.0] |
| 20.3 Supplemental foods | 1 | 190 | Mean Difference (IV, Random, 95% CI) | 0.06 [‐0.22, 0.34] |
| 20.4 Dietary advice plus supplement | 3 | 257 | Mean Difference (IV, Random, 95% CI) | ‐0.04 [‐0.63, 0.55] |
| 20.5 Diet (all foods) provided | 3 | 1564 | Mean Difference (IV, Random, 95% CI) | ‐0.58 [‐0.91, ‐0.26] |
| 21 TC, mmol/L ‐ subgroup by replacement | 10 | Mean Difference (IV, Random, 95% CI) | Subtotals only | |
| 21.1 N‐6 replacing SFA | 8 | 4200 | Mean Difference (IV, Random, 95% CI) | ‐0.38 [‐0.56, ‐0.21] |
| 21.2 N‐6 replacing MUFA | 5 | 2048 | Mean Difference (IV, Random, 95% CI) | ‐0.51 [‐0.72, ‐0.29] |
| 21.3 N‐6 replacing nil, low n‐6 | 0 | 0 | Mean Difference (IV, Random, 95% CI) | 0.0 [0.0, 0.0] |
| 21.4 N‐6 replacement unclear | 2 | 231 | Mean Difference (IV, Random, 95% CI) | 0.16 [‐0.18, 0.50] |
| 21.5 N‐6 replacing CHO | 1 | 96 | Mean Difference (IV, Random, 95% CI) | ‐0.47 [‐0.76, ‐0.18] |
| 21.6 N‐6 replacing protein | 0 | 0 | Mean Difference (IV, Random, 95% CI) | 0.0 [0.0, 0.0] |
| 22 TC, mmol/L ‐ subgroup by baseline CVD risk | 10 | Mean Difference (IV, Random, 95% CI) | Subtotals only | |
| 22.1 Primary prevention ‐ low CVD risk | 4 | 1618 | Mean Difference (IV, Random, 95% CI) | ‐0.41 [‐0.77, ‐0.05] |
| 22.2 Primary prevention ‐ moderate CVD risk | 1 | 96 | Mean Difference (IV, Random, 95% CI) | ‐0.47 [‐0.76, ‐0.18] |
| 22.3 Secondary prevention ‐ existing CVD | 5 | 2566 | Mean Difference (IV, Random, 95% CI) | ‐0.21 [‐0.37, ‐0.06] |
| 23 TC, mmol/L ‐ subgroup by omega‐6 dose | 10 | Mean Difference (IV, Random, 95% CI) | Subtotals only | |
| 23.1 N‐6 < 4% E | 2 | 1769 | Mean Difference (IV, Random, 95% CI) | ‐0.08 [‐0.49, 0.32] |
| 23.2 N‐6 4% to 12% E | 4 | 2017 | Mean Difference (IV, Random, 95% CI) | ‐0.42 [‐0.51, ‐0.34] |
| 23.3 N‐6 > 12% E | 4 | 494 | Mean Difference (IV, Random, 95% CI) | ‐0.44 [‐1.20, 0.31] |
| 24 TC, mmol/L ‐ subgroup by duration | 10 | Mean Difference (IV, Random, 95% CI) | Subtotals only | |
| 24.1 Medium duration 1 to < 2 years in study | 3 | 775 | Mean Difference (IV, Random, 95% CI) | ‐0.41 [‐0.87, 0.04] |
| 24.2 Medium‐long duration 2 to < 4 years | 3 | 1931 | Mean Difference (IV, Random, 95% CI) | ‐0.16 [‐0.43, 0.10] |
| 24.3 Long duration 4+ years in study | 4 | 1574 | Mean Difference (IV, Random, 95% CI) | ‐0.36 [‐0.52, ‐0.20] |
| 25 TC, mmol/L ‐ subgroup by statin use | 10 | Mean Difference (IV, Random, 95% CI) | Subtotals only | |
| 25.1 ≥ 50% of control group on statins | 1 | 190 | Mean Difference (IV, Random, 95% CI) | 0.06 [‐0.22, 0.34] |
| 25.2 < 50% of control group on statins | 9 | 4090 | Mean Difference (IV, Random, 95% CI) | ‐0.38 [‐0.55, ‐0.22] |
| 25.3 Statin use unclear | 0 | 0 | Mean Difference (IV, Random, 95% CI) | 0.0 [0.0, 0.0] |
| 26 TC, mmol/L ‐ subgroup by baseline omega‐6 | 10 | Mean Difference (IV, Random, 95% CI) | Subtotals only | |
| 26.1 ≥ 8% E from n‐6 | 0 | 0 | Mean Difference (IV, Random, 95% CI) | 0.0 [0.0, 0.0] |
| 26.2 5% to < 8% E from n‐6 | 2 | 2173 | Mean Difference (IV, Random, 95% CI) | ‐0.27 [‐0.36, ‐0.17] |
| 26.3 < 5% E from n‐6 | 3 | 1564 | Mean Difference (IV, Random, 95% CI) | ‐0.58 [‐0.91, ‐0.26] |
| 26.4 Baseline n‐6 not reported | 5 | 543 | Mean Difference (IV, Random, 95% CI) | ‐0.13 [‐0.48, 0.21] |
| 27 TC, mmol/L ‐ subgroup by sex | 10 | Mean Difference (IV, Random, 95% CI) | Subtotals only | |
| 27.1 Men and women | 3 | 340 | Mean Difference (IV, Random, 95% CI) | ‐0.09 [‐0.47, 0.30] |
| 27.2 Sex not reported | 1 | 26 | Mean Difference (IV, Random, 95% CI) | ‐0.49 [‐1.34, 0.36] |
| 27.3 Men only | 6 | 3914 | Mean Difference (IV, Random, 95% CI) | ‐0.44 [‐0.63, ‐0.26] |
| 28 Serum triglycerides (TG), mmol/L | 5 | 834 | Mean Difference (IV, Random, 95% CI) | ‐0.01 [‐0.23, 0.21] |
| 29 Low‐density lipoprotein (LDL), mmol/L | 2 | 244 | Mean Difference (IV, Random, 95% CI) | ‐0.04 [‐0.21, 0.14] |
| 30 High‐density lipoprotein (HDL), mmol/L | 4 | 1995 | Mean Difference (IV, Random, 95% CI) | ‐0.01 [‐0.03, 0.02] |
| 31 Body weight, kg | 4 | 358 | Mean Difference (IV, Random, 95% CI) | ‐3.12 [‐12.60, 6.36] |
| 32 Body mass index, kg/m2 | 1 | 371 | Mean Difference (IV, Random, 95% CI) | ‐0.20 [‐0.56, 0.16] |
| 33 Fat weight, kg | 1 | 30 | Mean Difference (IV, Random, 95% CI) | ‐7.70 [‐14.60, ‐0.80] |
Comparison 3. Tertiary outcomes ‐ higher omega‐6 vs lower omega‐6.
| Outcome or subgroup title | No. of studies | No. of participants | Statistical method | Effect size |
|---|---|---|---|---|
| 1 BP ‐ systolic and diastolic blood pressure, mmHg | 2 | Mean Difference (IV, Random, 95% CI) | Subtotals only | |
| 1.1 sBP ‐ systolic blood pressure, mmHg | 2 | 635 | Mean Difference (IV, Random, 95% CI) | ‐1.10 [‐4.05, 1.85] |
| 1.2 dBP ‐ diastolic blood pressure | 2 | 635 | Mean Difference (IV, Random, 95% CI) | ‐0.30 [‐2.04, 1.44] |
| 2 Dropouts | 7 | 1425 | Risk Ratio (M‐H, Random, 95% CI) | 0.94 [0.52, 1.72] |
| 3 Other serious adverse events | 4 | Risk Ratio (M‐H, Random, 95% CI) | Subtotals only | |
| 3.1 Pulmonary embolism | 2 | 2087 | Risk Ratio (M‐H, Random, 95% CI) | 2.15 [0.48, 9.57] |
| 3.2 Multiple Sclerosis worsened or had acute attack ‐ GLA supplement | 2 | 268 | Risk Ratio (M‐H, Random, 95% CI) | 1.11 [0.95, 1.30] |
Characteristics of studies
Characteristics of included studies [ordered by study ID]
Bates 1977.
| Methods | RCT, parallel, 4 arms (n‐6 GLA + LA vs MUFA using either margarines or supplements), 2 years Summary risk of bias: moderate to high |
|
| Participants | People with chronic progressive multiple sclerosis CVD risk: low Intervention A, C: 38 per arm Control B, D: 38 per arm Mean years in trial: 2 % male: unclear (quote: "no statistically significant difference between groups") Age: unclear (quote: "no statistically significant difference between groups") Age range: unclear Smokers: unclear Hypertension: unclear Medications taken by at least 50% of those in the control group: not reported Medications taken by 20%‐49% of those in the control group: not reported Medications taken by some, but less than 20% of the control group: not reported Location: UK Ethnicity: not reported |
|
| Interventions | Type: supplement Comparison: GLA + linoleic (n‐6) vs oleic (MUFA) Intervention aims A: increase polyunsaturated fats with addition of 8 × 0.6 mL/d of evening primrose oil (Naudicelle) in capsules (360 mg/d GLA plus 3.42 g/d linoleic acid plus < 1% ALA) Control aims B: increase monounsaturated fats with addition of 8 × 0.6mL/d of oleic acid in capsules (4.8 g oleic acid/d) A vs B dose aim: increase 0.34 g/d GLA, 3.78 g/d or 34 kcal or 1.7% E n‐6 Intervention aims C: increase linoleic acid with addition of 11.5 g/d in a spread Control aims D: increase oleic acid with addition of 4 g/d in a spread C vs D dose aim: increase 11.5 g/d or 104 kcal or 5% E n‐6 Baseline n‐6: unclear Compliance by biomarkers: unclear, no serum total cholesterol reported, no tissue fatty acids reported Compliance by dietary intake assessment: unclear, not reported
Duration of intervention: 2 years |
|
| Outcomes | Main study outcome: progression or regression of multiple sclerosis (MS) Dropouts: A, 4; B, 7; C, 3; D, 4. (reported as died/withdrawn and not separated) Available outcomes: MS progression (deaths clearly occurred, but reported with dropouts (not separated) and the author did not have access to the data any longer) |
|
| Notes | Study funding: Multiple Sclerosis Society, Van den Berghs provided intervention and control spreads free. Response to contact: yes, Prof Bates states that data on mortality are no longer available. Similar reply from Prof Robert Dworkin (who used Professor Bates' data later for a joint publication) |
|
| Risk of bias | ||
| Bias | Authors' judgement | Support for judgement |
| Random sequence generation (selection bias) | Unclear risk | Quote: "randomly allocated" |
| Allocation concealment (selection bias) | Unclear risk | Not reported |
| Blinding of participants and personnel (performance bias) All outcomes | Low risk | Paper states "double blind", capsules of "identical appearance" and "similar spread" |
| Blinding of outcome assessment (detection bias) All outcomes | Unclear risk | Paper states "double blind" with no further details |
| Incomplete outcome data (attrition bias) All outcomes | Unclear risk | Deaths and dropouts combined; no reasons for dropping out provided |
| Selective reporting (reporting bias) | Unclear risk | No protocol or trials registry entry located |
| Attention Bias | Low risk | Capsules and spreads provided to all participants; no suggestion of attention bias |
| Compliance | Unclear risk | Not reported |
| Other bias | Low risk | None found |
Bates 1978.
| Methods | RCT, parallel, 4 arms (n‐6 GLA + LA vs MUFA and n‐6 LA vs MUFA), 2 years Summary risk of bias: moderate to high |
|
| Participants | People with acute remitting multiple sclerosis CVD risk: low Intervention A, C: 29 per arm Control B, D: 29 per arm Mean years in trial: 2 % male: intervention A 34.48%; intervention C 17.24%; control B 34.48%; control D 37.93% Mean age (SD) in years: intervention A 35 (9); intervention C 34 (8); control B 32 (7); control D 33 (5) Age range: unclear Smokers: unclear Hypertension: unclear Medications taken by at least 50% of those in the control group: not reported Medications taken by 20%‐49% of those in the control group: not reported Medications taken by some, but less than 20% of the control group: not reported Location: UK Ethnicity: not reported |
|
| Interventions | Type: Supplement Comparison: GLA and linoleic (n‐6) vs oleic (MUFA) Intervention aims A: 8 × evening primrose oil capsules (Naudicelle)/d, 2.92 g/d LA plus 0.34 g/d GLA Control aims B: 8 × capsules/d (4 g/d oleic acid), 4 g/d MUFA A vs B dose aim: increase 0.34 g/d GLA, 3.26 g/d or 29 kcal or 1.5% E n‐6 Intervention aims C: linoleic acid spread (23 g/d linoleic acid) Control aims D: oleic acid spread (16 g/d oleic acid) C vs D dose aim: increase 23 g/d LA or 207 kcal or 10.4% E n‐6 Baseline n‐6: unclear Compliance by biomarkers: good for C vs D, poor for A vs B, no serum total cholesterol reported, "estimations of total fatty acids in patients before and after 12‐24 months' treatment showed that the percentage of linoleic and arachidonic acids increased significantly only in those patients taking the linoleic acid spread (group C)". Compliance by dietary intake: unclear, not reported
Duration of intervention: 2 years |
|
| Outcomes | Main study outcome: progression or regression of multiple sclerosis Dropouts: A 0, B 1, C 3, D 6 Available outcomes: MS progression, deaths (no deaths in arms A, C and D, so only A vs B has usable outcome data) |
|
| Notes | Study funding: Multiple Sclerosis Society, Van den Berghs provided intervention and control spreads free Response to contact: yes, Prof Bates stated that the data are no longer available. Similar reply from Prof Robert Dworkin (who used Professor Bates' data later for a joint publication). |
|
| Risk of bias | ||
| Bias | Authors' judgement | Support for judgement |
| Random sequence generation (selection bias) | Unclear risk | Quote: "randomly allocated" |
| Allocation concealment (selection bias) | Unclear risk | Quote: "randomly allocated" |
| Blinding of participants and personnel (performance bias) All outcomes | Low risk | Paper states "double blind", capsules of "identical appearance" and "similar spread" |
| Blinding of outcome assessment (detection bias) All outcomes | Unclear risk | Paper states "double blind" with no further details |
| Incomplete outcome data (attrition bias) All outcomes | Low risk | Fairly well described, from 0 to 6 dropouts per arm over 2 years (each 29 randomised) |
| Selective reporting (reporting bias) | Unclear risk | No protocol or trials registry entry located |
| Attention Bias | Low risk | Capsules and spreads provided to all participants, no suggestion of attention bias |
| Compliance | High risk | A vs B compliance poor by biomarkers |
| Other bias | Low risk | None found |
Belch 1988.
| Methods | RCT, parallel, 2 arms (n‐6 evening primrose oil vs non‐fat paraffin), 12 months Summary risk of bias: moderate to high |
|
| Participants | People with rheumatoid arthritis (RA) CVD risk: low Intervention 16 randomised, 16 analysed Control 18 randomised, 18 analysed Mean years in trial: 1 % male: intervention 6%; control 6% Age, years: intervention median 46 years, control 48 years Age range: intervention 35‐68 years, control 30‐74 years Smokers: unclear Hypertension: unclear Medications taken by at least 50% of those in the control group: NSAIDs Medications taken by 20%‐49% of those in the control group: not reported Medications taken by some, but less than 20% of the control group: not reported Location: UK Ethnicity: not reported |
|
| Interventions | Type: supplement Comparison: GLA (n‐6) vs non‐fat Intervention aims: 12 capsules of evening primrose oil (Efamol), including 540 mg of gamma linolenic acid (GLA) per day Control aims B: 12 capsules of liquid paraffin per day Dose aim: increase 0.54 g/d GLA, 5 kcal or 0.25% E GLA, assume 70% LA*, 4.2 g/d or 37.8 kcal/d or 1.9% E LA, 2.2% E n‐6 Baseline n‐6: unclear Compliance by biomarkers: no serum total cholesterol or blood markers reported Compliance by dietary intake: unclear, not reported
Duration of intervention: 1 year |
|
| Outcomes | Main study outcome: RA activity and NSAID dose Dropouts: intervention 0, control 0 Available outcomes: ESR, CRP, functional status, RA status, NSAID use (authors stated that no deaths or CVD events occurred during the trial) |
|
| Notes | Study funding: Action Research for the Crippled Child, and Efamol Ltd provided the supplements Response to contact: Dr Belch contacted and provided some additional information, stating that no deaths or CVD events occurred |
|
| Risk of bias | ||
| Bias | Authors' judgement | Support for judgement |
| Random sequence generation (selection bias) | Unclear risk | Quote: "randomized double blind fashion", no detail provided |
| Allocation concealment (selection bias) | Unclear risk | As above, randomisation method not described. |
| Blinding of participants and personnel (performance bias) All outcomes | Low risk | Quote: "All three types of capsules were supplied by Efamol Ltd and were visually identical. The capsules were issued to the patients in a randomized double blind fashion". Participants and personnel were probably blinded. |
| Blinding of outcome assessment (detection bias) All outcomes | Unclear risk | Not stated |
| Incomplete outcome data (attrition bias) All outcomes | Low risk | Quote: "Table 2 shows the number of patients withdrawn from the study by 12 months. One patient in the EPO group and two in the EPO/fish oil group were withdrawn owing to increasing symptoms of RA, compared with 10/18 of the placebo patients (both P < 0.001, Mann‐Whitney). The results from all patients who were withdrawn were analyzed throughout the study on an intention to treat basis". |
| Selective reporting (reporting bias) | Unclear risk | No trial protocol or trials registry entry located |
| Attention Bias | Low risk | Appeared appropriate. Quote: "All participants in all groups needed to attend the clinic at monthly intervals for the first six months and thereafter at 3 monthly intervals." |
| Compliance | Unclear risk | No serum lipid, serum fatty acid or dietary intake data provided |
| Other bias | Low risk | None noted |
Black 1994.
| Methods | RCT, parallel, (low fat diet vs usual diet), 24 months Summary risk of bias: moderate or high |
|
| Participants | People with non‐melanoma skin cancer N: 66 intervention, 67 control (analysed, 57 intervention, 58 control) Level of risk for CVD: low Male: 54% intervention, 67% control Mean age in years (SD): 50.6 (9.7) intervention, 52.3 (13.2) control Age range: not reported Smokers: not reported Hypertension: not reported Medications taken by at least 50% of those in the control group: not reported Medications taken by 20%‐49% of those in the control group: not reported Medications taken by some, but less than 20% of the control group: not reported Location: USA Ethenicity: white 100% (excluded from study if of Asian, Black, Hispanic or American Indian ancestry) |
|
| Interventions | Type: dietary advice Comparison: reduced fat (lower omega‐6 + total PUFA) vs usual diet (CHO + protein) Intervention: aims total fat 20% E, protein 15% E, CHO 65% E; methods 8 × weekly classes plus monthly follow up sessions, with behavioural techniques being taught following individual approach (not clear if in a group or individual). At 4‐month intervals, clinic examination by dermatologist. Intervention delivered face‐to‐face by a dietitian Control: aims usual diet; methods no dietary change, clinic examination by dermatologist at 4‐month intervals Dose aim: reduce total fat to 20% E, including omega‐6 and total PUFA (no aim provided) Baseline n‐6: unclear, but baseline PUFA 8% E Compliance by biomarkers: unclear, no serum total cholesterol reported, no tissue fatty acids Compliance by dietary intake: all assessed "during study", months 4‐24, using 7‐day food records verified by a dietitian
Duration of intervention: 24 months (mean 1.9 years in trial) |
|
| Outcomes | Main study outcome: incidence of actinic keratosis and non‐melanoma skin cancer Dropouts: unclear intervention, unclear control Available outcomes: deaths, CVD deaths, cancer deaths (none), (weight data provided but without variance) |
|
| Notes | Study funding: National Cancer Institute Response to contact: Prof Black provided data on mortality NOTE: for this trial the higher PUFA arm is the control, and lower PUFA arm is the intervention |
|
| Risk of bias | ||
| Bias | Authors' judgement | Support for judgement |
| Random sequence generation (selection bias) | Low risk | Quote: "list of randomly generated numbers" |
| Allocation concealment (selection bias) | Unclear risk | Randomisation method not clearly described |
| Blinding of participants and personnel (performance bias) All outcomes | High risk | Dietary advice provided, so participants not blinded |
| Blinding of outcome assessment (detection bias) All outcomes | Low risk | Quote: "examined .... by dermatologists unaware of their treatment assignments". Deaths (all‐cause and CVD) not considered relevant to the intervention |
| Incomplete outcome data (attrition bias) All outcomes | Low risk | For mortality. Unclear for other outcomes |
| Selective reporting (reporting bias) | Unclear risk | No protocol or trials registry entry found |
| Attention Bias | High risk | Weekly classes and monthly follow‐up in intervention group, 4‐monthly check‐ups only in control |
| Compliance | Low risk | Dietary intake data suggest omega‐6 and total PUFA were significantly reduced in the intervention arm |
| Other bias | Low risk | None noted |
DART 1989.
| Methods | Diet And Reinfarction Trial (DART) RCT, 2 × 2 × 2 factorial (n‐6 LA vs SFA), also increased fish and increased fibre arms, 2 years Summary risk of bias: moderate to high |
|
| Participants | Men recovering from an MI CVD risk: high Control: randomised 1015, analysed unclear Intervention: randomised 1018, analysed unclear Mean years in trial: control 1.9, intervention 1.9 % male: 100% Mean age in years: control 56.8, intervention 56.4 Age range: all < 70 years Smokers: control 62.7%, intervention 61.2% Hypertension: control 23.3%, intervention 24% Medications taken by at least 50% of those in the control group: not reported Medications taken by 20%‐49% of those in the control group: beta‐blockers, other anti‐hypertensive drugs, anti‐anginals Medications taken by some, but less than 20% of the control group: anti‐coagulant, aspirin, other anti‐platelets, digoxin, other cardiac drugs Location: UK Ethnicity: not reported |
|
| Interventions | Type: dietary advice Comparison: increased polyunsaturated oil and margarines (n‐6) vs usual dietary fats (SFA) Intervention aims: reduce fat intake to 30% E, increase polyunsaturated: saturated fatty acid ratio to 1.0 (using polyunsaturated oils and margarines), weight reducing advice if BMI > 30 kg/m2 (dietitians provided the participants and their wives with initial individual advice and a diet information sheet; participants were revisited for further advice, recipes, encouragement at 1, 3, 6, 9, 12, 15, 18 and 21 months) Control aims: no dietary advice on fat, weight reducing advice if BMI > 30 kg/m2 (dietitians provided 'sensible eating' advice without specific information on fats) Dose aim: unclear Baseline n‐6: unclear, but control PUFA intake 6.6% E Compliance by biomarkers: good, serum total cholesterol significantly reduced in intervention compared to control (−0.26 mmol/L, 95% CI −0.37 to −0.15). Compliance by dietary intake: assessed using a 7 day weighted food diary, of a 25% random sub‐sample
Duration of intervention: 2 years |
|
| Outcomes | Main study outcomes: mortality, reinfarction Dropouts: all followed for events regardless of compliance (ITT) Available outcomes: CVD events (CVD deaths plus non‐fatal MI), cancer deaths, total MI, non‐fatal MI, total and HDL cholesterol. Data set used to examine causes of death during trial, these data added. |
|
| Notes | Note: this was a 2 × 2 × 2 factorial trial, and so some in each group were randomised to increased fatty fish and/or increased cereal fibre Study funding: Welsh Scheme for Development of Health and Social Research, Welsh Heart Research Foundation, Flora Project (commercial), Health Promotion Research Trust Response to contact: yes, ProfBurr provided extensive additional data and information on methodology |
|
| Risk of bias | ||
| Bias | Authors' judgement | Support for judgement |
| Random sequence generation (selection bias) | Low risk | Randomised using sealed envelopes. The random sequence was generated by the trials unit and sequentially numbered (personal communication with Prof Burr). |
| Allocation concealment (selection bias) | Unclear risk | Unclear if envelopes were opaque (Professor Burr, personal communication, stated that he did not know) |
| Blinding of participants and personnel (performance bias) All outcomes | High risk | Very difficult to blind trials where participants need to make their own dietary changes |
| Blinding of outcome assessment (detection bias) All outcomes | Low risk | Quote: "outcome assessors were not aware of study allocation" (Prof Burr, personal communication). Method of blinding not stated |
| Incomplete outcome data (attrition bias) All outcomes | Low risk | GPs contacted for information on mortality and morbidity when patients did not attend |
| Selective reporting (reporting bias) | Unclear risk | No protocol or trials registry entry located |
| Attention Bias | High risk | Almost all participants received dietary advice – some on 3 diets, some 2, some 1 and some none. All those receiving dietary fat advice will have received dietary advice, while 25% of those in the control received no dietary advice, dietetic time or attention. |
| Compliance | Low risk | Compliance good as assessed by biomarkers |
| Other bias | Low risk | None found |
Dullart 1992.
| Methods | RCT, parallel, 2 arms (n‐6 LA vs SFA), 2 years Summary risk of bias: moderate to high |
|
| Participants | Type I diabetics with elevated urinary albumin CVD risk: moderate Control: randomised 20, analysed 20 Intervention: randomised 18, analysed 16 % male: 81% intervention, 75% control Mean (SD) age in years: control 41 (14), intervention 44 (12) Age range: unclear (21‐65 inclusion) Smokers: control 55%, intervention 50% Hypertension: control 10%, intervention 6% Medications taken by at least 50% of those in the control group: insulin Medications taken by 20%‐49% of those in the control group: not reported Medications taken by some, but less than 20% of the control group: anti‐hypertensive drugs Location: Netherlands Ethnicty: not reported |
|
| Interventions | Type: dietary advice Comparison: LA (n‐6) vs usual diet Intervention: diet advice given at every visit throughout the 2‐year period to increase linoleic acid achieving a polyunsaturated: saturated fatty acid ratio close to 1.0. Advice to replace butter or saturated margarines by polyunsaturated margarines and to restrict the intake of saturated fat from meat and milk products Control: to continue their usual diet. All participants were urged not to alter total fat and protein content. Dose: (intake data) intervention group 13% E SFA, P/S 0.985, PUFA 9.4% E. Control group 15% E SFA, P/S 0.45, PUFA 6.6% E (CHO and protein were consistent between groups across the trial). Increase 2.8% E PUFA, most of which n‐6 Baseline n‐6: unclear, 6.6% E PUFA, most of which was n‐6 Compliance: poor, no significant difference between plasma cholesteryl ester LA in intervention and control at 2 years Plasma cholesteryl esters at 2 years
Dietary assessment using 1 week dietary recall, reported at 2 years
Duration of intervention: 2 years |
|
| Outcomes | Main study outcomes: albuminurea and lipids Dropouts: intervention 2 of 20, control 4 of 20 Available outcomes: weight, HDL cholesterol, TGs, HbA1c (total cholesterol, LDL, glucose, insulin reported but too different at baseline to use, renal outcomes such as GFR, albuminurea, mean arterial pressure not used) |
|
| Notes | Most outcomes are estimated from figures Study funding: Dutch Diabetes Research Fund Response to contact: yes, Prof Dullart confirmed that no CVD events or deaths occurred |
|
| Risk of bias | ||
| Bias | Authors' judgement | Support for judgement |
| Random sequence generation (selection bias) | Low risk | Quote: "patients were stratified according to sex and randomised in blocks of ten men and six women" |
| Allocation concealment (selection bias) | Low risk | Assigned using opaque sealed envelopes by independent statistical investigator with no contact with participants |
| Blinding of participants and personnel (performance bias) All outcomes | High risk | No information on blinding. Participants could not be blinded as they received dietary advice |
| Blinding of outcome assessment (detection bias) All outcomes | Unclear risk | No details |
| Incomplete outcome data (attrition bias) All outcomes | Unclear risk | No details on dropouts apart from the exclusion of 2 intervention participants from the trial due to pregnancy and decision not to participate |
| Selective reporting (reporting bias) | Unclear risk | No protocol or trial registration located |
| Attention Bias | High risk | Intervention groups received diet advice at every visit. As the control group were advised to stick to their usual diet it is likely that they received less attention and time. |
| Compliance | High risk | Compliance poor assessed by biomarkers |
| Other bias | Low risk | None noted |
GLAMT 1993.
| Methods | Gamma linolenic acid multicentre trial (GLAMT) RCT, 2‐arm, parallel (n‐6 GLA vs non‐fat), 1 year Summary risk of bias: moderate to high |
|
| Participants | People with mild diabetic neuropathy CVD risk: moderate Control: randomised 57, analysed 48 (with at least one evaluation) Intervention: randomised 54, analysed 52 Mean years in trial: control 1.0, randomised 1.0 % male: control 79%, intervention 67% Mean age (SD) in years: control 52.9 (11.4), intervention 53.3 (11.1) Age range: unclear Smokers: unclear Hypertension: unclear Medications taken by at least 50% of those in the control group: insulin Medications taken by 20%‐49% of those in the control group: not reported Medications taken by some, but less than 20% of the control group: not reported Location: UK and Finland Ethnicity: not reported |
|
| Interventions | Type: supplement Comparison: GLA (n‐6) vs placebo (paraffin) Control aims: 12 capsules/d paraffin Intervention aims: 12 capsules/d evening primrose oil (EP4, equivalent to Epogam): 0.48 g/d GLA plus LA (stated as the major constituent, dose not given, if assume 0.7 g/capsule then 8.4 g/d*) Dose aim: increase 0.48 g/d GLA or 4 kcal or 0.2% E GLA, increase ˜8.4 g/d LA or 76 kcal or 3.8% E LA, total 4% E n‐6 Baseline n‐6: unclear Compliance by biomarkers: unclear, no serum total cholesterol or tissue fatty acid levels reported Compliance by dietary intake: unclear
Duration of intervention: 1 year |
|
| Outcomes | Main study outcome: measures of diabetic neuropathy Dropouts: control 17, intervention 10 Available outcomes: MI, cancer (no deaths) | |
| Notes | Study funding: Scotia Pharmaceuticals *EPO described as being ˜70% LA in some publications, this and a 1‐g capsule size have been assumed where no other details are provided Response to contact: no response to our attempted contact |
|
| Risk of bias | ||
| Bias | Authors' judgement | Support for judgement |
| Random sequence generation (selection bias) | Unclear risk | Not described |
| Allocation concealment (selection bias) | Unclear risk | Not described |
| Blinding of participants and personnel (performance bias) All outcomes | Low risk | Described as double‐blind, and "[a]ctive and placebo capsules were indistinguishable in taste or appearance" |
| Blinding of outcome assessment (detection bias) All outcomes | Unclear risk | Unclear, though study described as double‐blind no methods or statement of blinding of outcome assessors was mentioned |
| Incomplete outcome data (attrition bias) All outcomes | High risk | Reasons for withdrawal usually given, but high and dissimilar |
| Selective reporting (reporting bias) | Unclear risk | No clear protocol or trials registry entry found |
| Attention Bias | Low risk | Capsule only intervention and provided to all, other follow ups appeared consistent for all |
| Compliance | Unclear risk | Not reported |
| Other bias | Low risk | None identified |
Houtsmuller 1979.
| Methods | RCT, parallel, (increase LA vs usual diet), 72 months maximum Summary risk of bias: moderate or high |
|
| Participants | Adults with newly diagnosed diabetes N: 51 intervention, 51 control (analysed unclear intervention, unclear control) Level of risk for CVD: moderate Male: 56% overall (not stated by intervention arm) Mean age (SD): not reported Age range: not reported Smokers: not reported Hypertension: not reported Medications taken by at least 50% of those in the control group: not reported Medications taken by 20%‐49% of those in the control group: not reported Medications taken by some, but less than 20% of the control group: statins (probably) Location: Netherlands Ethenicity: not reported |
|
| Interventions | Type: dietary advice Comparison: omega‐6 vs SFA and CHO Intervention: aims total fat 40% E, 1/3 linoleic acid, CHO 45% E, protein 15% E; methods unclear, surveyed by dietitian. Intervention appears to be delivered by dietitian but no clear details on format or frequency Control: aims SFA 35% E, CHO 50% E, protein 15% E; methods unclear, surveyed by dietitian Dose aims: increase ˜9% E LA (aims imply no LA in control, but paper states LA was 4 × higher in intervention than control, est 3% E control, 12% E intervention, so increase of ˜9% E) Baseline n‐6: unclear Compliance by biomarkers: good, serum total cholesterol significantly reduced in intervention compared to control (−0.47mmol/L, 95% CI −0.76 to −0.18), no significant differences in men, but significant improvements in women from 3 years Compliance by dietary intake: unclear (not reported)
Duration of intervention: 72 months |
|
| Outcomes | Main study outcome: progression of diabetic retinopathy Dropouts: unclear Available outcomes: CHD events (total MI and angina), total cholesterol, TGs (data read off graph), CHD mortality (fatal MI), progression of retinopathy, GTT and insulin (measured but results are reported in figures for a subgroup) |
|
| Notes | Study funding: Dutch Heart Foundation Response to contact: attempted but no contact established |
|
| Risk of bias | ||
| Bias | Authors' judgement | Support for judgement |
| Random sequence generation (selection bias) | Unclear risk | Participants matched in pairs then randomised |
| Allocation concealment (selection bias) | Unclear risk | Randomisation method not clearly described |
| Blinding of participants and personnel (performance bias) All outcomes | Unclear risk | Unclear, though unlikely as dietary advice provided |
| Blinding of outcome assessment (detection bias) All outcomes | Unclear risk | Blinding of outcome assessors not mentioned |
| Incomplete outcome data (attrition bias) All outcomes | Unclear risk | Unclear, deaths, cancer and CV events are drop‐outs, trialists asked for data – unclear if any data missing |
| Selective reporting (reporting bias) | Unclear risk | No protocol or trials registry entry found |
| Attention Bias | Unclear risk | Unclear as methods unclear |
| Compliance | Low risk | Compliance good assessed by biomarkers |
| Other bias | High risk | Some concerns around fraud in the first authors later research on diet in cancer. No allegations found regarding his research in diabetes (but much information is in Dutch). Numbers of events are not clear by arm and assumed from adding across various publications |
Mansel 1990.
| Methods | RCT, 2 arm, parallel (n‐6 GLA vs non‐fat), 1 year Summary risk of bias: moderate to high |
|
| Participants | Women with macroscopic breast cysts CVD risk: low Intervention: 100 Control: 100 Mean years in trial: 1 % male: 0 Age: unclear (no statistically significant difference between groups) Age range: 35 to 60 years Smokers: unclear Hypertension: unclear Medications taken by at least 50% of those in the control group: not reported Medications taken by 20%‐49% of those in the control group: not reported Medications taken by some, but less than 20% of the control group: not reported Location: UK Ethnicity: not reported |
|
| Interventions | Type: supplement Comparison: GLA (n‐6) vs placebo (paraffin) Intervention aims: 6 capsules/d EPO (Efamol) containing ≥ 9% GLA (total volume unclear) Control aims: 6 capsules/d paraffin (total volume unclear) Dose: (assuming each capsule is 1 g) increase 0.54 g/d GLA, increase 6 g/d or 54 kcal or 2.7% E n‐6 Baseline n‐6: unclear Compliance: unclear Duration of intervention: 1 year |
|
| Outcomes | Main study outcome: unclear, recurrent cysts? Dropouts: intervention 7, control 8 Available outcomes: breast cancer (no deaths or CVD events appear to have occurred) Response to contact: no response to attempted contact |
|
| Notes | Study funding: not stated | |
| Risk of bias | ||
| Bias | Authors' judgement | Support for judgement |
| Random sequence generation (selection bias) | Unclear risk | Quote: "randomised" |
| Allocation concealment (selection bias) | Unclear risk | Randomisation process not discussed |
| Blinding of participants and personnel (performance bias) All outcomes | Unclear risk | Placebo controlled but similarity of placebo unclear; paper suggests that participants and physicians were blinded to allocation |
| Blinding of outcome assessment (detection bias) All outcomes | Unclear risk | Quote: "examined by a clinician who was blind to the treatment allocated" but method of this blinding unclear |
| Incomplete outcome data (attrition bias) All outcomes | Low risk | Attrition below 20% and well documented |
| Selective reporting (reporting bias) | Unclear risk | No protocol or trials registry entry found |
| Attention Bias | Low risk | All seen 2‐monthly, all took capsules, clinicians blind to treatment allocation |
| Compliance | Unclear risk | Not reported |
| Other bias | Low risk | None noted |
McIllmurray 1987.
| Methods | RCT, parallel, 2 arms (GLA vs "inert placebo"), 40 months Summary risk of bias: moderate to high |
|
| Participants | People within one month following operation to remove Dukes's C colorectal cancer N: intervention 25 (plus some dropouts), control: 24 (plus some dropouts (analysed intervention 25, control 24). 5 dropped out, but arms unclear Level of risk for CVD: low Male: not reported Mean age (SD) in years: intervention 62.1 (not reported), control 64.8 (not reported) Age range: intervention 48‐81, control 45‐77 Smokers: not reported Hypertension: not reported Medications taken by at least 50% of those in the control group: not reported Medications taken by 20%‐49% of those in the control group: not reported Medications taken by some, but less than 20% of the control group: not reported Location: UK Ethnicity: not reported |
|
| Interventions | Type: supplement (EPO) Comparison: GLA vs "inert placebo" (unclear what) Intervention: 6 capsules/d containing 500 mg GLA plus 10 mg natural vitamin E (Efamol). GLA 0.5 g/d, 60 mg/d vitamin E plus vitamin supplements including vitamin C, zinc sulphate and pyridoxine. Control: 6 capsules/d containing an inert placebo, identical in appearance (not specified what). Plus vitamin supplements including vitamin C, zinc sulphate and pyridoxine Dose aim: (assuming placebo contains no PUFA) increase 0.5 g/d GLA, 5 kcal or 0.2% E GLA, assume 70% LA*, 4.2 g/d or 37.8 kcal/d or 1.9% E LA, 2.1% E n‐6 Baseline n‐6: unclear Compliance by biomarkers: unclear, no serum total cholesterol or tissue fatty acid levels reported Compliance by dietary intake: unclear, states that one participant stopped taking the supplements at 12 months
Duration of intervention: 40 months |
|
| Outcomes | Main study outcome: unclear, "survival", probably mortality Dropouts: 5 (unclear from which groups) Available outcomes: mortality, cancer mortality (face flushing reported as a side effect, but no numbers provided and assumed due to concomitant pyridoxine) |
|
| Notes | Study funding: not stated, Efamol Ltd provided the EPO capsules and inert capsules. *EPO described as being ˜70% LA in some publications, this and a 1 g capsule size have been assumed where no other details are provided Response to contact: Prof McIllmurray replied "I don't have the records ... so I have nothing more than what appears in the publication. I do not recall there being any cardiovascular events." |
|
| Risk of bias | ||
| Bias | Authors' judgement | Support for judgement |
| Random sequence generation (selection bias) | Unclear risk | Quote: "assigned at random" |
| Allocation concealment (selection bias) | Unclear risk | No details |
| Blinding of participants and personnel (performance bias) All outcomes | Unclear risk | No details apart from the placebo was identical in appearance to the EPO capsules |
| Blinding of outcome assessment (detection bias) All outcomes | Unclear risk | Not stated |
| Incomplete outcome data (attrition bias) All outcomes | Unclear risk | 5 dropouts, unclear from which arms |
| Selective reporting (reporting bias) | Unclear risk | No protocol or trials register entry found |
| Attention Bias | Low risk | Probably as intervention was capsules in both groups |
| Compliance | Unclear risk | Not stated |
| Other bias | Unclear risk | None noted, but contents of placebo capsules unclear |
Mendis 2001.
| Methods | RCT, 2 arm, parallel (n‐6 LA vs non‐fat), 1 year Summary risk of bias: moderate to high |
|
| Participants | Healthy volunteers responding to survey. Some had hyperlipidaemia. CVD risk: low N: 30 intervention, 30 control (analysed 26 intervention, 28 control) % male: 78% (total) Mean age: not reported Age range: 20‐65 years Smokers: not reported Hypertension: not reported Medications taken by at least 50% of those in the control group: not reported Medications taken by 20%‐49% of those in the control group: not reported Medications taken by some, but less than 20% of the control group: not reported *Lipid lowering medications as well as many others were not allowed. Location: Sri Lanka Ethnicity: 100% Sri Lanakan |
|
| Interventions | Type: diet advice plus test fat supplement Comparison: n‐6 vs non‐fat (unclear if CHO, protein or both) Intervention: group B received a diet containing 20% E as fat (4.7% coconut fat) plus 7.5 g/day test fat containing soybean fat‐sesame fat (3:1, v/v containing PUFA:MUFA ratio 2). Fat intake in group B was, therefore, 24% E (test fat provided additional 5 g/d PUFA mainly LA) Control: group A received a diet containing 20% E as fat (4.7% E coconut fat) Dose aim: increase 5 g/d PUFA or 45 kcal or 2.2% E PUFA, assume˜2% E LA Baseline n‐6: unclear Compliance by biomarkers: poor, serum total cholesterol was not significantly reduced in intervention compared to control (0.16 mmol/L, 95% CI −0.18 to 0.50). The intervention group were stated as having higher dietary PUFA:SFA ratio than controls, but no blood levels of FAs were reported. Compliance by dietary intake: unclear, measured by field workers' visits and using food diaries
Duration of intervention: 1 year |
|
| Outcomes | Main study outcome: serum lipids Dropouts: intervention 4, control 2 Available outcomes: lipids |
|
| Notes | Study funding: National Science Foundation of Sri Lanka Response to contact: no response to attempted contact |
|
| Risk of bias | ||
| Bias | Authors' judgement | Support for judgement |
| Random sequence generation (selection bias) | Unclear risk | Participants were randomised to 2 groups (groups A and B). This was done in such a way that the 38 hyperlipidaemic subjects were equally divided between the 2 groups |
| Allocation concealment (selection bias) | Unclear risk | No details |
| Blinding of participants and personnel (performance bias) All outcomes | High risk | The groups had different diets with test fat added to intervention group |
| Blinding of outcome assessment (detection bias) All outcomes | Unclear risk | No details |
| Incomplete outcome data (attrition bias) All outcomes | High risk | 6 participants dropped out at 6 months but their data is not included in the analysis at all |
| Selective reporting (reporting bias) | Unclear risk | No protocol or trial register entry found |
| Attention Bias | Low risk | Both groups had twice weekly visits by field workers |
| Compliance | High risk | Compliance poor when assessed by biomarkers |
| Other bias | Unclear risk | No details provided on the form or method of supply of diet or test fat |
MRC 1968.
| Methods | Medical Research Council (MRC) RCT, 2 arm, parallel (n‐6 LA vs mixed fats), 4 years Summary risk of bias: moderate to high |
|
| Participants | Free‐living men who have survived a first MI (UK) CVD risk: high Control: randomised 194, analysed 181 at 2 years Intervention: randomised 199, analysed 172 at 2 years Mean years in trial: control 3.7, intervention 3.8 % male: 100 Age: unclear Age range: all < 60 years Smokers: control 84%, intervention 81% Hypertension: control 12%, intervention 8% Medications taken by at least 50% of those in the control group: not reported Medications taken by 20%‐49% of those in the control group: not reported Medications taken by some, but less than 20% of the control group: not reported Location: UK Ethnicty: not reported |
|
| Interventions | Type: diet advice plus supplement Comparison: increased soya oil (n‐6) vs usual diet (some SFA replacement, otherwise unclear) Control aims: usual diet Intervention aims: reduce dietary fat to 35 g/d fat, add 84 g/d soya oil Dose aim: increase 84 g/d soya oil or 756 kcal or 37.8% E soya (assume 50% LA, so 18.9% E LA, assume 58% PUFA so21.9% E PUFA) Baseline n‐6: unclear Compliance by biomarkers: unclear, serum total cholesterol reported but without any variance info. Report stated that "tissue fat of the men on the soya‐bean oil diet was less saturated than that of the controls" and that further information would be published elsewhere. No statistical significance or variance data mentioned Compliance by dietary intake: unclear
Duration of intervention: 4 years |
|
| Outcomes | Main study outcomes: MI or sudden death Dropouts: intervention 199 randomised, 181 at 2 years, 91 at 4 years. Control: 194 randomised, 172 at 2 years, 85 at 4 years Available outcomes: mortality, CVD mortality (CVD deaths plus non‐fatal MI), total MI, non‐fatal MI (data for weight, total cholesterol and BP, but no variance info) |
|
| Notes | Study funding: Medical Research Council Response to contact: reply from retired trial statistician, JA Heady, in 1999 |
|
| Risk of bias | ||
| Bias | Authors' judgement | Support for judgement |
| Random sequence generation (selection bias) | Low risk | Quote: "using random numbers, by blocks within hospitals" |
| Allocation concealment (selection bias) | Unclear risk | Not described |
| Blinding of participants and personnel (performance bias) All outcomes | High risk | Big changes to fat intake in intervention group while control group ate their usual diet |
| Blinding of outcome assessment (detection bias) All outcomes | Low risk | Quote: "[s]uspected relapses were assessed at regular intervals by a review committee unaware of the patients diet group" |
| Incomplete outcome data (attrition bias) All outcomes | High risk | Data collection was thorough, but some participants dropped out and contact was lost |
| Selective reporting (reporting bias) | Unclear risk | No protocol or trials registry entry located |
| Attention Bias | High risk | Likely that intervention group received more time, training and encouragement (as dietary intervention, and control ate usual diet) |
| Compliance | Unclear risk | Not reported |
| Other bias | Low risk | None noted |
NDHS Faribault 1968.
| Methods | National Diet‐Heart Study (NDHS) – Faribault site RCT, several arms, parallel (n‐6 LA vs SFA + MUFA), 1 year Summary risk of bias: low |
|
| Participants | Men living in a mental health institute CVD risk: low Control: randomised 57, analysed 52 Interventions B, C, E combined: randomised 167, analysed 143 Mean years in trial: control 1.0, Interventions 0.9 % male: 100 Age: unclear Age range: all 45‐54 years Smokers: 55% to 59% current smokers in each arm Hypertension: unclear Medications taken by at least 50% of those in the control group: not reported Medications taken by 20%‐49% of those in the control group: not reported Medications taken by some, but less than 20% of the control group: not reported Location: USA Ethnicty: not reported |
|
| Interventions | Type: diet provided (residential institution) Comparison: increased PUFA (n‐6) vs usual institutional diet (SFA + MUFA) Control aims: total fat 40% E, SFA 16‐18% E, dietary cholesterol 650‐750 mg/d, P/S 0.4 (so PUFA 6.8% E) (whole diet provided) Intervention aims: B (C, E) total fat 30% E (40% E, 40% E), SFA < 9% E (< 9% E, not stated), dietary cholesterol 350‐450 mg/d (350‐450 mg/d, not stated), PUFA 15% E (18‐20% E, not stated), P/S 1.5 (2.0, 4.4) (equivalent to Minnesota Coronary Study diet) (whole diet provided) Dose aim: increase B 8.2% E, C 12.2% E, E unclear n‐6 Baseline n‐6 (table IX2): 4.4% E LA, 4.8% E PUFA Compliance by biomarkers: good, serum total cholesterol significantly reduced in intervention compared to control (−0.91 mmol/L, 95% CI −1.17 to −0.65). Data on fatty acid composition of red blood cells provided in chapter 10 (table X6: LA rose by 4 in control, by 5 to 7 in other arms, at the expense of MUFA which rose by 1 in control, fell by 4 or 5 in other arms. Palmitic acid fell by 5 in control, and fell by 4 in intervention arms, stearic did not alter in control, rose by 1 or 2 in intervention arms – no statistical significance or variance info provided, units unclear, probably % of LA + oleic + palmitic + stearic) Compliance by dietary intake: good. Assessed from 7‐day food records after 28 and 44 weeks combined (tables IX8 and 9)
Duration of intervention: 1 year |
|
| Outcomes | Main study outcomes: lipid levels and dietary assessment Dropouts: B 7, C 10, E 7, D (control) 5 Available outcomes: mortality, total cholesterol (weight and TG data available but without SDs) |
|
| Notes | Data entered as all interventions combined (B + C + E) vs control (D) Study funding: National Heart Institute Response to contact: not attempted as study completed in 1967 |
|
| Risk of bias | ||
| Bias | Authors' judgement | Support for judgement |
| Random sequence generation (selection bias) | Low risk | Stratified randomisation by the statistical centre |
| Allocation concealment (selection bias) | Low risk | As above |
| Blinding of participants and personnel (performance bias) All outcomes | Low risk | Institution so all participants and study staff blinded to allocation |
| Blinding of outcome assessment (detection bias) All outcomes | Low risk | Outcome assessors were reported as blinded to treatment allocation |
| Incomplete outcome data (attrition bias) All outcomes | Low risk | Institution so able to follow up all participants through study |
| Selective reporting (reporting bias) | Unclear risk | No protocol or trials registry entry found |
| Attention Bias | Low risk | Interventions and follow ups delivered in an equivalent way across arms |
| Compliance | Low risk | Good compliance by biomarkers |
| Other bias | Low risk | None found |
NDHS Open 1st 1968.
| Methods | National Diet‐Heart Study (NDHS) – Open First phase RCT, several arms, parallel (n‐6 LA vs SFA + MUFA), 1 year Summary risk of bias: low |
|
| Participants | Free‐living men aged 45‐54 years CVD risk: low Control: randomised 382, analysed 341 Interventions B, C, X combined: randomised 829, analysed 726 Mean years in trial: control 0.95, intervention 0.93 % male: 100 Age: unclear Age range: all 45‐54 years Smokers: 39% to 40% current smokers in each arm Hypertension: unclear Medications taken by at least 50% of those in the control group: not reported Medications taken by 20%‐49% of those in the control group: not reported Medications taken by some, but less than 20% of the control group: not reported Location: USA Ethnicty: white 98.2%, non‐white 1.8% (not reported by intervention arm) |
|
| Interventions | Type: diet provided (bought from a trial shop) Comparison: increased PUFA (n‐6) vs usual diet (replacement of SFA + MUFA) Control aims: total fat 40% E, dietary cholesterol 650‐750 mg/d, P/S 0.4 (assume PUFA 6.8% E as at Faribault) (foods bought from a trial shop – normal foods) Intervention aims: B (C, X) total fat 30% E (40% E, 30% E), SFA < 9% E (< 9% E, < 9% E), dietary cholesterol 350‐450 mg/d (350‐450 mg/d, 350‐450 mg/d), PUFA 15% E (18‐20% E, 15% E), P/S 1.5 (2.0, 1.5) (foods bought from a trial shop – saturated fats removed and replaced by polyunsaturated oils and fats) Dose aim:increase B 8.2% E, C 12.2% E, X 8.2% E n‐6 Baseline n‐6 (tables IX 1 and 3): 3.7% LA, 3.9% PUFA Compliance by biomarkers: good, serum total cholesterol significantly reduced in intervention compared to control (−0.45 mmol/L, 95% CI −0.55 to −0.35). Data on fatty acid composition of red blood cells provided in chapter 10 (table X6: LA rose by 1 in control, by 2 to 3 in other arms, at the expense of MUFA which did not alter in control, fell by 2 or 3 in other arms. Palmitic acid remained constant in control and remained constant or fell by 1 in intervention arms, stearic did not alter in control and remained constant or rose by 1 in intervention arms – no statistical significance or variance info provided, units unclear, probably % of LA + oleic + palmitic+stearic) Compliance by dietary intake: good. Nutritionists subjective adherence ratings of excellent or good (as compared to fair or poor) intervention B 58%, intervention C 60%, control D 55%. Dietary intake computed from 7‐day food records at 28 weeks (table IX3, no later data found):
Duration of intervention: 1 year |
|
| Outcomes | Main study outcomes: lipid levels and dietary assessment Dropouts: intervention B 42, C 34, X 5, control D 36 Available outcomes: CVD events (MI and PAD events), cancer diagnoses, total cholesterol (weight, diastolic BP and TG data available but without SDs) |
|
| Notes | Study funding: National Heart Institute Response to contact: not attempted as study completed in 1967 |
|
| Risk of bias | ||
| Bias | Authors' judgement | Support for judgement |
| Random sequence generation (selection bias) | Low risk | Stratified randomisation by the statistical centre |
| Allocation concealment (selection bias) | Low risk | Stratified randomisation by the statistical centre |
| Blinding of participants and personnel (performance bias) All outcomes | Low risk | Participants and study personnel (aside from the store manager) were blinded to allocation. Blinding of participants was checked using a questionnaire which found no difference between intervention and control participants in guesses at dietary composition. |
| Blinding of outcome assessment (detection bias) All outcomes | Low risk | Outcome assessors were reported as blinded to treatment allocation |
| Incomplete outcome data (attrition bias) All outcomes | Low risk | 12% dropouts, well described |
| Selective reporting (reporting bias) | Unclear risk | No protocol or trial registry entry found |
| Attention Bias | Low risk | Interventions and follow‐ups delivered in an equivalent way across arms |
| Compliance | Low risk | Good compliance by biomarkers |
| Other bias | Low risk | None noted |
Rose 1965.
| Methods | RCT, 2‐arm, parallel (n‐6 LA vs MUFA), 24 months Summary risk of bias: moderate to high |
|
| Participants | Patients with ischaemic heart disease (IHD) CVD risk: high N: 28 intervention, 26 control (analysed 15 intervention, 12 control) % male: not reported Mean age in years: 52.6 intervention, 55 control (no SDs) Age range: not reported Smokers: not reported Hypertension: not reported Medications taken by at least 50% of those in the control group: not reported Medications taken by 20%‐49% of those in the control group: not reported Medications taken by some, but less than 20% of the control group: not reported Location: UK Ethnicty: not reported |
|
| Interventions | Type: dietary advice + test oil provided Comparison: n‐6 vs MUFA Intervention: 80 g/d corn oil to be taken in 3 equal doses at meal‐times plus patients were instructed to avoid fried foods, fatty meat, sausages, pastry, ice‐cream, cheese, cakes, milk, eggs, butter were restricted: assuming 80% LA in corn oil, 64 g/d LA or 576 kcal/d or 28.8% E from LA Control: 80 g/day olive oil plus patients were instructed to avoid fried foods, fatty meat, sausages, pastry, ice‐cream, cheese, cakes, milk, eggs, butter were restricted. assuming 12% LA and 69% MUFA in olive oil, 9.6 g/d LA or 4.3% E LA and 55.2 g/d MUFA or 24.8% E Dose aim: +24.5% E from LA, −24.8% E MUFA Baseline n‐6: unclear Compliance using biomarkers: poor, serum total cholesterol not significantly reduced in intervention compared to control (−0.49 mmol/L, 95% CI −1.34 to 0.36) Compliance using dietary assessment: poor. Measured using questionnaire Mean intake of oil in intervention was 595 kcal/d or 476 kcal/d LA or 23.8% E, in control 540 kcal/d or 3.2% E LA and 18.6% E MUFA Dose achieved: +20.6% E from LA, −18.6% E MUFA within the oils, unclear how diet altered
Duration of intervention: 2 years |
|
| Outcomes | Main study outcome: occurrence of infarction Dropouts: 6 intervention, 11? control, details provided in table but unclear how many dropped out Available outcomes: major CVD events, MI (fatal and non‐fatal), sudden death, serum cholesterol | |
| Notes | Study funding: no details The study had a third control arm (no intervention) which has not been used here. Response to contact: contact attempted but not achieved |
|
| Risk of bias | ||
| Bias | Authors' judgement | Support for judgement |
| Random sequence generation (selection bias) | Low risk | When a new patient was accepted for the trial a sealed envelope was opened containing the allocation instructions. In the case of patients allocated to an oil group the instructions referred only to a code number. |
| Allocation concealment (selection bias) | Unclear risk | As above, opacity of envelope unclear |
| Blinding of participants and personnel (performance bias) All outcomes | Low risk | Physicians in charge knew which patients were receiving oil, but they did not know until the end of the trial the kind of oil that they were receiving. |
| Blinding of outcome assessment (detection bias) All outcomes | Low risk | The electrocardiograms were assessed without the knowledge of the patients treatment group |
| Incomplete outcome data (attrition bias) All outcomes | Low risk | 52% intervention, and 57% control remained in the trial after 24 months. However, the list of reasons and complications is provided. |
| Selective reporting (reporting bias) | Unclear risk | No trial registry record or protocol found |
| Attention Bias | Low risk | Both groups appear to have the same treatment |
| Compliance | High risk | Compliance poor; assessed by biomarkers |
| Other bias | Low risk | None noted |
Schirmer 2007.
| Methods | RCT, 2 arm, parallel (n‐6 GLA vs MUFA), 1 year Summary risk of bias: moderate to high |
|
| Participants | Formerly obese adults with a recent minimum weight loss of 12 kg, a current BMI of < 34 kg/m2, otherwise healthy CVD risk: low N: 23 intervention, 22 control (analysed only completers 13 intervention, 17 control) % male: 8% intervention, 6% control Mean age (SD) in years: 44.2 (10.1) intervention, 52.6 (8.1) control Age range: not reported Smokers: not reported Hypertension: 0% Medications taken by at least 50% of those in the control group: anorexigenic agent Medications taken by 20%‐49% of those in the control group: not reported Medications taken by some, but less than 20% of the control group: not reported Location: USA Ethnicty: not reported |
|
| Interventions | Type: supplement (capsule) Comparison: n‐6 (GLA) vs MUFA Intervention: 5 g/d of 500 mg borage oil capsules providing 0.89 g/d GLA Control: 5 g/d of identical 500 mg olive oil capsules Subjects in both groups were required to take a balanced multivitamin‐mineral supplement daily, which included 80 mg of d‐alpha‐tocopherol Dose aim: increase 0.89 g/d GLA or 8 kcal or 0.4% E GLA, plus approx 0.9 g/d LA or 0.4% E LA, 0.8% E n‐6 Baseline n‐6: unclear Compliance by biomarkers: good. Measurement of adipose GLA showed increased GLA in intervention (2.16 μmol/g of adipose TG at baseline to 5.39 μmol/g at 1 year) but not in control (2.51 μmol/g of adipose TG at baseline to 2.87 μmol/g at 1 year, statistically significant difference suggested). DGLA increased in intervention group, but fell in control Compliance by dietary intake: unclear, participants maintained daily food intake and exercise records
Duration of intervention: 1 year (results reported only for participants completing a minimum of 50 weeks) |
|
| Outcomes | Main study outcome: measures of adiposity Dropouts: unclear, only one withdrew after randomisation but trial was terminated and only reported on 30/45 completers Available outcomes: weight, fat weight (fasting blood glucose and blood pressure measured but not reported) |
|
| Notes | Study funding: supported in part by a gift from Shaklee Technica Response to contact: Prof Phinney replied "I am sorry to inform you that I cannot provide meaningful feedback within the parameters of your survey" |
|
| Risk of bias | ||
| Bias | Authors' judgement | Support for judgement |
| Random sequence generation (selection bias) | Unclear risk | Quote: "randomly assigned" |
| Allocation concealment (selection bias) | Unclear risk | No details |
| Blinding of participants and personnel (performance bias) All outcomes | Low risk | Quote: "Both oil supplements were administered in a double‐blind protocol as identical 500 mg capsules" |
| Blinding of outcome assessment (detection bias) All outcomes | Low risk | Quote: "The initial study was terminated, and all remaining subjects were assessed over a 6‐wk period. Unblinding revealed" …"the monitoring of their weights (simple ANOVA of group means while investigators and subjects remained unaware of treatment)" |
| Incomplete outcome data (attrition bias) All outcomes | High risk | Quote: "At the termination of the randomized placebo‐controlled trial, 45 subjects remained in the study". Mentions one dropped out between randomisation and treatment commencement but no details/explanation of remaining dropouts/non‐completers |
| Selective reporting (reporting bias) | Unclear risk | No protocol or trial register entry |
| Attention Bias | Low risk | Both groups appear to have the same care |
| Compliance | Low risk | Adipose GLA was significantly higher in intervention group compared to control (P < 0.0001) |
| Other bias | Low risk | None noted |
Sydney Diet‐Heart 1978.
| Methods | Sydney Diet‐Heart Study RCT, 2 arm, parallel (n‐6 LA vs SFA + MUFA), 4.3 years Summary risk of bias: low |
|
| Participants | Men with previous MI CVD risk: high Control: randomised 237, analysed 221 at 2 years Intervention: randomised 221, analysed 205 at 2 years Mean years in trial: control 4.3, intervention 4.3 % male: 100 Mean age (SD) in years: control 49.1 (6.5), intervention 48.7 (6.8) Age range: 30‐59 years Smokers: control 68.8%, intervention 71.5% Hypertension: unclear Medications taken by at least 50% of those in the control group: not reported Medications taken by 20%‐49% of those in the control group: not reported Medications taken by some, but less than 20% of the control group: not reported Location: Australia Ethnicity: not reported |
|
| Interventions | Type: diet advice Comparison: increased safflower oil and safflower oil based margarine (n‐6) vs usual diet (reduced SFA and MUFA) Control aims: reduction in energy if overweight, no other specific dietary advice, allowed to use PUFA margarine instead of butter (no specific dietary instruction, except re weight) Intervention aims: SFA 10% E, PUFA 15% E, reduction in energy if overweight, dietary cholesterol < 300 mg/d through provision of safflower oil and safflower margarine (advised and tutored individually, diet assessed 3 times in first year,twice annually thereafter) Dose aim: increase 6.6% E PUFA, most of which n‐6 Baseline n‐6: unclear, 6.1% E PUFA, mostly n‐6 Compliance by biomarkers: good, serum total cholesterol significantly reduced in intervention compared to control (−0.30 mmol/L, 95% CI −0.51 to −0.09) Compliance by dietary intake: good. From diet records, medians provided.
Duration of intervention: 2‐7 years |
|
| Outcomes | Main study outcomes: CVD mortality and morbidity Dropouts: unclear, probably 16 dropouts in each arm, but participants were included from 2 to 7 years Available outcomes: mortality, total cholesterol, TG. Additional data provided or checked on all‐cause mortality, CHD events, stroke and CVD mortality |
|
| Notes | Study funding: Life Insurance Medical Research Fund of Australia and New Zealand Response to contact: Dr Leelarthepin and Dr Zamora both provided additional data |
|
| Risk of bias | ||
| Bias | Authors' judgement | Support for judgement |
| Random sequence generation (selection bias) | Low risk | Quote: "table of random numbers ... generated by a research assistant and was concealed until after medical evaluations and testing at baseline were completed" |
| Allocation concealment (selection bias) | Low risk | As above |
| Blinding of participants and personnel (performance bias) All outcomes | High risk | Very difficult to blind trials where participants need to make their own dietary changes |
| Blinding of outcome assessment (detection bias) All outcomes | Low risk | Initially masked to group assignment (though success of blinding not checked) |
| Incomplete outcome data (attrition bias) All outcomes | Low risk | Survival analysis used |
| Selective reporting (reporting bias) | Unclear risk | No protocol or trials registry entry located |
| Attention Bias | High risk | Different levels of dietary support (non‐dietary aspects were equivalent) |
| Compliance | Low risk | Compliance good assessed by biomarkers |
| Other bias | Low risk | None noted |
Veterans Admin 1969.
| Methods | Veterans Administration Study RCT, 2 arms, parallel (n‐6 LA vs SFA + MUFA), up to 8 years Summary risk of bias: moderate to high |
|
| Participants | Men living at the Veterans Administration Centre CVD risk: low Control: randomised 422, analysed 422 Intervention: randomised 424, analysed 424 Mean years in trial: control 3.7, intervention 3.7 % male: 100 Mean age in years: control 65.6, intervention 65.4 Age range: all 54 to 88 years Smokers: intervention 283, control 279 (unknown intervention 41, control 58) Hypertension: unclear Medications taken by at least 50% of those in the control group: not reported Medications taken by 20%‐49% of those in the control group: not reported Medications taken by some, but less than 20% of the control group: digitalis, diuretics, estrogens, corticoids, androgens, coumarins, nicotinic acid Location: USA Ethnicity: white 90%, black 7%, Asian 1%, Mexican 1%, other 1% |
|
| Interventions | Type: diet provided (residential institution) Comparison: increased corn, soybean, safflower and cottonseed oils (n‐6) vs usual institutional diet Control aims: provided, total fat 40% E (whole diet provided) Intervention aims: total fat 40% E, 2/3 of SFA replaced by unsaturated fats (from corn, soybean, safflower and cottonseed oils), dietary cholesterol reduced (whole diet provided) Dose aim: 2/3 of baseline SFA is increase of ˜12% E PUFA Baseline n‐6: 4% E LA Compliance by biomarkers: poor, serum total cholesterol not significantly reduced in intervention compared to control (−0.37 mmol/L, 95% CI −0.77 to 0.03) Compliance by dietary intake: unclear, checked using coloured tickets to assess dining room attendance – described as 49% in intervention and 56% in controls. Laboratory analysis of the mean of over 400 weekly collections of diet provided:
Duration of intervention: up to 8‐9 years |
|
| Outcomes | Main study outcomes: mortality, heart disease Dropouts: intervention 117, control 58 withdrawals over whole study, a few participants were involved for up to 8‐9 years Available outcomes: mortality, CVD mortality (sudden death, definite MI, definite stroke, angina, peripheral vascular events), cancer deaths, cancer diagnoses, stroke, non‐fatal MI, total MI, CHD deaths (fatal MI and sudden death due to CHD), CHD events (any MI or sudden death due to CHD), total cholesterol |
|
| Notes | Trial dates: recruitment 1959 to 1967 Study funding: mainly US Public Health Service, Los Angeles County Heart Assoc, Arthur Dodd Fuller Assoc, but Corn Products Co (provided Corn oil and margarine), National Soybean Processors Assoc (provided soybean oil), Pitman‐Moore Co (provided margarine), Frozen Desserts Co (imitation ice cream). All authors worked for academic or health institutions Response to contact: not contacted as the study started in 1959. |
|
| Risk of bias | ||
| Bias | Authors' judgement | Support for judgement |
| Random sequence generation (selection bias) | Low risk | Quote: "table of random numbers used" |
| Allocation concealment (selection bias) | Unclear risk | Not described |
| Blinding of participants and personnel (performance bias) All outcomes | Low risk | Institution provided diet in a masked fashion |
| Blinding of outcome assessment (detection bias) All outcomes | Low risk | Physician knowledge of allocation was assessed and found not much better than random |
| Incomplete outcome data (attrition bias) All outcomes | Low risk | All followed up via Veterans Admin system |
| Selective reporting (reporting bias) | Unclear risk | No protocol or trials registry entry located |
| Attention Bias | Low risk | Both groups appear to have been treated very similarly |
| Compliance | High risk | Compliance poor assessed by biomarkers |
| Other bias | Low risk | None found |
Vijayakumar 2014.
| Methods | RCT, 2 arms, parallel (n‐6 LA vs SFA), 2 years Summary risk of bias: moderate to high |
|
| Participants | People with stable coronary artery disease CVD risk: high Intervention (sunflower oil): 100 randomised, analysed at 2 years 94 Control (coconut oil): 100 randomised, analysed at 2 years 96 Mean years in trial: 2 % male: intervention 92.9%, control 93.9% Mean age (SD) in years: intervention 59.0 (8.9), control 59.0 (8.4) Age range: unclear Smokers, ex: intervention 57.1%, control 54.1% Hypertension: intervention 55.1%, 58.2% Medications taken by at least 50% of those in the control group: statins Medications taken by 20%‐49% of those in the control group: not reported Medications taken by some, but less than 20% of the control group: fibrates, nicotinic acid Location: India Ethnicity: not reported |
|
| Interventions | Type: food (cooking oil) provided Comparison: sunflower oil (n‐6) vs coconut oil (SFA) Intervention aims: whole family to use branded sunflower oil for cooking (15% E provided in form of sunflower oil) Control aims: whole family to use branded coconut oil for cooking (15% E provided in form of coconut oil) Dose aim: increase 15% E n‐6 Baseline n‐6: unclear Compliance by biomarkers:poor, serum total cholesterol not significantly reduced in intervention compared to control (0.06 mmol/L, 95% CI −0.22 to 0.34) Compliance by dietary intake:unclear. Reports that 7‐day recall and diet diaries were used to monitor intake, but results not provided
Duration of intervention: 2 years |
|
| Outcomes | Main study outcome: CVD risk factors Dropouts: intervention 6 lost, control 4 lost Available outcomes: lipids, death, re‐vascularisation (glycaemic control, weight, BMI available but unbalanced at baseline). Author confirmed no CVD events or deaths, no atrial fibrillation. Provided data on HbA1c and CRP |
|
| Notes | Study funding: Coconut development board, Amrita Institute of Medical Science and Research. Sponsors had no role in study design or analysis. Response to contact: Dr Vijayakumar replied with information on outcomes and methodology |
|
| Risk of bias | ||
| Bias | Authors' judgement | Support for judgement |
| Random sequence generation (selection bias) | Low risk | Block randomisation with 5 blocks of 40 |
| Allocation concealment (selection bias) | Unclear risk | Unclear |
| Blinding of participants and personnel (performance bias) All outcomes | Unclear risk | Open label. Participants and their families used branded oils, which were not identical in taste and other properties. Author states that only the dietitian was aware of the oil allocation. |
| Blinding of outcome assessment (detection bias) All outcomes | Unclear risk | Unclear, as above. Author suggests that outcomes assessors were blinded but does not provide a method for this. |
| Incomplete outcome data (attrition bias) All outcomes | Low risk | 5% withdrawals. Clear, with reasons |
| Selective reporting (reporting bias) | Unclear risk | Unclear, no protocol or trials register entry found |
| Attention Bias | Low risk | Unlikely as cooking oil was the intervention, and assessments appeared similarly timed |
| Compliance | High risk | Compliance poor assessed by biomarkers |
| Other bias | Low risk | None noted |
ALA: alpha linolenic acid (n‐3 18:3); BP: blood pressure; CHD: coronary heart disease; CHO: carbohydrate; CRP: C‐reactive protein; CVD: cardiovascular disease; DHA: docosahexaenoic acid (n‐3 22:6); DPA: docosapentaenoic acid (n‐3 22:5); EPA: eicosapentaenoic acid (n‐3 20:5); EPO: evening primrose oil; ESR: erythrocyte sedimentation rate; GFR: glomerular filtration rate; GLA: gamma linolenic acid (n‐6 18:3); GP: general practitioner; GTT: glucose tolerance test; HbA1c: glycated haemoglobin (a measure of glucose metabolism); HDL: high‐density lipoprotein, a lipid (fat) fraction measured in human blood. HDL is thought to be protective; IHD: ischaemic heart disease; intervention: intervention arm; ITT: intention‐to‐treat; LA: linoleic acid (n‐6 18:2); LDL: low‐density lipoprotein, a lipid (fat) fraction measured in human blood. LDL is thought to contribute to atherosclerosis; MI: myocardial infarction; MS: multiple sclerosis; MUFA: monounsaturated fatty acid; NSAID: non‐steroidal anti‐inflammatory drug; PAD: peripheral arterial disease; P/S: polyunsaturated: saturated fatty acid ratio; PUFA: polyunsaturated fatty acid; RA: rheumatoid arthritis; RCT: randomised controlled trial; SD: standard deviation; SE: standard error; SFA: saturated fatty acid; TC: total cholesterol (combined lipid or fat, measured in human blood, includes TG, HDL and LDL); TG: triglyceride (a type of lipid or fat, measured in human blood); % E: percentage of energy intake from this nutrient.
Characteristics of excluded studies [ordered by study ID]
| Study | Reason for exclusion |
|---|---|
| Bierenbaum 1963 | Duration only 50 weeks |
| Bramkamp 1974 | Not an RCT |
| Dembinska‐Kiec 2010 | Not an RCT |
| Dembinska‐Kiec 2011 | Not an RCT |
| Elisha 2011 | Not an RCT |
| Finnegan 2003a | Irrelevant outcomes and control not minimal |
| Finnegan 2003b | Irrelevant intervention |
| Finnish Mental Hosp 1972 | Not randomised (cluster‐randomised, but < 6 clusters) |
| Gaullier 2004 | Irrelevant intervention |
| Gaullier 2005 | Not an RCT and control irrelevant |
| Gaullier 2007 | Irrelevant intervention |
| Ghafoorunissa 1995 | Control not minimal and short term trial (8 weeks) |
| Ghafoorunissa 2002 | Not an RCT |
| Harbige 2007 | No relevant outcomes reported and no author contact established |
| Harris 2009 | Not an RCT |
| Heine 1989 | Irrelevant participants |
| Hui 1989 | Intervention in rats |
| Jamal 1990 | First author of this publication Goran Jamal, was reprimanded by the General Medical Council in 2003 after being found guilty of research fraud in a drug trial involving EPO, the topic of this paper. The professional conduct committee of the GMC found Dr Jamal guilty of serious professional misconduct for falsifying his results in a multicentre trial of the drug Tarabetic, also known as Efamol, a constituent of evening primrose oil, intended for the treatment of diabetic peripheral neuropathy. We believe that this throws doubt on Dr Jamal's work on Efamol, including this trial |
| Khan 2003 | Duration was 8 months only |
| Kruger 1998 | GLA + EPA vs olive oil |
| Lands 1992 | Not an RCT |
| Larsen 2006 | Irrelevant intervention (CLA) |
| Leng 1998 | GLA + EPA vs sunflower oil (so n‐6 + n‐3 vs n‐6), no assessment of n‐6 |
| Ley 2004 | No aim to increase omega‐6 or PUFA, PUFA increased by over 10% but no information provided on omega‐6 fats |
| MARGARIN 2002 | Irrelevant intervention, ALA vs LA |
| Michalsen 2006 | Multifactorial (assessment of stress reduction and activity as well as diet) |
| Middleton 2002 | EPA + DHA + GLA vs LA, unclear which arm was higher in PUFA |
| Millar 1973 | No relevant outcomes reported and no reply from trialists |
| Minnesota Coronary 1989 | While participants were involved in this study for over 1 year on average they could move in and out of the institution in which the study took place, and therefore in and out of the study over the duration of the trial. Most participants were not involved in the study continuously for at least one year. |
| Moy 2001 | Aim was to reduce dietary fat (total and saturated fat reductions appear to have been achieved) but effects on PUFAs unclear (total, omega‐6 and omega‐3 intakes not reported) |
| Oslo Diet Heart 1966 | Intervention group received dietary advice for a diet rich in vegetable oils and low in animal fats, and also received a multivitamin. Multifactorial. Recommended that whale meat be substituted for land animal meats |
| Oxford Retinopathy 1978 | Advice in intervention was to alter fats and also to raise carbohydrates while limiting simple sugars, multifactorial |
| Reed 2014 | GLA plus omega‐3 vs sunflower oil plus omega‐3 – both arms high in n‐6 |
| Roche 2009 | Intervention and control irrelevant |
| Simon 1997 | No intention stated to alter omega‐6 or PUFA fats, and omega‐6 intake not reported |
| Sluijs 2010 | Trial of CLA, not relevant |
| STARS 1992 | Intervention encouraged to increase plant‐derived soluble fibre as well as alter dietary fats, multifactorial |
| Van der Merwe 1990 | Intervention <1 year |
| Vergroesen 1980 | Not an RCT |
| WHI 2006 | Dietary intervention was of dietary fat and also fruit and vegetables, multifactorial |
| WINS 2006 | Aim was to reduce total fat, no aim for omega‐6 fats and omega‐6 intakes not reported |
| Ziboh 2004 | GLA vs LA, not relevant intervention and control |
ALA: alpha linolenic acid (n‐3 18:3); CLA: conjugated linoleic acid (a family of isomers of linoleic acid, some of which are trans fats); DHA: docosahexaenoic acid (n‐3 22:6); EPA: eicosapentaenoic acid (n‐3 20:5); EPO: evening primrose oil; GLA: gamma linolenic acid (n‐6 18:3); LA: linoleic acid (n‐6 18:2); PUFA: polyunsaturated fatty acid; RCT: randomised controlled trial.
Characteristics of ongoing studies [ordered by study ID]
Chandrakala 2010.
| Trial name or title | Long‐term effects of a reduced fat diet intervention in pre‐diabetes |
| Methods | RCT |
| Participants | Participants with pre‐diabetes (IFG/IGT), 201 participants discussed in one abstract, 134 in a later abstract |
| Interventions | Each for 3 years: Arm 1: reduced fat diet (fat content at or below 20% total energy, ratio of PUFA/SFA 0.8 to 1.0) Arm 2: normal/control diet |
| Outcomes | Incidence of diabetes, BMI, lipids, insulin, plasma glucose, HbA1c, blood pressure, nutritional intake |
| Starting date | Registered on trials registry: no registration found Study start date: not reported Estimated study completion date: not reported |
| Contact information | Chandrakala Galla, chandrakala.galla@gmail.com; Arpana Gaddam, dr.arpanag@gmail.com |
| Notes | Authors written to in 2016: Dr Gaddam confirmed work submitted as a PhD but not published in full. Requested copy of PhD thesis, but no reply to date Funding: DiabetOmics India |
BMI: body mass index; HbA1c: glycated haemoglobin (a measure of glucose metabolism); IFG: impaired fasting glucose, another name for IGT; IGT: impaired glucose tolerance (a pre‐diabetic state); PUFA: polyunsaturated fatty acid; RCT: randomised controlled trial; SFA: saturated fatty acid
Differences between protocol and review
For the update, we introduced some changes from Al‐Khudairy 2015 to broaden the review to fit with the requirements of WHO NUGAG Subgroup on Diet and Health.
We included studies in a wider variety of adults, such as those with diabetes or CVD at baseline, as the original review was of primary prevention only and excluded diabetes.
Effects of dietary changes needed to be assessed over at least one year.
We included studies that compared higher omega‐6 fat intake with lower omega‐6 fat intake (not only usual diet).
We carried out sensitivity and subgroup analyses for primary review outcomes as planned, and also for key outcomes.
Addition of new pre‐planned subgroups requested by WHO NUGAG Subgroup on Diet and Health .
We performed meta‐regression to look for dose‐response and duration effects of omega‐6 fats within this review and across studies from three reviews (this review, omega‐3 (Abdelhamid 2018a) and total PUFA (Abdelhamid 2018b)).
For this review update we intended to assess causality (another aspect of performance bias, where a study intervention included changes other than the change in omega‐6 fat intake, when there would be high risk of bias) when assessing risk of bias, but as we limited inclusion to studies where the dietary changes were limited to dietary fats, this was not needed and so omitted. We also intended to assess whether a study was pre‐registered on a trials register (registration date was before outcome data collection began; Roberts 2015), but we incorporated the issue of pre‐registration into selective outcome reporting and did not use it as a separate form of assessment.
Contributions of authors
KR and LH conceived the review; KR and LA‐K led the original version of this review; KR, LA‐K and LH were authors of the original version of this review (Al‐Khudairy 2015). LH designed the searches, which CB developed, refined, ran and de‐duplicated. LH, ASA, SMAA, FS, JSB, KHOD and TJB screened titles and abstracts; LH, ASA, SMAA, KHOD, LA‐K, KR and JSB assessed full‐text papers for inclusion; LH and JSB searched trials registers and assessed entries for inclusion; LH and ASA located full texts, managed assessment and collection of titles, abstracts and full texts, data extraction and risk of bias assessment; all authors carried out data extraction and assessed risk of bias. LH, KHOD and JSB designed the 'Risk of bias' assessment; SMAA, JSB, KHOD, TJB, ASA and LH wrote to study authors; LH, KHOD and ASA carried out data checks; SMAA, JSB, TJB, LH and ASA tabulated intake and status data. FS, KHOD, JSB and LH provided methodological support. LH, ASA, SMAA, JSB, TJB, KHOD, DHD, ATO and LEW entered data into RevMan and ran meta‐analyses. LH wrote the first draft of the review and of the WHO report and carried out analyses and interpretation. All authors critically read and commented on the final draft and agreed to submit it.
Sources of support
Internal sources
University of East Anglia, UK.
Warwick Medical School, University of Warwick, UK.
External sources
-
The World Health Organization, Other.
Funding to carry out this systematic review update, which was commissioned to underpin WHO guidance on polyunsaturated fats, came from the World Health Organization. The funding was provided to UEA and some authors were employed using this funding (Hooper L, Abdelhamid AS, Brainard JS, Ajabnoor SM, Song F, Deane KHO).
The original version of this review was supported by a NIHR Cochrane Programme Grant, UK.
Karen Rees and Lena AlKhudairy are also supported by the National Institute for Health Research (NIHR) Collaboration for Leadership in Applied Health Research and Care West Midlands at University Hospitals Birmingham NHS Foundation Trust, UK.
This project was supported by the National Institute for Health Research, via Cochrane Infrastructure funding to the Heart Group. The views and opinions expressed therein are those of the authors and do not necessarily reflect those of the Systematic Reviews Programme, NIHR, NHS or the Department of Health, UK, Other.
Declarations of interest
LH: WHO provided funding to the University of East Anglia to support this review update. Some of this funding was used to fund LH's employment. WHO also funded LH's attendance at WHO NUGAG Subgroup on Diet and Health and CODEX meetings to discuss and present this review and others in this set. No other conflicts known.
LA‐K: none known.
ASA: WHO provided funding to the University of East Anglia to support this review update. Some of this funding was used to fund ASA's employment. WHO also funded ASA's attendance at WHO NUGAG Subgroup on Diet and Health meetings to discuss and present this review and others in this set. No other conflicts known.
KR: none known.
JSB: WHO provided funding to the University of East Anglia to support this review update. Some of this funding was used to fund JSB's employment. No other conflicts known.
TJB: WHO provided funding to the University of East Anglia to support this review update. Some of this funding was used to fund TJB's employment. No other conflicts known.
SMAA: WHO provided funding to the University of East Anglia to support this review update. Some of this funding was used to fund SMAA's employment. No other conflicts known.
ATO'B: none known; carried out as part of his MBBS degree at the University of East Anglia.
LEW: none known; carried out as part of her MBBS degree at the University of East Anglia.
DHD: none known; carried out as part of her MBBS degree at the University of East Anglia.
FS: WHO provided funding to the University of East Anglia to support this review update. Some of this funding was used to fund FS's employment. No other conflicts known.
KHOD: WHO provided funding to the University of East Anglia to support this review update. Some of this funding was used to fund KHOD's employment. No other conflicts known.
Edited (no change to conclusions)
References
References to studies included in this review
Bates 1977 {published data only (unpublished sought but not used)}
- Bates D, Fawcett PR, Shaw DA, Weightman D. Trial of polyunsaturated fatty acids in non‐relapsing multiple sclerosis. British Medical Journal 1977;2(6092):932‐3. [DOI] [PMC free article] [PubMed] [Google Scholar]
- Dworkin RH, Bates D, Millar JH, Paty DW. Linoleic acid and multiple sclerosis: a reanalysis of three double‐blind trials. Neurology 1984;34(11):1441‐5. [DOI] [PubMed] [Google Scholar]
Bates 1978 {published data only (unpublished sought but not used)}
- Bates D, Fawcett PR, Shaw DA, Weightman D. Polyunsaturated fatty acids in treatment of acute remitting multiple sclerosis. British Medical Journal 1978;2(6149):1390‐1. [DOI] [PMC free article] [PubMed] [Google Scholar]
- Dworkin RH, Bates D, Millar JH, Paty DW. Linoleic acid and multiple sclerosis: a reanalysis of three double‐blind trials. Neurology 1984;34(11):1441‐5. [DOI] [PubMed] [Google Scholar]
Belch 1988 {published and unpublished data}
- Belch JJ, Ansell D, Madhok R, O'Dowd A, Sturrock RD. Effects of altering dietary essential fatty acids on requirements for non‐steroidal anti‐inflammatory drugs in patients with rheumatoid arthritis: a double blind placebo controlled study. Annals of the Rheumatic Diseases 1988;47(2):96‐104. [DOI] [PMC free article] [PubMed] [Google Scholar]
Black 1994 {published and unpublished data}
- Black HS, Herd JA, Goldberg LH, Wolf‐JE J, Thornby JI, Rosen T, et al. Effect of a low‐fat diet on the incidence of actinic keratosis. New England Journal of Medicine 1994;330(18):1272‐5. [DOI] [PubMed] [Google Scholar]
- Black HS, Thornby JI, Wolf‐JE J, Goldberg LH, Herd JA, Rosen T, et al. Evidence that a low‐fat diet reduces the occurrence of non‐melanoma skin cancer. International Journal of Cancer 1995;62(2):165‐9. [DOI] [PubMed] [Google Scholar]
- Jaax S, Scott LW, Wolf‐JE J, Thornby JI, Black HS. General guidelines for a low‐fat diet effective in the management and prevention of nonmelanoma skin cancer. Nutrition and Cancer 1997;27(2):150‐6. [DOI] [PubMed] [Google Scholar]
DART 1989 {published and unpublished data}
- Burr ML, Fehily AM. Fish and the heart. Lancet 1989;ii:1450‐2. [PubMed] [Google Scholar]
- Burr ML, Fehily AM, Gilbert JF, Rogers S, Holliday RM, Sweetnam PM, et al. Effects of changes in fat, fish, and fibre intakes on death and myocardial reinfarction: diet and reinfarction trial (DART). Lancet 1989;2(8666):757‐61. [DOI] [PubMed] [Google Scholar]
- Burr ML, Fehily AM, Rogers S, Welsby E, King S, Sandham S. Diet and reinfarction trial (DART): design, recruitment, and compliance. European Heart Journal 1989;10(6):558‐67. [DOI] [PubMed] [Google Scholar]
- Burr ML, Holliday RM, Fehily AM, Whitehead PJ. Haematological prognostic indices after myocardial infarction: evidence from the diet and reinfarction trial (DART). European Heart Journal 1992;13(2):166‐70. [DOI] [PubMed] [Google Scholar]
- Burr ML, Sweetham PM, Fehily AM. Diet and reinfarction (letter). European Heart Journal 1994;15(8):1152‐3. [DOI] [PubMed] [Google Scholar]
- Fehily AM, Vaughan‐Williams E, Shiels K, Williams AH, Horner M, Bingham G, et al. The effect of dietary advice on nutrient intakes: evidence from the diet and reinfarction trial (DART). Journal of Human Nutrition & Dietetics 1989;2(4):225‐5. [Google Scholar]
Dullart 1992 {published data only (unpublished sought but not used)}
- Dullaart RP, Beusekamp BJ, Meijer S, Hoogenberg K, Doormaal JJ, Sluiter WJ. Long‐term effects of linoleic‐acid‐enriched diet on albuminuria and lipid levels in type 1 (insulin‐dependent) diabetic patients with elevated urinary albumin excretion. Diabetologia 1992;35(2):165‐72. [PUBMED: 1547922] [DOI] [PubMed] [Google Scholar]
GLAMT 1993 {published data only}
- Keen H, Payan J, Allawi J, Walker J, Jamal GA, Weir AI, et al. Treatment of diabetic neuropathy with gamma‐linolenic acid. The gamma‐Linolenic Acid Multicenter Trial Group. Diabetes Care 1993;16(1):8‐15. [DOI] [PubMed] [Google Scholar]
Houtsmuller 1979 {published data only}
- Houtsmuller AJ, Zahn KJ, Henkes HE. Unsaturated fats and progression of diabetic retinopathy. Documenta Ophthalmologia 1979;48(2):363‐71. [DOI] [PubMed] [Google Scholar]
- Houtsmuller AJ, Hal‐Ferwerda J, Zahn KJ, Henkes HE. Favourable influences of linoleic acid on the progression of diabetic micro‐ and macroangiopathy. Nutrition and Metabolism 1980;24(Suppl 1):105‐18. [DOI] [PubMed] [Google Scholar]
- Houtsmuller AJ, Hal‐Ferwerda J, Zahn KJ, Henkes HE. Influence of different diets on the progression of diabetic retinopathy. Progress in Food Nutritition and Science 1980;4(5):41‐6. [PubMed] [Google Scholar]
Mansel 1990 {published data only (unpublished sought but not used)}
- Mansel RE, Gateley CA, Harrison BJ, Melhuish J, Sheridan W, Pye JK, et al. Effects and tolerability of n‐6 essential fatty acid supplementation in patients with recurrent breast cysts ‐‐ a randomized double‐blind placebo‐controlled trial. Journal of Nutritional Medicine 1990;1(3):195. [Google Scholar]
- Mansel RE, Harrison BJ, Melhuish J, Sheridan W, Pye JK, Pritchard G, et al. A randomized trial of dietary intervention with essential fatty acids in patients with categorized cysts. Annals of the New York Academy of Sciences 1990;586:288‐94. [DOI] [PubMed] [Google Scholar]
- Mansel RE, Pye JK, Hughes LE. Effects of essential fatty acids on cyclical mastalgia and noncyclical breat disorders. In: Horrobin DE editor(s). Omega‐6 Essential Fatty Acids: Pathophysiology and Roles in Clinical Medicine. New York: Wiley‐Liss, 1990:557‐66. [Google Scholar]
McIllmurray 1987 {published data only (unpublished sought but not used)}
- McIllmurray MB, Turkie W. Controlled trial of gamma linolenic acid in Duke's C colorectal cancer. British Medical Journal (Clinical research ed.) 1987;294(6582):1260 (correction BMJ 1987;295(6596):475). [DOI] [PMC free article] [PubMed] [Google Scholar]
Mendis 2001 {published data only}
- Mendis S, Samarajeewa U, Thattil RO. Coconut fat and serum lipoproteins: effects of partial replacement with unsaturated fats. British Journal of Nutrition 2001;85(5):583‐9. [DOI] [PubMed] [Google Scholar]
MRC 1968 {published and unpublished data}
- Ederer F, Leren P, Turpeinen O, Frantz ID Jr. Cancer among men on cholesterol lowering diets: experience of five clinical trials. Lancet 1971;2:203‐6. [DOI] [PubMed] [Google Scholar]
- Heady JA. Are PUFA harmful?. British Medical Journal 1974;1(898):115‐6. [DOI] [PMC free article] [PubMed] [Google Scholar]
- MRC. Controlled trial of soya‐bean oil in myocardial infarction. Lancet 1968;2(570):693‐9. [PubMed] [Google Scholar]
NDHS Faribault 1968 {published data only (unpublished sought but not used)}
- Anon. The National Diet‐Heart Study. Nutrition Reviews 1968;26(5):133‐6. [DOI] [PubMed] [Google Scholar]
- Baker BM, Frantz ID Jr, Keys A, Kinsell LW, Page IH, Stamler J, et al. The National Diet‐Heart Study: an initial report. JAMA 1963;185:105‐6. [DOI] [PubMed] [Google Scholar]
- Brown HB. The National Diet Heart Study ‐ implications for dietitians and nutritionists. Journal of the American Dietetic Association 1968;52:279‐87. [PubMed] [Google Scholar]
- Ederer F, Leren P, Turpeinen O, Frantz ID Jr. Cancer among men on cholesterol‐lowering diets: Eperience from five clinical trials. Lancet 1971;298(7717):203‐6. [DOI] [PubMed] [Google Scholar]
- NDHS Research Group. The National Diet‐Heart Study final report. Circulation 1968;37(II):1‐428. [PubMed] [Google Scholar]
- Page IH, Brown HB. Some observations on the National Diet‐Heart Study. Circulation 1968;37:313‐5. [DOI] [PubMed] [Google Scholar]
NDHS Open 1st 1968 {published data only (unpublished sought but not used)}
- Anon. The National Diet‐Heart Study. Nutrition Reviews 1968;26(5):133‐6. [DOI] [PubMed] [Google Scholar]
- Baker BM, Frantz ID Jr, Keys A, Kinsell LW, Page IH, Stamler J, et al. The National Diet‐Heart Study: An initial report. JAMA 1963;185:105‐6. [DOI] [PubMed] [Google Scholar]
- Brown HB. The National Diet Heart Study ‐ implications for dietitians and nutritionists. Journal of the American Dietetic Association 1968;52:279‐87. [PubMed] [Google Scholar]
- Ederer F, Leren P, Turpeinen O, Frantz ID Jr. Cancer among men on cholesterol‐lowering diets: Eperience from five clinical trials. Lancet 1971;298(7717):203‐206. [DOI] [PubMed] [Google Scholar]
- NDHS Research Group. The National Diet‐Heart Study final report. Circulation 1968;37(II):1‐428. [PubMed] [Google Scholar]
- Page IH, Brown HB. Some observations on the National Diet‐Heart Study. Circulation 1968;37:313‐5. [DOI] [PubMed] [Google Scholar]
Rose 1965 {published data only}
- Rose GA, Thomson WB, Williams RT. Corn oil in treatment of ischaemic heart disease. British Medical Journal 1965;1(5449):1531‐3. [PUBMED: 14288105] [DOI] [PMC free article] [PubMed] [Google Scholar]
Schirmer 2007 {published data only (unpublished sought but not used)}
- Schirmer MA, Phinney SD. Gamma‐linolenate reduces weight regain in formerly obese humans. Journal of Nutrition 2007;137(6):1430‐5. [PUBMED: 17513402] [DOI] [PubMed] [Google Scholar]
Sydney Diet‐Heart 1978 {published and unpublished data}
- Blacket RB, Leelarthaepin B, McGilchrist C, Palmer AJ, Woodhill JM. The synergistic effect of weight loss and changes in dietary lipids on the serum cholesterol of obese men with hypercholesterolaemia: implications for prevention of coronary heart disease. Australian and New Zealand Journal of Medicine 1979;9:521‐9. [DOI] [PubMed] [Google Scholar]
- Ramsden CE, Zamora D, Leelarthaepin B, Majchrzak‐Hong SF, Faurot KR, Suchindran CM, et al. Use of dietary linoleic acid for secondary prevention of coronary heart disease and death: evaluation of recovered data from the Sydney Diet Heart Study and updated meta‐analysis. (Erratum appears in BMJ. 2013;346:f903). BMJ 2013;346:e8707. [DOI] [PMC free article] [PubMed] [Google Scholar]
- Woodhill JM, Palmer AJ, Leelarthaepin B, McGilchrist C, Blacket RB. Low fat, low cholesterol diet in secondary prevention of coronary heart disease. Advances in Experimental Medicine and Biology 1978;109:317‐30. [DOI] [PubMed] [Google Scholar]
Veterans Admin 1969 {published data only (unpublished sought but not used)}
- Dayton S, Hashimoto S, Dixon W, Pearce ML. Composition of lipids in human serum and adipose tissue during prolonged feeding of a diet high in unsaturated fat. Journal of Lipid Research 1966;7:103‐11. [PubMed] [Google Scholar]
- Dayton S, Hashimoto S, Pearce ML. Adipose tissue linoleic acid as a criterion of adherence to a modified diet. Journal of Lipid Research 1967;8:508‐10. [PubMed] [Google Scholar]
- Dayton S, Hashimoto S, Pearce ML. Influence of a diet high in unsaturated fat upon composition of arterial tissue and atheromata in man. Circulation 1965;32:911‐24. [DOI] [PubMed] [Google Scholar]
- Dayton S, Hashimoto S, Rosenblum D, Pearce M. Vitamin E status of humans during prolonged feeding of unsaturated fats. Journal of Laboratory and Clinical Medicine 1965;65(5):739‐47. [PubMed] [Google Scholar]
- Dayton S, Pearce ML. Diet and atherosclerosis. Lancet 1970;1(644):473‐4. [DOI] [PubMed] [Google Scholar]
- Dayton S, Pearce ML. Diet and cardiovascular diseases. Lancet 1969;1(584):51‐2. [DOI] [PubMed] [Google Scholar]
- Dayton S, Pearce ML. Diet high in unsaturated fat: a controlled clinical trial. Minnesota Medicine 1969;1969:1237‐42. [DOI] [PubMed] [Google Scholar]
- Dayton S, Pearce ML. Prevention of coronary heart disease and other complications of atherosclerosis by modified diet. American Journal of Medicine 1969;46:751‐62. [DOI] [PubMed] [Google Scholar]
- Dayton S, Pearce ML. Trial of unsaturated‐fat diet. Lancet 1968;2(581):1296‐7. [DOI] [PubMed] [Google Scholar]
- Dayton S, Pearce ML, Goldman H, Harnish A, Plotkin D, Shickman M, et al. Controlled trial of a diet high in unsaturated fat for prevention of atherosclerotic complications. Lancet 1968;2(577):1060‐2. [DOI] [PubMed] [Google Scholar]
- Dayton S, Pearce ML, Hashimoto S, Dixon WJ, Tomayasu U. A controlled clinical trial of a diet high in unsaturated fat in preventing complications of atherosclerosis. Circulation 1969;15(1, Suppl 2):II‐1‐63. [Google Scholar]
- Dayton S, Pearce ML, Hashimoto S, Fakler LJ, Hiscock E, Dixon WJ. A controlled clinical trial of a diet high in unsaturated fat. New England Journal of Medicine 1962;266:1017‐23. [DOI] [PubMed] [Google Scholar]
- Ederer F, Leren P, Turpeinen O, Frantz ID Jr. Cancer among men on cholesterol‐lowering diets: experience from five clinical trials. Lancet 1971;298(7717):203‐206. [DOI] [PubMed] [Google Scholar]
- Hiscock E, Dayton S, Pearce ML, Hashimoto S. A palatable diet high in unsaturated fat. Journal of the American Dietetic Association 1962;40:427‐31. [PubMed] [Google Scholar]
- Pearce ML, Dayton S. Incidence of cancer in men on a diet high in polyunsaturated fat. Lancet 1971;1(697):464‐7. [DOI] [PubMed] [Google Scholar]
- Sturdevant RA, Pearce ML, Dayton S. Increased prevalence of cholelithiasis in men ingesting a serum‐cholesterol‐lowering diet. New England Journal of Medicine 1973;288(1):24‐7. [DOI] [PubMed] [Google Scholar]
- Tompkins MJ, Dayton S, Pearce ML. Effect of long‐term feeding of various fats on whole blood clotting times in men. Journal of Laboratory and Clinical Medicine 1964;64(5):763‐72. [PubMed] [Google Scholar]
Vijayakumar 2014 {published and unpublished data}
- Nandakumar S, Vijayakumar M, Krishnan S. Coconut oil vs sunflower oil in atherosclerosis. Challenges in dietary intervention. Indian Heart Journal 2014;66:S11. [Google Scholar]
- Vijayakumar M, Krishnaan S, Sundram KR, Vasudevan DM, Nandakumar S. What oil in patients with established coronary artery disease‐outcomes of two year dietary intervention with coconut oil & sunflower oil. Indian Heart Journal 2014;66:S12. [Google Scholar]
- Vijayakumar M, Vasudevan DM, Sundaram KR, Krishnan S, Vaidyanathan K, Nandakumar S, et al. A randomized study of coconut oil versus sunflower oil on cardiovascular risk factors in patients with stable coronary heart disease. Indian Heart Journal 2016;68:498‐506. [DOI: 10.1016/j.ihj.2015.10.384] [DOI] [PMC free article] [PubMed] [Google Scholar]
References to studies excluded from this review
Bierenbaum 1963 {published data only}
- Bierenbaum ML, Green DP, Gherman C, Florin A, Caidwell AB. The effects of two low fat dietary patterns on the blood cholesterol level of young male coronary patients. Journal of Chronic Diseases 1963;16(10):1073‐83. [DOI] [PubMed] [Google Scholar]
Bramkamp 1974 {published data only}
- Bramkamp K, Wirths W. Influence of linoleic acid enriched margarine on serum cholesterol levels in the elderly [Über den Einfluß von linolsäurereicher Margarine auf den Serumcholesterinspiegel älterer Menschen]. Zeitschrift für Ernährungswissenschaft 1974;13(1‐2):59‐68. [DOI] [PubMed] [Google Scholar]
Dembinska‐Kiec 2010 {published data only}
- Dembinska‐Kiec A, Malczewska‐Malec M, Roche H, Leszczynska‐Golabek I, Hartwich J, Wybranska I, et al. The effect of the n‐3/n‐6 PUFA ratio on the transformation of postprandial state proatherogenic LDL phenotype and oxidative stress parameters. Atherosclerosis Supplements 2010;11(2):129‐30. [Google Scholar]
Dembinska‐Kiec 2011 {published data only}
- Dembinska‐Kiec A, Malczewska‐Malec M, Hartwich J, Wnek D, Goralska J, Kiec‐Wilk B, et al. The effect of dietary intervention on proatherogenic profile of lipoproteins and the blood oxidative stress parameters measured in the course of postprandial lipemia: Lipgene study. Journal of Diabetes 2011;3(s1):28. [Google Scholar]
Elisha 2011 {published data only}
- Elisha B, Guebre‐Egziabher F, Vidal H, Bastard J, Laville M, Rabasa‐Lhoret R. From French to Mediterranean diet: importance of the omega‐6/omega‐3 fatty acids ratio. World Review of Nutrition and Dietetics 2011;102:81‐91. [DOI] [PubMed] [Google Scholar]
Finnegan 2003a {published data only}
- Finnegan YE, Howarth D, Minihane AM, Kew S, Miller GJ, Calder PC, et al. Plant and marine derived (n‐3) polyunsaturated fatty acids do not affect blood coagulation and fibrinolytic factors in moderately hyperlipidemic humans. Journal of Nutrition 2003;133(7):2210‐3. [DOI] [PubMed] [Google Scholar]
Finnegan 2003b {published data only}
- Finnegan YE, Minihane AM, Leigh‐Firbank EC, Kew S, Meijer GW, Muggli R, et al. Plant‐ and marine‐derived n‐3 polyunsaturated fatty acids have differential effects on fasting and postprandial blood lipid concentrations and on the susceptibility of LDL to oxidative modification in moderately hyperlipidemic subjects. American Journal of Clinical Nutrition 2003;77(4):783‐95. [DOI] [PubMed] [Google Scholar]
Finnish Mental Hosp 1972 {published data only}
- Miettinen M, Turpeinen O, Karvonen MJ, Elosuo R, Paavilainen E. Effect of cholesterol‐lowering diet on mortality from coronary heart‐disease and other causes: a twelve‐year clinical trial in men and women. Lancet 1972;2(782):835‐8. [DOI] [PubMed] [Google Scholar]
- Miettinen M, Turpeinen O, Karvonen MJ, Pekkarinen M, Paavilainen E, Elosuo R. Dietary prevention of coronary heart disease in women: the Finnish mental hospital study. International Journal of Epidemiology 1983;12(1):17‐25. [DOI] [PubMed] [Google Scholar]
- Turpeinen O, Miettinen M, Karvonen M, Roine P, Pekkarinen M, Lehtosuo EJ, et al. Dietary prevention of coronary heart disease: long‐term experiment. I. Observations on male subjects. American Journal of Clinical Nutrition 1968;21(4):255‐76. [DOI] [PubMed] [Google Scholar]
Gaullier 2004 {published data only}
- Gaullier JM, Halse J, Høye K, Kristiansen K, Fagertun H, Vik H, et al. Conjugated linoleic acid supplementation for 1 y reduces body fat mass in healthy overweight humans. American Journal of Clinical Nutrition 2004;79(6):1118‐25. [DOI] [PubMed] [Google Scholar]
Gaullier 2005 {published data only}
- Gaullier JM, Halse J, Høye K, Kristiansen K, Fagertun H, Vik H, et al. Supplementation with conjugated linoleic acid for 24 months is well tolerated by and reduces body fat mass in healthy, overweight humans. Journal of Nutrition 2005;135(4):778‐84. [DOI] [PubMed] [Google Scholar]
Gaullier 2007 {published data only}
- Gaullier JM, Halse J, Høivik HO, Høye K, Syvertsen C, Nurminiemi M, et al. Six months supplementation with conjugated linoleic acid induces regional‐specific fat mass decreases in overweight and obese. British Journal of Nutrition 2007;97(3):550‐60. [DOI] [PubMed] [Google Scholar]
Ghafoorunissa 1995 {published data only}
- Ghafoorunissa, Reddy V, Sesikaran B. Palmolein and groundnut oil have comparable effects on blood lipids and platelet aggregation in healthy Indian subjects. Lipids 1995;30(12):1163‐9. [DOI] [PubMed] [Google Scholar]
Ghafoorunissa 2002 {published data only}
- Ghafoorunissa, Vani A, Laxmi R, Sesikeran B. Effects of dietary alpha‐linolenic acid from blended oils on biochemical indices of coronary heart disease in Indians. Lipids 2002;37(11):1077‐86. [DOI] [PubMed] [Google Scholar]
Harbige 2007 {published data only}
- Harbige LS, Sharief MK. Polyunsaturated fatty acids in the pathogenesis and treatment of multiple sclerosis. British Journal of Nutrition 2007;98(Suppl 1):S46‐53. [DOI] [PubMed] [Google Scholar]
Harris 2009 {published data only}
- Harris WS, Mozaffarian D, Rimm E, Kris‐Etherton P, Rudel LL, Appel LJ, et al. Omega‐6 fatty acids and risk for cardiovascular disease: a science advisory from the American Heart Association Nutrition Subcommittee of the Council on Nutrition, Physical Activity, and Metabolism; Council on Cardiovascular Nursing; and Council on Epidemiology and Prevention. Circulation 2009;119(6):902‐7. [DOI] [PubMed] [Google Scholar]
Heine 1989 {published data only}
- Heine RJ, Mulder C, Popp‐Snijders C, Meer J, Veen EA. Linoleic‐acid‐enriched diet: long‐term effects on serum lipoprotein and apolipoprotein concentrations and insulin sensitivity in noninsulin‐dependent diabetic patients. American Journal of Clinical Nutrition 1989;49(3):448‐56. [DOI] [PubMed] [Google Scholar]
Hui 1989 {published data only}
- Hui R, St‐Louis J, Falardeau P. Anti‐hypertensive properties of linoleic acid and fish oil omega‐3 fatty acids independent of the prostaglandin system. American Journal of Hypertension 1989;2(8):610‐7. [DOI] [PubMed] [Google Scholar]
Jamal 1990 {published data only}
- Dyer O. News Roundup: GMC reprimands doctor for research fraud. BMJ 2003;326:730. [DOI: 10.1136/bmj.326.7392.730/a] [DOI] [PMC free article] [PubMed] [Google Scholar]
- Jamal GA, Carmichael H. The effect of gamma‐linolenic acid on human diabetic peripheral neuropathy: a double‐blind placebo‐controlled trial. Diabetic Medicine 1990;7(4):319‐23. [DOI] [PubMed] [Google Scholar]
Khan 2003 {published data only}
- Khan F, Elherik K, Bolton‐Smith C, Barr R, Hill A, Murrie I, et al. The effects of dietary fatty acid supplementation on endothelial function and vascular tone in healthy subjects. Cardiovascular Research 2003;59(4):955‐62. [DOI] [PubMed] [Google Scholar]
Kruger 1998 {published data only}
- Kruger MC, Coetzer H, Winter R, Gericke G, Papendorp DH. Calcium, gamma‐linolenic acid and eicosapentaenoic acid supplementation in senile osteoporosis. Aging‐Clinical & Experimental Research 1998;10(5):385‐94. [DOI] [PubMed] [Google Scholar]
Lands 1992 {published data only}
- Lands WE, Libelt B, Morris A, Kramer NC, Prewitt TE, Bowen P, et al. Maintenance of lower proportions of (n‐6) eicosanoid precursors in phospholipids of human plasma in response to added dietary (n‐3) fatty acids. Biochimica et Biophysica Acta 1992;1180(2):147‐62. [DOI] [PubMed] [Google Scholar]
Larsen 2006 {published data only}
- Larsen TM, Toubro S, Gudmundsen O, Astrup A. Conjugated linoleic acid supplementation for 1 y does not prevent weight or body fat regain. American Journal of Clinical Nutrition 2006;83(3):606‐12. [DOI] [PubMed] [Google Scholar]
Leng 1998 {published data only}
- Leng GC, Lee AJ, Fowkes FG, Jepson RG, Lowe GD, Skinner ER, et al. Randomized controlled trial of gamma‐linolenic acid and eicosapentaenoic acid in peripheral arterial disease. Clinical Nutrition 1998;17(6):265‐71. [DOI] [PubMed] [Google Scholar]
Ley 2004 {published and unpublished data}
- Ley SJ, Metcalf PA, Scragg RKR, Swinburn BA. Long‐term effects of a reduced fat diet intervention on cardiovascular disease risk factors in individuals with glucose intolerance. Diabetes Research and Clinical Practice 2004;63:103‐12. [DOI] [PubMed] [Google Scholar]
- Swinburn BA, Metcalf PA, Ley SJ. Long‐term (5‐year) effects of a reduced‐fat diet intervention in individuals with glucose intolerance. Diabetes Care 2001;24(4):619‐24. [DOI] [PubMed] [Google Scholar]
- Swinburn BA, Woollard GA, Chang EC, Wilson MR. Effects of reduced‐fat diets consumed ad libitum on intake of nutrients particularly antioxidant vitamins. Journal of the American Dietetic Association 1999;99(11):1400‐5. [DOI] [PubMed] [Google Scholar]
MARGARIN 2002 {published data only}
- Bemelmans WJ, Broer J, Feskens EJ, Smit AJ, Muskiet FA, Lefrandt JD, et al. Effect of an increased intake of α‐linolenic acid and group nutritional education on cardiovascular risk factors: the Mediterranean Alpha‐linolenic Enriched Groningen Dietary Intervention (MARGARIN) study. American Journal of Clinical Nutrition 2002;75(2):221‐7. [DOI] [PubMed] [Google Scholar]
- Bemelmans WJ, Broer J, Vries JH, Hulshof KF, May JF, Meyboom‐de Jong B. Impact of Mediterramean diet education versus posted leaflet on dietary habits and serum cholesterol in a high risk population for cardiovascular disease. Public Health Nutrition 2000;3(3):273‐83. [DOI] [PubMed] [Google Scholar]
- Bemelmans WJ, Lefrandt JD, Feskens EJ, Haelst PL, Broer J, Meyboom‐de Jong B, et al. Increased alpha‐linolenic acid intake lowers C‐reactive protein, but has no effect on markers of atherosclerosis. European Journal of Clinical Nutrition 2004;58(7):1083‐9. [DOI] [PubMed] [Google Scholar]
- Bemelmans WJ, Muskiet FA, Feskens EJ, Vries JH, Broer J, May JF, et al. Associations of alpha‐linolenic acid and linoleic acid with risk factors for coronary heart disease. European Journal of Clinical Nutrition 2000;54(12):865‐71. [DOI] [PubMed] [Google Scholar]
Michalsen 2006 {published data only}
- Michalsen A, Lehmann N, Pithan C, Knoblauch NT, Moebus S, Kannenberg F, et al. Mediterranean diet has no effect on markers of inflammation and metabolic risk factors in patients with coronary artery disease. European Journal of Clinical Nutrition 2006;60(4):478‐85. [DOI] [PubMed] [Google Scholar]
Middleton 2002 {published data only}
- Middleton SJ, Naylor S, Woolner J, Hunter JO. A double‐blind, randomized, placebo‐controlled trial of essential fatty acid supplementation in the maintenance of remission of ulcerative colitis. Alimentary Pharmacology and Therapeutics 2002;16(6):1131‐5. [PUBMED: 12030955] [DOI] [PubMed] [Google Scholar]
Millar 1973 {published data only}
- Millar JH, Zilkha KJ, Langman MJ, Wright HP, Smith AD, Belin J, et al. Double‐blind trial of linoleate supplementation of the diet in multiple sclerosis. British Medical Journal 1973;1(5856):765‐8. [DOI] [PMC free article] [PubMed] [Google Scholar]
Minnesota Coronary 1989 {published data only}
- Brewer ER, Ashman PL, Kuba K. The Minnesota Coronary Survey: composition of diets, adherence and serum lipid response. Circulation 1975;51 and 52(Suppl II):269. [Google Scholar]
- Dawson EA, Gatewood LC. The Minnesota Coronary Survey: methodology and characteristics of the population. Circulation 1975;51 and 52(Suppl II):271. [Google Scholar]
- Frantz ID Jr, Dawson EA, Ashman PL, Gatewood LC, Bartsch GE, Kuba K, et al. Test of effect of lipid lowering by diet on cardiovascular risk. The Minnesota Coronary Survey. Arteriosclerosis 1989;9(1):129‐35. [DOI] [PubMed] [Google Scholar]
- Frantz ID, Dawson EA, Kuba K, Brewer ER, Gatewood LC, Bartsch GE. The Minnesota Coronary Survey: effect of diet on cardiovascular events and deaths. Circulation 1975;51 and 52(Suppl II):4. [DOI] [PubMed] [Google Scholar]
- Ramsden CE, Zamora D, Majchrzak‐Hong S, Faurot KR, Broste SK, Frantz RP, et al. Re‐evaluation of the traditional diet‐heart hypothesis: analysis of recovered data from Minnesota Coronary Experiment (1968‐73). BMJ 2016;353:i1246. [DOI] [PMC free article] [PubMed] [Google Scholar]
Moy 2001 {published and unpublished data}
- Moy TF, Yanek LR, Raqueno JV, Bezirdjian PJ, Blumenthal RS, Wilder LB, et al. Dietary counselling for high blood cholesterol in families at risk of coronary disease. Preventive Cardiology 2001;4(4):158‐64. [DOI] [PubMed] [Google Scholar]
Oslo Diet Heart 1966 {published and unpublished data}
- Ederer F, Leren P, Turpeinen O, Frantz ID Jr. Cancer among men on cholesterol lowering diets: experience of five clinical trials. Lancet 1971;2:203‐6. [DOI] [PubMed] [Google Scholar]
- Leren P. The Oslo diet‐heart study. Eleven‐year report. Circulation 1970;42(5):935‐42. [DOI] [PubMed] [Google Scholar]
- Leren P. The effect of plasma cholesterol lowering diet in male survivors of myocardial infarction. A controlled clinical trial. Acta Medica Scandinavica. Supplementum 1966;466:1‐92. [PubMed] [Google Scholar]
- Leren P. The effect of plasma‐cholesterol‐lowering diet in male survivors of myocardial infarction: a controlled clinical trial. Bulletin of the New York Academy of Medicine 1968;44:1012‐21. [PMC free article] [PubMed] [Google Scholar]
Oxford Retinopathy 1978 {published and unpublished data}
- Coppack SW, Doll HA, Pim B, Hockaday TDR. Intravenous glucose tolerance and mortality in non‐insulin‐dependant diabetes mellitus. Quarterly Journal of Medicine 1990;75:451‐60. [PubMed] [Google Scholar]
- Hillson RM, Hockaday TDR, Mann JI, Newton DJ. Hyperinsulinaemia is associated with development of ECG abnormalities in diabetics. Diabetes Research 1984;1:143‐9. [PubMed] [Google Scholar]
- Hockaday TD, Hockaday JM, Mann JI, Turner RC. Prospective comparison of modified fat‐high‐carbohydrate with standard low‐carbohydrate dietary advice in the treatment of diabetes: one year follow‐up study. British Journal of Nutrition 1978;39(2):357‐62. [DOI] [PubMed] [Google Scholar]
- Howard‐Williams J, Patel P, Jelfs R, Carter RD, Awdry P, Bron A, et al. Polyunsaturated fatty acids and diabetic retinopathy. British Journal of Ophthalmology 1985;69(1):15‐8. [DOI] [PMC free article] [PubMed] [Google Scholar]
- Lopez‐Espinoza I, Howard WJ, Mann JI, Carter RD, Hockaday TD. Fatty acid composition of platelet phospholipids in non‐insulin‐dependent diabetics randomized for dietary advice. British Journal of Nutrition 1984;52(1):41‐7. [DOI] [PubMed] [Google Scholar]
Reed 2014 {published data only}
- Olendzki BC, Leung K, Buskirk S, Reed G, Zurier RB. Treatment of rheumatoid arthritis with marine and botanical oils: influence on serum lipids. Evidence‐Based Complementary & Alternative Medicine: eCAM 2011;2011:827286. [DOI] [PMC free article] [PubMed] [Google Scholar]
- Reed GW, Leung K, Rossetti RG, Vanbuskirk S, Sharp JT, Zurier RB. Treatment of rheumatoid arthritis with marine and botanical oils: an 18‐month, randomized, and double‐blind trial. Evidence‐Based Complementary & Alternative Medicine: eCAM 2014;2014:857456. [DOI] [PMC free article] [PubMed] [Google Scholar]
Roche 2009 {published data only}
- Roche H, Ferguson JF, Perez‐Martinez P, Lovegrove JA, Drevon CA, Defoort C, et al. Dietary fats, inflammation and insulin resistance‐insights from the lipgene study. Atherosclerosis Supplements 2009;10:2. [Google Scholar]
Simon 1997 {published and unpublished data}
- Djuric Z, Heilbrun LK, Reading BA, Boomer A, Valeriote FA, Martino S. Effects of a low fat diet on levels of oxidative damage to DNA in human peripheral nucleated blood cells. Journal of the National Cancer Institute 1991;83(11):766‐9. [DOI] [PubMed] [Google Scholar]
- Djuric Z, Martino S, Heilbrun LK, Hart RW. Dietary modulation of oxidative DNA damage. Advances In Experimental Medicine and Biology 1994;354:71‐83. [DOI] [PubMed] [Google Scholar]
- Kasim SE, Martino S, Kim P‐N, Khilnani S, Boomer A, Depper J, et al. Dietary and anthropometric determinants of plasma lipoproteins during a long‐term low‐fat diet in healthy women. American Journal of Clinical Nutrition 1993;57:146‐53. [DOI] [PubMed] [Google Scholar]
- Simon MS, Heilbrun LK, Boomer A, Kresge C, Depper J, Kim PN, et al. A randomised trial of a low‐fat dietary intervention in women at high risk for breast cancer. Nutrition and Cancer 1997;27(2):136‐42. [DOI] [PubMed] [Google Scholar]
Sluijs 2010 {published data only}
- Sluijs I, Plantinga Y, Roos B, Mennen LI, Bots ML. Dietary supplementation with cis‐9,trans‐11 conjugated linoleic acid and aortic stiffness in overweight and obese adults. American Journal of Clinical Nutrition 2010;91(1):175‐83. [DOI] [PubMed] [Google Scholar]
STARS 1992 {published and unpublished data}
- Blann AD, Jackson P, Bath PM, Watts GF. von Willebrand factor, a possible indicator of endothelial cell damage, decreases during long‐term compliance with a lipid‐lowering diet. Journal of Internal Medicine 1995;237:557‐61. [DOI] [PubMed] [Google Scholar]
- Watts GF. Nutritional, metabolic, and genetic determinants of the progression of coronary heart disease. STARS Group. Journal of Cardiovascular Pharmacology 1995;25(Suppl 4):S11‐9. [PubMed] [Google Scholar]
- Watts GF, Brunt JNH, Coltart DJ, Lewis B. The St. Thomas Atherosclerosis Regression Study (STARS). Atherosclerosis 1992;97:231. [Google Scholar]
- Watts GF, Jackson P, Burke V, Lewis B. Dietary fatty acids and progression of coronary artery disease in men. American Journal of Clinical Nutrition 1996;64:202‐9. [DOI] [PubMed] [Google Scholar]
- Watts GF, Jackson P, Mandalia S, Brunt JN, Lewis ES, Coltart DJ, et al. Nutrient intake and progression of coronary artery disease. American Journal of Cardiology 1994;73(5):328‐32. [DOI] [PubMed] [Google Scholar]
- Watts GF, Lewis B, Brunt JN, Lewis ES, Coltart DJ, Smith LD, et al. Effects on coronary artery disease of lipid‐lowering diet, or diet plus cholestyramine, in the St Thomas' Atherosclerosis Regression Study (STARS). Lancet 1992;339(8793):563‐9. [DOI] [PubMed] [Google Scholar]
- Watts GF, Lewis B, Brunt JNH, Swan AV. Coronary Atheroma Regression Trials. Lancet 1992;339(i):1241‐3. [PubMed] [Google Scholar]
- Watts GF, Lewis B, Jackson P, Burke V, Lewis ES, Brunt JN, et al. Relationships between nutrient intake and progression/regression of coronary atherosclerosis as assessed by serial quantitative angiography. Canadian Journal of Cardiology 1995;11(Suppl G):110G‐4G. [PubMed] [Google Scholar]
- Watts GF, Mandalia S, Brunt JN, Slavin BM, Coltart DJ, Lewis B. Independent associations between plasma lipoprotein subfraction levels and the course of coronary artery disease in the St. Thomas' Atherosclerosis Regression Study (STARS). Metabolism: Clinical and Experimental 1993;42:1461‐7. [DOI] [PubMed] [Google Scholar]
- Watts GF, Mandalia S, Slavin BM, Brunt JN, Coltart DJ, Lewis B. Metabolic determinants of the course of coronary artery disease in men. Clinical Chemistry 1994;40(12):2240‐6. [PubMed] [Google Scholar]
Van der Merwe 1990 {published data only}
- Merwe CF, Booyens J, Joubert HF, Merwe CA. The effect of gamma‐linolenic acid, an in vitro cytostatic substance contained in evening primrose oil, on primary liver cancer. A double‐blind placebo controlled trial. Prostaglandins Leukotrienes and Essential Fatty Acids 1990;40:199‐202. [DOI] [PubMed] [Google Scholar]
Vergroesen 1980 {published data only}
- Vergroesen AJ, Deckere EA, Hoor F, Hornstra G. Cardiovascular effects of linoleic acid. Progress in Food & Nutrition Science 1980;4(5):13‐25. [PubMed] [Google Scholar]
WHI 2006 {published data only}
- Anderson G, Cummings S, Freedman LS, Furberg C, Henderson M, Johnson SR, et al. Design of the Women's Health Initiative clinical trial and observational study. Controlled Clinical Trials 1998;19(1):61‐109. [DOI] [PubMed] [Google Scholar]
- Anderson GL, Manson J, Wallace R, Lund B, Hall D, Davis S, et al. Implementation of the Women's Health Initiative study design. Annals of Epidemiology 2003;13(9 Suppl):S5‐17. [DOI] [PubMed] [Google Scholar]
- Beresford SA, Johnson KC, Ritenbaugh C, Lasser NL, Snetselaar LG, Black HR, et al. Low‐fat dietary pattern and risk of colorectal cancer: the Women's Health Initiative Randomized Controlled Dietary Modification Trial. JAMA 2006;295(6):643‐54. [DOI] [PubMed] [Google Scholar]
- Bowen D, Ehret C, Pedersen M, Snetselaar L, Johnson M, Tinker L, et al. Results of an adjunct dietary intervention program in the Women's Health Initiative. Journal of the American Dietetic Association 2002;102(11):1631‐7. [DOI] [PubMed] [Google Scholar]
- Carty CL, Kooperberg C, Neuhouser ML, Tinker L, Howard B, Wactawski‐Wende J, et al. Low‐fat dietary pattern and change in body‐composition traits in the Women's Health Initiative Dietary Modification Trial. American Journal of Clinical Nutrition 2011;93:516‐24. [DOI] [PMC free article] [PubMed] [Google Scholar]
- Curb JD, McTiernan A, Heckbert SR, Kooperberg C, Stanford J, Nevitt M, et al. Outcomes ascertainment and adjudication methods in the Women's Health Initiative. Annals of Epidemiology 2003;13(9 Suppl):S122‐8. [DOI] [PubMed] [Google Scholar]
- Hays J, Hunt JR, Hubbell FA, Anderson GL, Limacher M, Allen C, et al. The Women's Health Initiative recruitment methods and results. Annals of Epidemiology 2003;13(9 Suppl):S18‐77. [DOI] [PubMed] [Google Scholar]
- Hebert JR, Patterson RE, Gorfine M, Ebbeling CB, Jeor ST, Chlebowski RT, et al. Differences between estimated caloric requirements and self‐reported caloric intake in the women's health initiative. Annals of Epidemiology 2003;13(9):629‐37. [DOI] [PubMed] [Google Scholar]
- Howard BV. Dietary fat and cardiovascular disease: putting the Women's Health Initiative in perspective. Nutrition Metabolism & Cardiovascular Diseases 2007;17(3):171‐4. [DOI] [PubMed] [Google Scholar]
- Howard BV, Manson JE, Stefanick ML, Beresford SA, Frank G, Jones B, et al. Low‐fat dietary pattern and weight change over 7 years: the Women's Health Initiative Dietary Modification Trial. JAMA 2006;295(1):39‐49. [DOI] [PubMed] [Google Scholar]
- Howard BV, Horn L, Hsia J, Manson JE, Stefanick ML, Wassertheil‐Smoller S, et al. Low‐fat dietary pattern and risk of cardiovascular disease: the Women's Health Initiative Randomized Controlled Dietary Modification Trial. JAMA 2006;295(6):655‐66. [DOI] [PubMed] [Google Scholar]
- Neuhouser ML, Tinker L, Shaw PA, Schoeller D, Bingham SA, Horn LV, et al. Use of recovery biomarkers to calibrate nutrient consumption self‐reports in the Women's Health Initiative. American Journal of Epidemiology 2008;167(10):1247‐59. [DOI] [PubMed] [Google Scholar]
- Patterson RE, Kristal A, Rodabough R, Caan B, Lillington L, Mossavar‐Rahmani Y, et al. Changes in food sources of dietary fat in response to an intensive low‐fat dietary intervention: early results from the Women's Health Initiative. Journal of the American Dietetic Association 2003;103(4):454‐60. [DOI] [PubMed] [Google Scholar]
- Patterson RE, Kristal AR, Tinker LF, Carter RA, Bolton MP, gurs‐Collins T, et al. Measurement characteristics of the Women's Health Initiative food frequency questionnaire. Annals of Epidemiology 1999;9(3):178‐87. [DOI] [PubMed] [Google Scholar]
- Prentice RL, Caan B, Chlebowski RT, Patterson R, Kuller LH, Ockene JK, et al. Low‐fat dietary pattern and risk of invasive breast cancer: the Women's Health Initiative Randomized Controlled Dietary Modification Trial. JAMA 2006;295(6):629‐42. [DOI] [PubMed] [Google Scholar]
- Prentice RL, Thomson CA, Caan B, Hubbell FA, Anderson GL, Beresford SA, et al. Low‐fat dietary pattern and cancer incidence in the Women's Health Initiative Dietary Modification Randomized Controlled Trial. Journal of the National Cancer Institute 2007;99(20):1534‐43. [DOI] [PMC free article] [PubMed] [Google Scholar]
- Ritenbaugh C, Patterson RE, Chlebowski RT, Caan B, Fels‐Tinker L, Howard B, et al. The Women's Health Initiative Dietary Modification trial: overview and baseline characteristics of participants. Annals of Epidemiology 2003;13(9 Suppl):S87‐97. [DOI] [PubMed] [Google Scholar]
- Robinson JG, Wallace R, Safford MM, Pettinger M, Cochrane B, Ko MG, et al. Another treatment gap: restarting secondary prevention medications: the Women's Health Initiative. Journal of Clinical Lipidology 2010;4:36‐45. [DOI] [PMC free article] [PubMed] [Google Scholar]
- Rossouw JE, Finnegan LP, Harlan WR, Pinn VW, Clifford C, McGowan JA. The evolution of the Women's Health Initiative: perspectives from the NIH. Journal of the American Medical Women's Association 1995;50(2):50‐5. [PubMed] [Google Scholar]
- The Women's Health Initiative Study Group. Design of the Women's Health Initiative clinical trial and observational study. Controlled Clinical Trials 1998;19(1):61‐109. [DOI] [PubMed] [Google Scholar]
- Tinker LF, Bonds DE, Margolis KL, Manson JE, Howard BV, Larson J, et al. Low‐fat dietary pattern and risk of treated diabetes mellitus in postmenopausal women: the Women's Health Initiative randomized controlled dietary modification trial. Archives of Internal Medicine 2008;168(14):1500‐11. [DOI] [PubMed] [Google Scholar]
- Tinker LF, Perri MG, Patterson RE, Bowen DJ, McIntosh M, Parker LM, et al. The effects of physical and emotional status on adherence to a low‐fat dietary pattern in the Women's Health Initiative. Journal of the American Dietetic Association 2002;102(6):789‐800. [DOI] [PubMed] [Google Scholar]
- Tinker LF, Rosal MC, Young AF, Perri MG, Patterson RE, Horn L, et al. Predictors of dietary change and maintenance in the Women's Health Initiative Dietary Modification Trial. Journal of the American Dietetic Association 2007;107(7):1155‐66. [DOI] [PubMed] [Google Scholar]
- Women's Health Initiative Study Group. Dietary adherence in the Women's Health Initiative Dietary Modification Trial. Journal of the American Dietetic Association 2004;104(4):654‐8. [DOI] [PubMed] [Google Scholar]
WINS 2006 {published and unpublished data}
- Chlebowski RT, Blackburn GL, Buzzard IM, Rose DP, Martino S, Khandekar JD, et al. Adherence to a dietary fat intake reduction program in postmenopausal women receiving therapy for early breast cancer. The Women's Intervention Nutrition Study. Journal of Clinical Oncology 1993;11(11):2072‐80. [DOI] [PubMed] [Google Scholar]
- Chlebowski RT, Blackburn GL, Thomson CA, Nixon DW, Shapiro A, Hoy MK, et al. Dietary fat reduction and breast cancer outcome: interim efficacy results from the women's intervention nutrition study. JNCI Journal of the National Cancer Institute 2006;98(24):1767‐76. [DOI] [PubMed] [Google Scholar]
- Chlebowski RT, Rose DP, Buzzard IM, Blackburn GL, York M, Insull W, et al. Dietary fat reduction in adjuvant breast cancer therapy: current rationale and feasibility issues. Adjuvant. The Cancer Journal 1990;6:357‐63. [Google Scholar]
- Hoy MK, Winters BL, Chlebowski RT, Papoutsakis C, Shapiro A, Lubin MP, et al. Implementing a low‐fat eating plan in the Women's Intervention Nutrition Study. Journal of the American Dietetic Association 2009;109(4):688‐96. [DOI] [PMC free article] [PubMed] [Google Scholar]
- Rose DP, Chlebowski RT, Connolly JM, Jones LA, Wynder EL. Effects of tamoxifen adjuvant therapy and a low‐fat diet on serum binding proteins and estradiol bioavailability in postmenopausal breast cancer patients. Cancer Research 1992;52:5386‐90. [PubMed] [Google Scholar]
- Rose DP, Connolly JM, Chlebowski RT, Buzzard IM, Wynder EL. The effects of a low‐fat dietary intervention and tamoxifen adjuvant therapy on the serum estrogen and sex hormone‐binding globulin concentrations of postmenopausal breast cancer patients. Breast Cancer Research & Treatment 1993;27(3):253‐62. [DOI] [PubMed] [Google Scholar]
- Wynder EL, Cohen LA, Winters BL. The challenges of assessing fat intake in cancer research investigations. Journal of the American Dietetic Association 1997;97(7 Suppl):S5‐8. [DOI] [PubMed] [Google Scholar]
Ziboh 2004 {published data only}
- Ziboh VA, Naguwa S, Vang K, Wineinger J, Morrissey BM, Watnik M, et al. Suppression of leukotriene B4 generation by ex‐vivo neutrophils isolated from asthma patients on dietary supplementation with gammalinolenic acid‐containing borage oil: possible implication in asthma. Clinical & Developmental Immunology 2004;11(1):13‐21. [DOI] [PMC free article] [PubMed] [Google Scholar]
References to ongoing studies
Chandrakala 2010 {published data only (unpublished sought but not used)}
- Chandrakala G, Arpana G, Rao PV. Long‐term effects of a reduced fat diet intervention in pre‐diabetes. 70th Scientific Sessions of the American Diabetes Association; 25‐29 June 2010; Orlando (FL). 2010; Vol. professional.diabetes.org/meeting/scientific‐sessions/70th‐scientific‐sessions‐2010:195‐PO.
- Chandrakala G, Arpana G, Sreenivas T, Rao PV. Low‐fat (<20%) diets prevent type 2 diabetes mellitus. Diabetes 2012;61:A190. [Google Scholar]
Additional references
Abdelhamid 2017
- Abdelhamid A, Hooper L, Welch A. Polyunsaturated fatty acids for musculoskeletal health and functional status in older adults. PROSPERO 2017 CRD42017079211. Available from: www.crd.york.ac.uk/PROSPERO/display_record.php?ID=CRD42017079211.
Abdelhamid 2018a
- Abdelhamid AS, Brown TJ, Brainard JS, Biswas P, Thorpe GC, Moore HJ, et al. Omega‐3 fatty acids for the primary and secondary prevention of cardiovascular disease. Cochrane Database of Systematic Reviews 2018, Issue 7. [DOI: 10.1002/14651858.CD003177.pub3] [DOI] [PMC free article] [PubMed] [Google Scholar]
Abdelhamid 2018b
- Abdelhamid AS, Martin N, Bridges C, Brainard JS, Wang X, Brown TJ, et al. Polyunsaturated fatty acids for the primary and secondary prevention of cardiovascular disease. Cochrane Database of Systematic Reviews 2018, Issue 7. [DOI: 10.1002/14651858.CD012345.pub2] [DOI] [PMC free article] [PubMed] [Google Scholar]
Aburto 2013a
- Aburto NJ, Ziolkovska A, Hooper L, Elliott P, Cappuccio FP, Meerpohl JJ. Effect of lower sodium intake on health: systematic review and meta‐analysis. BMJ 2013;346:F1326. [DOI: 10.1136/bmj.f1326] [DOI] [PMC free article] [PubMed] [Google Scholar]
Aburto 2013b
- Aburto NJ, Hanson S, Gutierrez H, Hooper L, Elliott P, Cappuccio FP. Effect of increased potassium intake on cardiovascular risk factors and disease: systematic review and meta‐analysis. BMJ 2013;346:f1378. [DOI: 10.1136/bmj.f1378] [DOI] [PMC free article] [PubMed] [Google Scholar]
AIHW 2016
- Australian Institute of Health and Welfare 2016. The burden of disease and injury in Australia 2011. www.aihw.gov.au/getmedia/d4df9251‐c4b6‐452f‐a877‐8370b6124219/19663.pdf.aspx?inline=true. Canberra: AIHW, (accessed 30 Sept 2017). [ISBN 978‐1‐74249‐908‐6 ]
Baylink 1993
- Baylink DJ, Finkelman RD, Mohan S. Growth factors to stimulate bone formation. Journal of Bone and Mineral Research 1993;8:S565‐72. [DOI] [PubMed] [Google Scholar]
Berkley 1995
- Berkley CS, Hoaglin DC, Mosteller F, Colditz GA. A random‐effects regression model for meta‐analysis. Statistics in Medicine 1995;14(4):395‐411. [DOI] [PubMed] [Google Scholar]
BHF 2017
- British Heart Foundation. Cardiovascular disease. www.bhf.org.uk/heart‐health/conditions/cardiovascular‐disease.aspx (accessed 30 Sept 2017).
Bibus 2015
- Bibus D, Lands B. Balancing proportions of competing omega‐3 and omega‐6 highly unsaturated fatty acids (HUFA) in tissue lipids. Prostaglandins, Leukotrienes and Essential Fatty Acids 2015;99:19‐23. [DOI] [PubMed] [Google Scholar]
Brown 2017
- Brown T, Song F, Wang X, Brainard J, Hooper L. Dietary polyunsaturated fat for prevention and treatment of type 2 diabetes mellitus. PROSPERO 2017 CRD42017064110. Available from: www.crd.york.ac.uk/PROSPERO/display_record.php?ID=CRD42017064110.
Calder 2013
- Calder PC. Omega‐3 polyunsaturated fatty acids and inflammatory processes: nutrition or pharmacology?. British Journal of Clinical Pharmacology 2013;75(3):645‐62. [DOI] [PMC free article] [PubMed] [Google Scholar]
Chan 2004a
- Chan AW, Hróbjartsson A, Haahr MT, Gøtzsche PC, Altman DG. Empirical evidence for selective reporting of outcomes in randomized trials: comparison of protocols to published articles. JAMA 2004;291:2457‐65. [DOI] [PubMed] [Google Scholar]
Chan 2004b
- Chan AW, Krleža‐Jeric K, Schmid I, Altman DG. Outcome reporting bias in randomized trials funded by the Canadian Institutes of Health Research. Canadian Medical Association Journal 2004;171:735‐740. [DOI] [PMC free article] [PubMed] [Google Scholar]
Chowdhury 2014
- Chowdhury R, Warnakula S, Kunutsor S, Crowe F, Ward HA, Johnson L, et al. Association of dietary, circulating, and supplement fatty acids with coronary risk: a systematic review and meta‐analysis. Annals of Internal Medicine 2014;160(6):398‐406. [DOI] [PubMed] [Google Scholar]
De Souza 2015
- Souza RJ, Mente A, Maroleanu A, Cozma AI, Ha V, Kishibe T, et al. Intake of saturated and trans unsaturated fatty acids and risk of all cause mortality, cardiovascular disease, and type 2 diabetes: systematic review and meta‐analysis of observational studies. BMJ 2015;351:h3978. [DOI: 10.1136/bmj.h3978] [DOI] [PMC free article] [PubMed] [Google Scholar]
Eckel 2014
- Eckel RH, Jakicic JM, Ard JD, Hubbard VS, Jesus JM, Lee I‐M, et al. 2013 AHA/ACC guideline on lifestyle management to reduce cardiovascular risk: a report of the American College of Cardiology/American Heart Association Task Force on Practice Guidelines. Circulation 2014;129(25 Suppl 2):S76‐99. [DOI: 10.1161/01.cir.0000437740.48606.d1] [DOI] [PubMed] [Google Scholar]
Esrey 1996
- Esrey KL, Joseph L, Grover SA. Relationship between dietary intake and coronary heart disease mortality: lipid research clinics prevalence follow‐up study. Journal of Clinical Epidemiology 1996;49(2):211‐6. [DOI] [PubMed] [Google Scholar]
Evidence Based Medicine Toolkit 2008
- Buckingham J, Fisher B, Saunders D. Evidence Based Medicine Toolkit. 2008. www.ebm.med.ualberta.ca/TherapyCalc.html (accessed 28 March 2018).
Farvid 2014
- Farvid MS, Ding M, Pan A, Sun Q, Chiuve SE, Steffen LM, et al. Dietary linoleic acid and risk of coronary heart disease: a systematic review and meta‐analysis of prospective cohort studies. Circulation 2014;130(18):1568‐78. [DOI] [PMC free article] [PubMed] [Google Scholar]
Gaziano 2010
- Gaziano TA, Bitton A, Anand S, Abrahams‐Gessel S, Murphy A. Growing epidemic of coronary heart disease in low‐ and middle‐income countries. Current Problems in Cardiology 2010;35(2):72‐115. [DOI] [PMC free article] [PubMed] [Google Scholar]
GRADEpro GDT 2015 [Computer program]
- McMaster University (developed by Evidence Prime, Inc). GRADEpro GDT. Version accessed 30 September 2017. Hamilton (ON): McMaster University (developed by Evidence Prime, Inc), 2015.
Groff 1995
- Groff JL, Gropper SS, Hunt SM. Advanced Nutrition and Human Metabolism. 2nd Edition. New York: Wandsworth Publishing, 1995. [Google Scholar]
Hall 2009
- Hall WL. Dietary saturated and unsaturated fats as determinants of blood pressure and vascular function. Nutrition Research Reviews 2009;22(1):18‐38. [DOI] [PubMed] [Google Scholar]
Hanson 2017a
- Hanson S, Biswas P, Jimoh OF, O'Brien A, Hooper L, Abdelhamid A, et al. Dietary polyunsaturated fat for prevention and treatment of depression and anxiety. PROSPERO 2017 CRD42017056092. Available from: www.crd.york.ac.uk/PROSPERO/display_record.php?ID=CRD42017056092.
Hanson 2017b
- Hanson S, Thorpe G, Winstanley L, Abdelhamid A, Hooper L. Effects of supplementary dietary polyunsaturated fat on cancer incidence. PROSPERO 2017 CRD42017056092. Available from: www.crd.york.ac.uk/PROSPERO/display_record.php?ID=CRD42017056109.
Harris 2007
- Harris WS, Poston WC, Haddock CK. Tissue n‐3 and n‐6 fatty acids and risk for coronary heart disease events. Atherosclerosis 2007;193(1):1‐10. [DOI] [PubMed] [Google Scholar]
He 2003
- He K, Merchant A, Rimm EB, Rosner BA, Stampfer MJ, Willett WC, et al. Dietary fat intake and risk of stroke in male US healthcare professionals: 14 year prospective cohort study. BMJ 2003;327(7418):777‐82. [DOI] [PMC free article] [PubMed] [Google Scholar]
Higgins 2011
- Higgins JP, Green S (editors). Cochrane Handbook for Systematic Reviews of Interventions Version 5.1.0 (updated March 2011). The Cochrane Collaboration, 2011. Available from handbook.cochrane.org.
Hooper 2011
- Hooper L, Summerbell CD, Thompson R, Sills D, Roberts FG, Moore H, et al. Reduced or modified dietary fat for preventing cardiovascular disease. Cochrane Database of Systematic Reviews 2011, Issue 7. [DOI: 10.1002/14651858.CD002137.pub2] [DOI] [PMC free article] [PubMed] [Google Scholar]
Hooper 2015
- Hooper L, Martin N, Abdelhamid A, Davey Smith G. Reduction in saturated fat intake for cardiovascular disease. Cochrane Database of Systematic Reviews 2015, Issue 6. [DOI: 10.1002/14651858.CD011737] [DOI] [PubMed] [Google Scholar]
Hussein 2005
- Hussein N, Ah‐Sing E, Wilkinson P, Leach C, Griffin BA, Millward DJ. Long‐chain conversion of (13C) linoleic acid and alpha‐linolenic acid in response to marked changes in their dietary intake in men. Journal of Lipid Research 2005;46:269‐80. [DOI] [PubMed] [Google Scholar]
Jimoh 2017
- Jimoh OF, Brainard J, Deane KA, Biswas P, Donaldson D, Hooper L. Dietary polyunsaturated fat for prevention and treatment of neurocognitive disorders. PROSPERO 2017 CRD42017019049. Available from: www.crd.york.ac.uk/PROSPERO/display_record.php?ID=CRD42017019049.
Katan 2009
- Katan MB. Omega‐6 polyunsaturated fatty acids and coronary heart disease. American Journal of Clinical Nutrition 2009;89(5):1283‐4. [DOI] [PubMed] [Google Scholar]
Lefebvre 2011
- Lefebvre C, Manheimer E, Glanville J. Chapter 6: Searching for studies. In: Higgins JP, Green S (editors). Cochrane Handbook for Systematic Reviews of Interventions. Version 5.1.0 (updated March 2011). The Cochrane Collaboration, 2011. Available from www.cochrane‐handbook.org.
McGee 1984
- McGee DL, Reed DM, Yano K, Kagan A, Tillotson J. Ten‐year incidence of coronary heart disease in the Honolulu Heart Program: relationship to nutrient intake. American Journal of Epidemiology 1984;119(5):667‐76. [DOI] [PubMed] [Google Scholar]
Mensink 2003
- Mensink RP, Zock PL, Kester AD, Katan MB. Effects of dietary fatty acids and carbohydrates on the ratio of serum total to HDL cholesterol and on serum lipids and apolipoproteins: a meta‐analysis of 60 controlled trials. American Journal of Clinical Nutrition 2003;77(5):1146‐55. [DOI] [PubMed] [Google Scholar]
Mensink 2016
- Mensink RP. Effects of Saturated Fatty Acids on Serum Lipids and Lipoproteins: a Systematic Review and Regression Analysis. Geneva: World Health Organization, 2016. [Google Scholar]
Mozaffarian 2010
- Mozaffarian D, Micha R, Wallace S. Effects on coronary heart disease of increasing polyunsaturated fat in place of saturated fat: a systematic review and meta‐analysis of randomized controlled trials. PLOS Medicine 2010;7(3):e1000252. [DOI] [PMC free article] [PubMed] [Google Scholar]
MRC 2002
- Medical Research Council. Cluster randomised trials: methodological and ethical considerations. MRC clinical trials series; 2002. www.cebma.org/wp‐content/uploads/Cluster‐randomised‐trials‐Methodological‐and‐ethical‐considerations.pdf (accessed 28 March 2018).
Müller‐Nordhorn 2008
- Müller‐Nordhorn J, Binting S, Roll S, Willich SN. An update on regional variation in cardiovascular mortality within Europe. European Heart Journal 2008;29(10):1316‐26. [DOI] [PubMed] [Google Scholar]
NHS 2016
- National Health Service. Atherosclerosis (arteriosclerosis). www.nhs.uk/conditions/atherosclerosis/pages/introduction.aspx (accessed 30 Sept 2017)).
Pietinen 1997
- Pietinen P, Ascherio P, Korhonen P, Hartman A, Willett WC, Albanes D, et al. Intake of fatty acids and risk of coronary heart disease in a cohort of Finnish men. The Alpha‐Tocopherol, Beta‐Carotene Cancer Prevention Study. American Journal of Epidemiology 1997;145(10):876‐87. [DOI] [PubMed] [Google Scholar]
Ramsden 2010
- Ramsden CE, Hibbeln JR, Majchrzak SF, Davis JM. N‐6 Fatty acid‐specific and mixed polyunsaturate dietary interventions have different effects on CHD risk: a meta‐analysis of randomised controlled trials. British Journal of Nutrition 2010;104(11):1586‐600. [DOI] [PMC free article] [PubMed] [Google Scholar]
Ramsden 2016
- Ramsden CE, Zamora D, Majchrzak‐Hong S, Faurot KR, Broste SK, Frantz RP, et al. Re‐evaluation of the traditional diet‐heart hypothesis: analysis of recovered data from Minnesota Coronary Experiment (1968‐73). BMJ 2016;353:i1246. [DOI] [PMC free article] [PubMed] [Google Scholar]
RevMan 2014 [Computer program]
- The Nordic Cochrane Centre, The Cochrane Collaboration. Review Manager (RevMan). Version 5.3. Copenhagen: The Nordic Cochrane Centre, The Cochrane Collaboration, 2014.
Rincón‐Cervera 2009
- Rincón‐Cervera M, Rodríguez‐García I, Guil‐Guerrero J. Purification of GLA‐triglycerides from evening primrose oil by gravimetric column chromatography. Journal of the American Oil Chemists' Society 2009;86(7):605‐9. [Google Scholar]
Roberts 2015
- Roberts I, Ker K, Edwards P, Beecher D, Manno D, Sydenham E. The knowledge system underpinning healthcare is not fit for purpose and must change. BMJ 2015;350:h2463. [DOI: 10.1136/bmj.h2463] [DOI] [PubMed] [Google Scholar]
Russo 2009
- Russo GL. Dietary n‐6 and n‐3 polyunsaturated fatty acids: from biochemistry to clinical implications in cardiovascular prevention. Biochemical Pharmacology 2009;77(6):937‐46. [DOI] [PubMed] [Google Scholar]
Sacks 2017
- Sacks FM, Lichtenstein AH, Wu JHY, Appel LJ, Creager MA, Kris‐Etherton PM, et al. Dietary fats and cardiovascular disease: a presidential advisory from the American Heart Association. Circulation 2017;136:e1‐e23. [DOI: 10.1161/CIR.0000000000000510] [DOI] [PubMed] [Google Scholar]
Savovic 2012
- Savovic J, Jones H, Altman D, Harris R, Jüni P, Pildal J, et al. Influence of reported study design characteristics on intervention effect estimates from randomised controlled trials: combined analysis of meta‐epidemiological studies. Health Technology Assessment 2012;16:1‐82. [DOI] [PubMed] [Google Scholar]
Schultz 1995
- Schulz KF, Chalmers I, Hayes RJ, Altman DG. Empirical evidence of bias. Dimensions of methodological quality associated with estimates of treatment effects in controlled trials. JAMA 1995;273(5):408‐12. [DOI] [PubMed] [Google Scholar]
Schünemann 2013
- Schünemann H, Brożek J, Guyatt G, Oxman A, editor(s). Handbook for grading the quality of evidence and the strength of recommendations using the GRADE approach (updated October 2013). GRADE Working Group, 2013. Available from gdt.guidelinedevelopment.org/app/handbook/handbook.html.
Sharp 1998
- Sharp S. Meta‐analysis regression. Stata Technical Bulletin 1998;42:16‐22. [Google Scholar]
Siriwardhana 2012
- Siriwardhana N, Kalupahana NS, Fletcher S, Xin W, Claycombe KJ, Quignard‐Boulange A, et al. N‐3 and n‐6 polyunsaturated fatty acids differentially regulate adipose angiotensinogen and other inflammatory adipokines in part via NF‐κB‐dependent mechanisms. Journal of Nutritional Biochemisty 2012;23(12):1661‐7. [DOI: 10.1016/j.jnutbio.2011.11.009] [DOI] [PubMed] [Google Scholar]
Spagnoli 2007
- Spagnoli L, Bonanno E, Sangiorgi G, Mauriello A. Role of inflammation in atherosclerosis. Journal of Nuclear Medicine 2007;48(11):1800‐15. [DOI] [PubMed] [Google Scholar]
Thorpe 2017
- Thorpe G, Ajabnoor S, Ahmed Z, Abdelhamid A, Hooper L. Dietary polyunsaturated fat for prevention and treatment of inflammatory bowel disease. Dietary polyunsaturated fat for prevention and treatment of inflammatory bowel disease. PROSPERO 2017 CRD42017068704. Available from: www.crd.york.ac.uk/PROSPERO/display_record.php?ID=CRD42017068704.
Tortosa‐Caparós 2017
- Tortosa‐Caparrós E, Navas‐Carrillo D, Marín F, Orenes‐Piñero E. Anti‐inflammatory effects of omega 3 and omega 6 polyunsaturated fatty acids in cardiovascular disease and metabolic syndrome. Critical Reviews in Food Science and Nutrition 2017;57(16):3421‐9. [DOI: 10.1080/10408398.2015.1126549] [DOI] [PubMed] [Google Scholar]
WHO 2003
- Joint WHO/FAO Expert Consultation on Diet, Nutrition and the Prevention of Chronic Diseases. Diet, nutrition and the prevention of chronic diseases: report of a joint WHO/FAO expert consultation. Geneva: World Health Organization; 2003. WHO technical report series: 916. [ISBN 92 4 120916 X; apps.who.int/iris/bitstream/10665/42665/1/WHO_TRS_916.pdf]
WHO 2017
- World Health Organization. Cardiovascular diseases (CVDs). Fact sheet number 317. www.who.int/mediacentre/factsheets/fs317/en (accessed 30 Sept 2017).
Wood 2008
- Wood L, Egger M, Gluud LL, Schulz K, Jüni P, Altman DG, et al. Empirical evidence of bias in treatment effect estimates in controlled trials with different interventions and outcomes: meta‐epidemiological study. BMJ 2008;336:601‐5. [DOI] [PMC free article] [PubMed] [Google Scholar]
Wu 2017
- Wu JHY, Marklund M, Imamura F, Tintle N, Ardisson KAV, Goede J, et al. Omega‐6 fatty acid biomarkers and incident type 2 diabetes: pooled analysis of individual‐level data for 39740 adults from 20 prospective cohort studies. Lancet Diabetes & Endocrinology 2017;5(12):965‐74. [DOI: 10.1016/S2213-8587(17)30307-8] [DOI] [PMC free article] [PubMed] [Google Scholar]
References to other published versions of this review
Al‐Khudairy 2015
- Al‐Khudairy L, Hartley L, Clar C, Flowers N, Hooper L, Rees K. Omega 6 fatty acids for the primary prevention of cardiovascular disease. Cochrane Database of Systematic Reviews 2015;11:CD011094. [DOI] [PubMed] [Google Scholar]
Hartley 2014
- Hartley L, Clar C, Flowers N, Hooper L, Rees K. Omega 6 fatty acids for the primary prevention of cardiovascular disease. Cochrane Database of Systematic Reviews 2014, Issue 5. [DOI: 10.1002/14651858.CD011094] [DOI] [PubMed] [Google Scholar]